
KNIME Analytics Platform offers a variety of machine learning algorithms and data transformation techniques to fit your data within a custom training workflow. Once the ML model achieves a good performance, and satisfies your organization's policies, you can capture all the workflow segments and combine them in a production workflow.
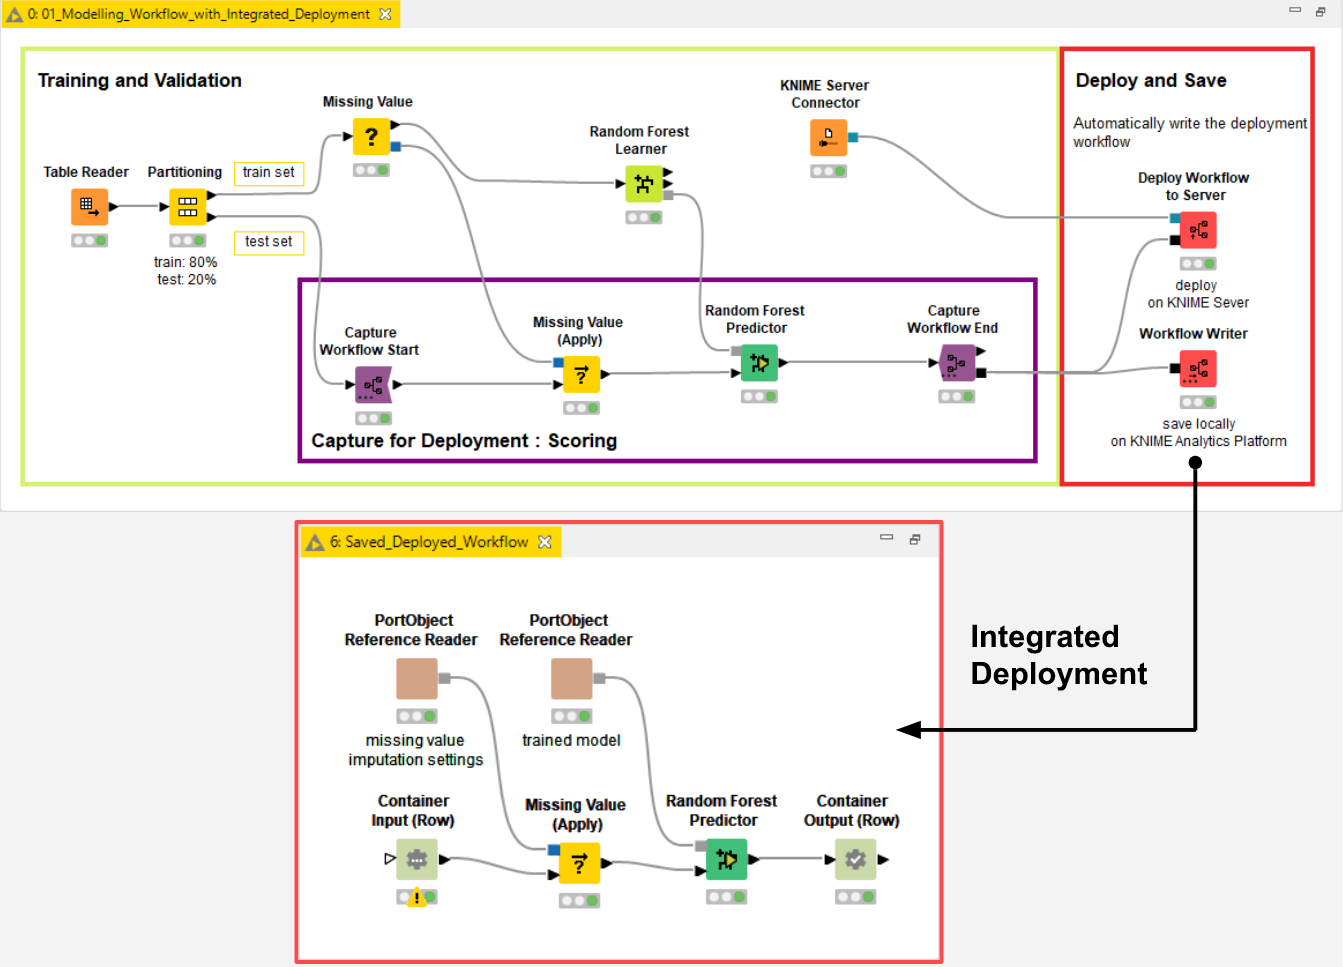
Capturing the production workflow from the training workflow can be done both manually or automatically with the KNIME Integrated Deployment approach. The captured production workflow (Fig. 1) can be deployed on KNIME Server and exposed in an automated fashion to other applications as a data science service.
Once a production workflow is deployed on KNIME Server it has to be monitored. If the model inside the workflow was correctly validated, its performance at deployment time should be reliable, but this may not necessarily continue forever.
Due to data drift, there is rarely a guarantee that new data won’t change distribution. Any new event described in the new data can decrease your model's performance. In such cases immediate action is required and often entails retraining the model and redeploying the production workflow.
In this article, we demonstrate a Guided Analytics application: a sequence of web pages to be accessed via a web browser. The goal of the application is to allow a user to periodically evaluate prediction quality, looking for a drop in performance. In the event of a performance drop, the application enables the user to trigger an update of the production workflow.
The guided analytics workflow behind the application should have several components operating on the deployed production workflow. These components should manage the hidden loading and retraining; others should be interactive and offer views to monitor and control the deployed production workflow.
Read more about the concept of Integrated Deployment in the blog article, How to Move Data Science into Production.
Build an interactive view to monitor the ML model and re-evaluate performance during production on demand
First of all, let’s build an interactive component to monitor the machine learning model performance. Our guided analytics application is able to work with any classification model that can be dealt with as a black box. The goal is to re-evaluate the ML model performance during production on demand.
What we have:
- Trained ML model: A model trained with an aleatory machine learning algorithm: naive bayes, logistic regression, random forest, deep learning or any of the others.
- Production Workflow: A sequence of KNIME nodes able to digest raw data applying the necessary transformations before executing the trained ML model and returning the prediction probabilities. The resulting workflow can be queried either as a black box classifier ignoring its inner mechanics or it can be visually inspected (Fig. 1).
- Past deployment data: Formerly data where the model was applied during deployment, now stored and used for monitoring thanks to available timestamp. The data might show some data drift, that is a change in distribution.
- Additional rows for the validation set: The afore-mentioned past deployment data should also display ground truth. Ground truth was collected at a later stage when the deployment data was no longer fresh. Ground truth should be used as a target column for measuring performance of the model over time.
What we need:
- Interactive component: To run the production workflow on the deployment data, evaluate the performance against the new ground truth, and visualize it over time.
Model Monitor View - Verified Component
The verified component that we have built for this purpose is the Model Monitor View and it works as follows.
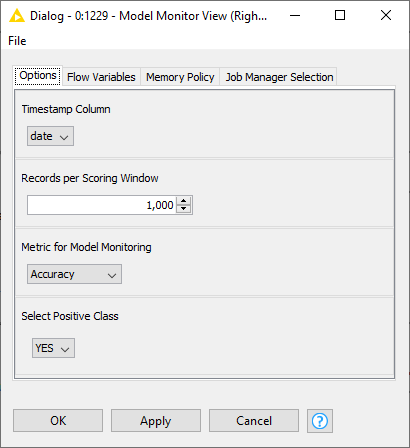
The input the user provides is the workflow object, captured with Integrated Deployment, and the past deployment data. The production workflow (e.g. as shown in Fig. 1) is defined within this input workflow object and contains the model as well as the required data preparation and feature engineering. Minimal configuration for the component is entered via a user friendly dialogue (Fig. 2):
- Timestamp column in the deployment data to show the date when the deployed production workflow was used.
- Size of the scoring window i.e., the granularity used in the line plot to show performance over time.
- Metric to be visualized e.g., the accuracy or F-measure,
- Class of interest in the ground truth column, which in binary classification is called positive class. The ground truth column name is automatically detected.
Visualize Performance
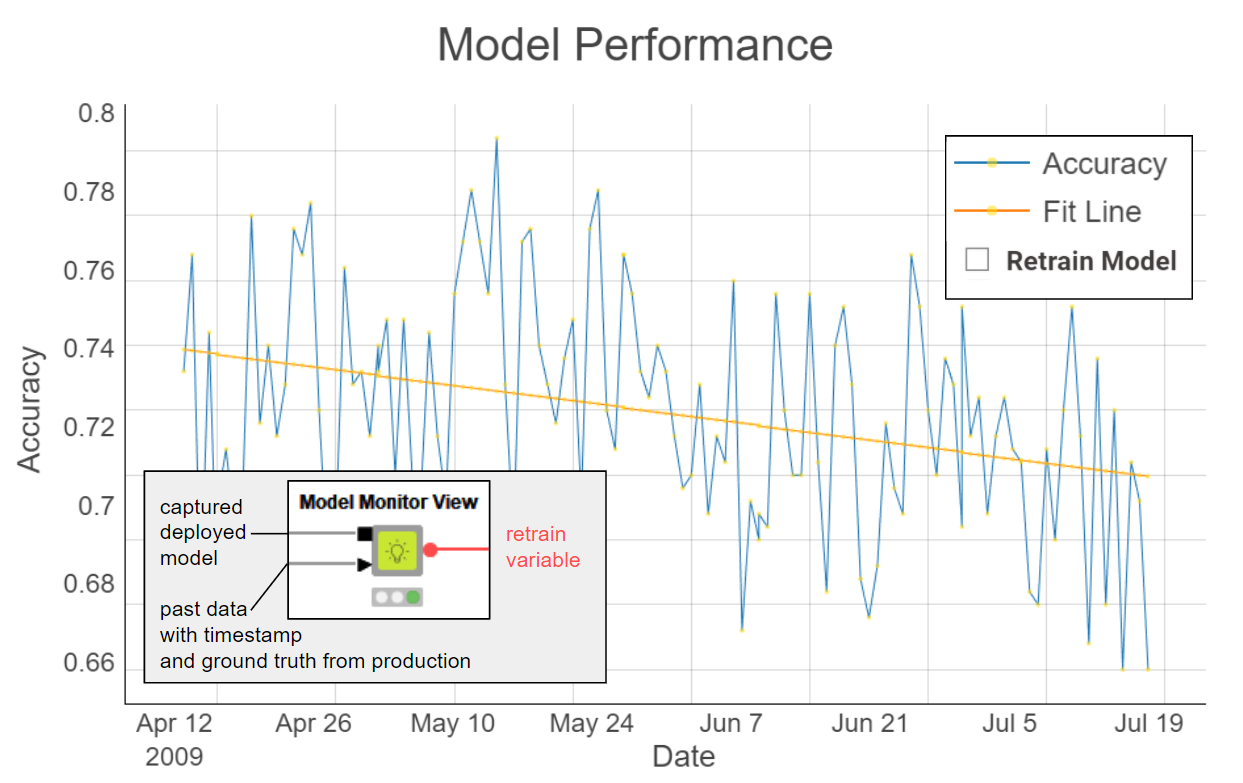
Finally, after executing the interactive component on those settings, performance is visualized in a Line Plot View node (Fig. 3). The x axis shows the timestamp and the y axis, performance. The same plot also displays a regression line to clearly show the overall increasing, decreasing or stationary trend: a decreasing trend, for example, would indicate a data drift phenomenon.
Based on this visualization of the current trend and performance, the user can decide whether or not the model should be retrained, via a checkbox. When doing so the output of the component is activated via a flow variable which can be attached to the workflow branch triggering the retraining of the model.
Notice that the Model Monitor View component uses Integrated Deployment: The Workflow Executor node can run the transparent production workflow as a black box model, making it easy and quick to use. Read more about using the KNIME Integrated Deployment Extension in this blog post collection.
Trigger Model Redeployment
In the previous interactive view (Fig. 3) we observed a data drift phenomenon. When this happens, the model needs to be re-trained and the new model performance compared with the current performance.
To do this comparison, we have built a variation of the Model Monitor View component which we call the Model Monitor View (Compare) component. It is a Verified Component designed for performance comparison with optional re-deploying triggers.
Let’s look at how it works:
The user provides two production workflows via workflow object inputs: the current production workflow and the newly re-trained one. Like the previous component the past deployment data is required.
The user configures the component similarly to the previous one except for one setting: “Date for Performance Comparison”. Here the user provides the date after which the two curves should be compared. The reason behind this setting is that some of the past deployment data was used during the re-training of the model and it cannot be used for comparison. To take away that data we exclude the rows by the date based on the user setting.
Once the interactive component is executed, the view updates to display the same line plot of Fig. 3, but with an additional curve for the newly re-trained model (Fig. 4). The new curve and its trend line should hopefully show improved performance given that more data was made available during training.
If this is the case the new production workflow, containing the new model, can be easily deployed with the KNIME Integrated Deployment approach enabling us to replace the previous production workflow at the click of a button. When the button is clicked, the output flow variable triggers a subsequent workflow branch to manage replacing the old production workflow with the new one.
Guided Analytics Application via KNIME WebPortal
By building a workflow using both of these interactive views - via the two verified interactive components' interactive composite views - you have a guided analytics application for the KNIME WebPortal, which you can use to monitor, re-train, compare production workflows containing different ML models, and easily replace them on KNIME Server if needed.
Notice that KNIME Integrated Deployment makes the components model-agnostic in a classification task.
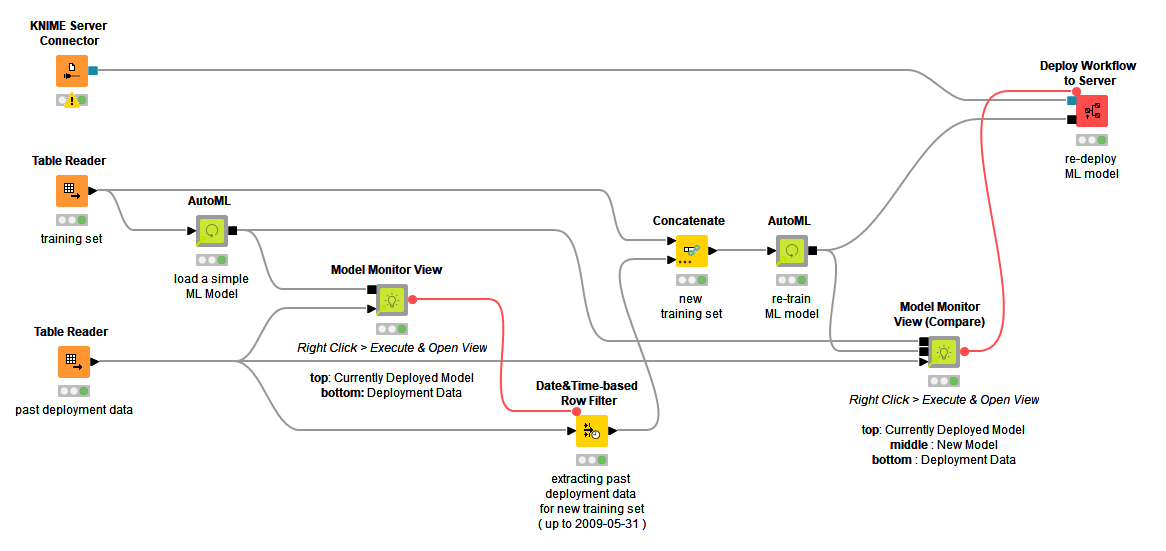
Example Workflow for Model Monitoring
The resulting workflow Model Monitoring with Integrated Deployment (Fig. 6), which implements our guided analytics application can be re-adjusted to your own deployment thanks to Integrated Deployment and Verified Components. The proposed framework can be adapted flexibly to any correctly captured classification model where enough deployment data was collected.
KNIME and Data Science Operations
We have seen how to operate on the load, monitor, re-train, and re-deploy production processes that contain ML models - from a single KNIME workflow that generates a Guided Analytics application.
Such an application operating within the KNIME Server is a great example of Data Science Operations (DSOps) controlling a production process, whether it deals with ML or not. In this article we have presented a number of features designed to empower you to build a custom application to easily control the entire Data Science Life Cycle.
We have shown you the pieces, it is now your turn to train, capture, trigger, deploy and monitor!
Recap of Features
- KNIME WebPortal and Guided Analytics let users control a complex process via a sequence of web pages surfacing an hidden KNIME workflow deployed on KNIME Server. The workflow behind the guided analytics application can be customized to monitor your model performance and trigger any required operation.
- Integrated Deployment offers a standardized way to manage production workflows, and the ML model within them: train, deploy, predict on new data, retrain and redeploy.
- Verified Components offer bundled, reliable and reusable functionalities given a few requirements and user-friendly configurations. In particular AutoML, XAI View, Monitor View and its Compare variant can be mixed and matched to manage production workflows containing ML models.
The Integrated Deployment KNIME Blog Articles
Explore the collection of articles on the topic of Integrated Deployment.