Getting Started Guide
for KNIME Analytics Platform
Table of Contents
- What is KNIME Analytics Platform?
- Getting set up with KNIME Analytics Platform
- Build your first workflow
- Nodes and workflows
- More examples
- Extensions and integrations
- KNIME Forum
What is KNIME Analytics Platform?
KNIME Analytics Platform is an open source software with an intuitive, visual interface that lets you build analyses of any complexity level - from automating spreadsheets to ETL to machine learning.
A more detailed explanation of the different views in the KNIME Workbench is provided in the KNIME Analytics Platform User Guide.
Getting Set Up with KNIME Analytics Platform

If you haven’t downloaded KNIME Analytics Platform yet, you can do so here.
Once you have installed KNIME Analytics Platform, you can start analyzing your data right away. The entry page is the first thing you will see. Here you can access three example workflows to get started, or, if you’re following along with this guide, create your first workflow from scratch.
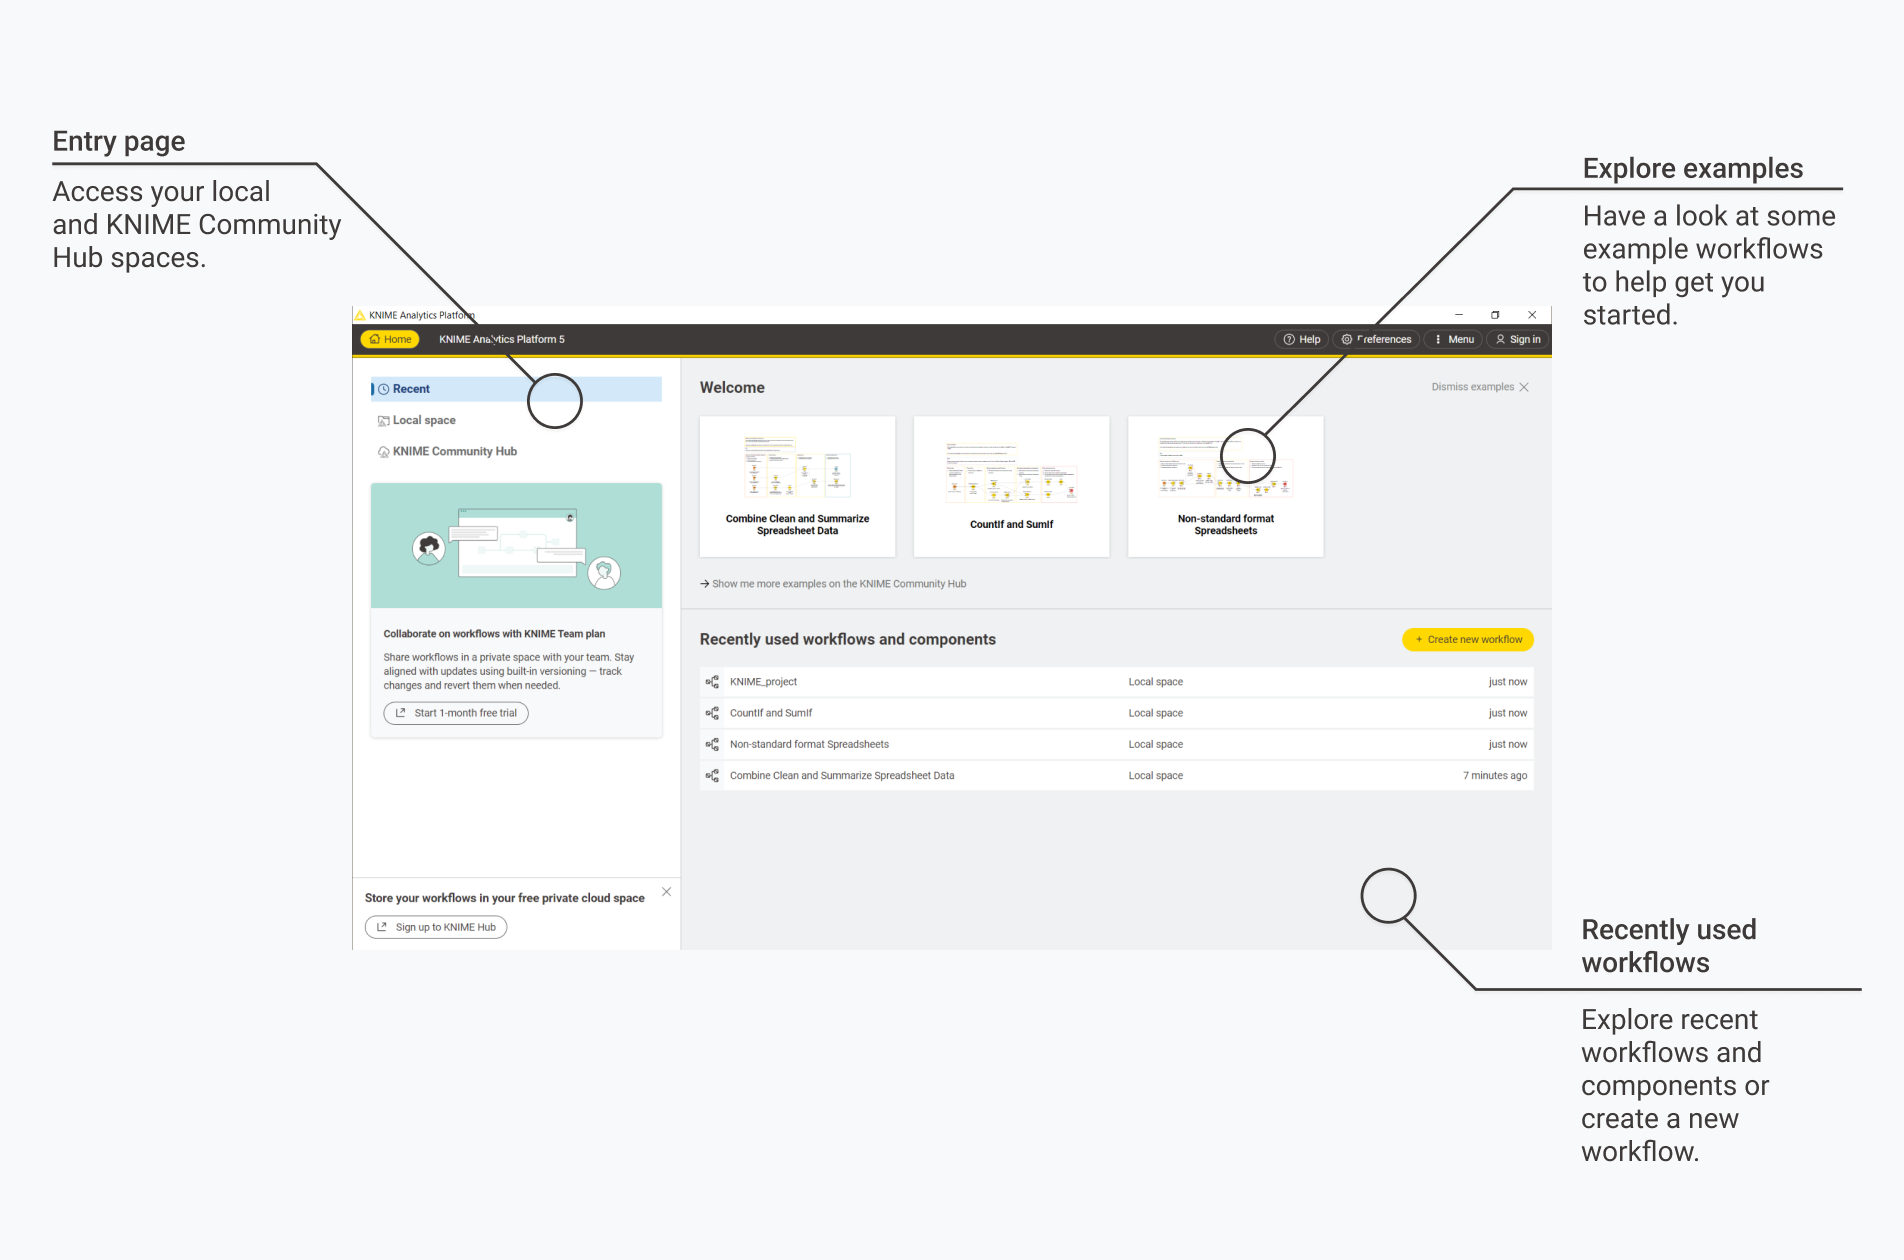
After you created your first empty workflow, you can start by dragging and dropping your data into the workflow editor to read them in and add nodes from the node repository to build your workflow. Each node performs a specific task and helps you proceed quickly into the manipulation, cleaning, and visualization of your data.
Connect the node’s ports to let the data flow from left to right into your workflow. Drag and drop a connection into an empty area inside the workflow canvas to display the quick node adding panel. Up to twelve nodes to help you build your workflow easier and faster are suggested. Also, you can search in the panel for all compatible nodes. Click the desired node to add it.
Build your First Workflow
You can follow along with this guide by either downloading the workflow and reading the guide to better understand it, or, attempting to build the workflow on your own. Either way, you can access the workflow at any time on KNIME Community Hub.
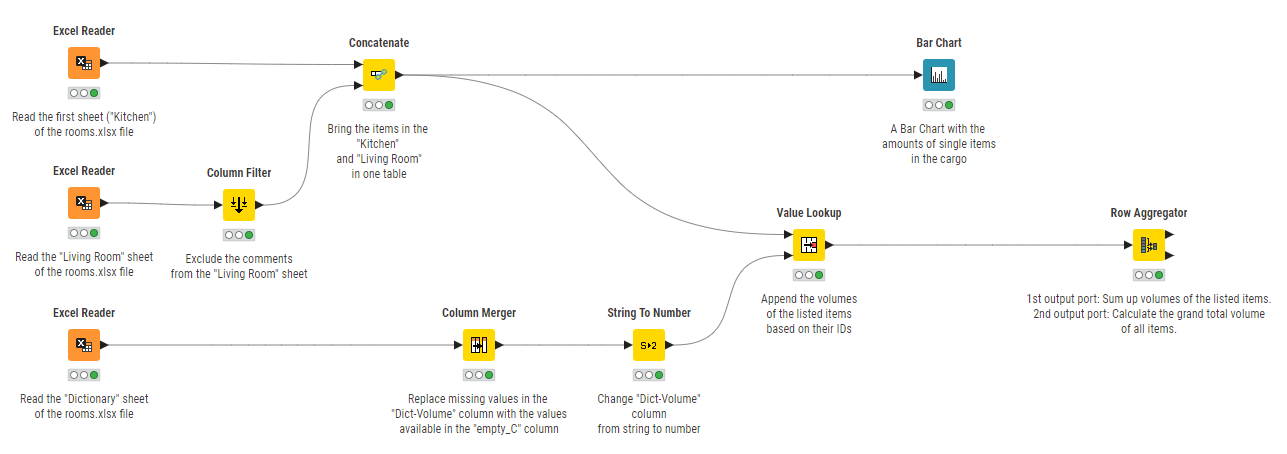
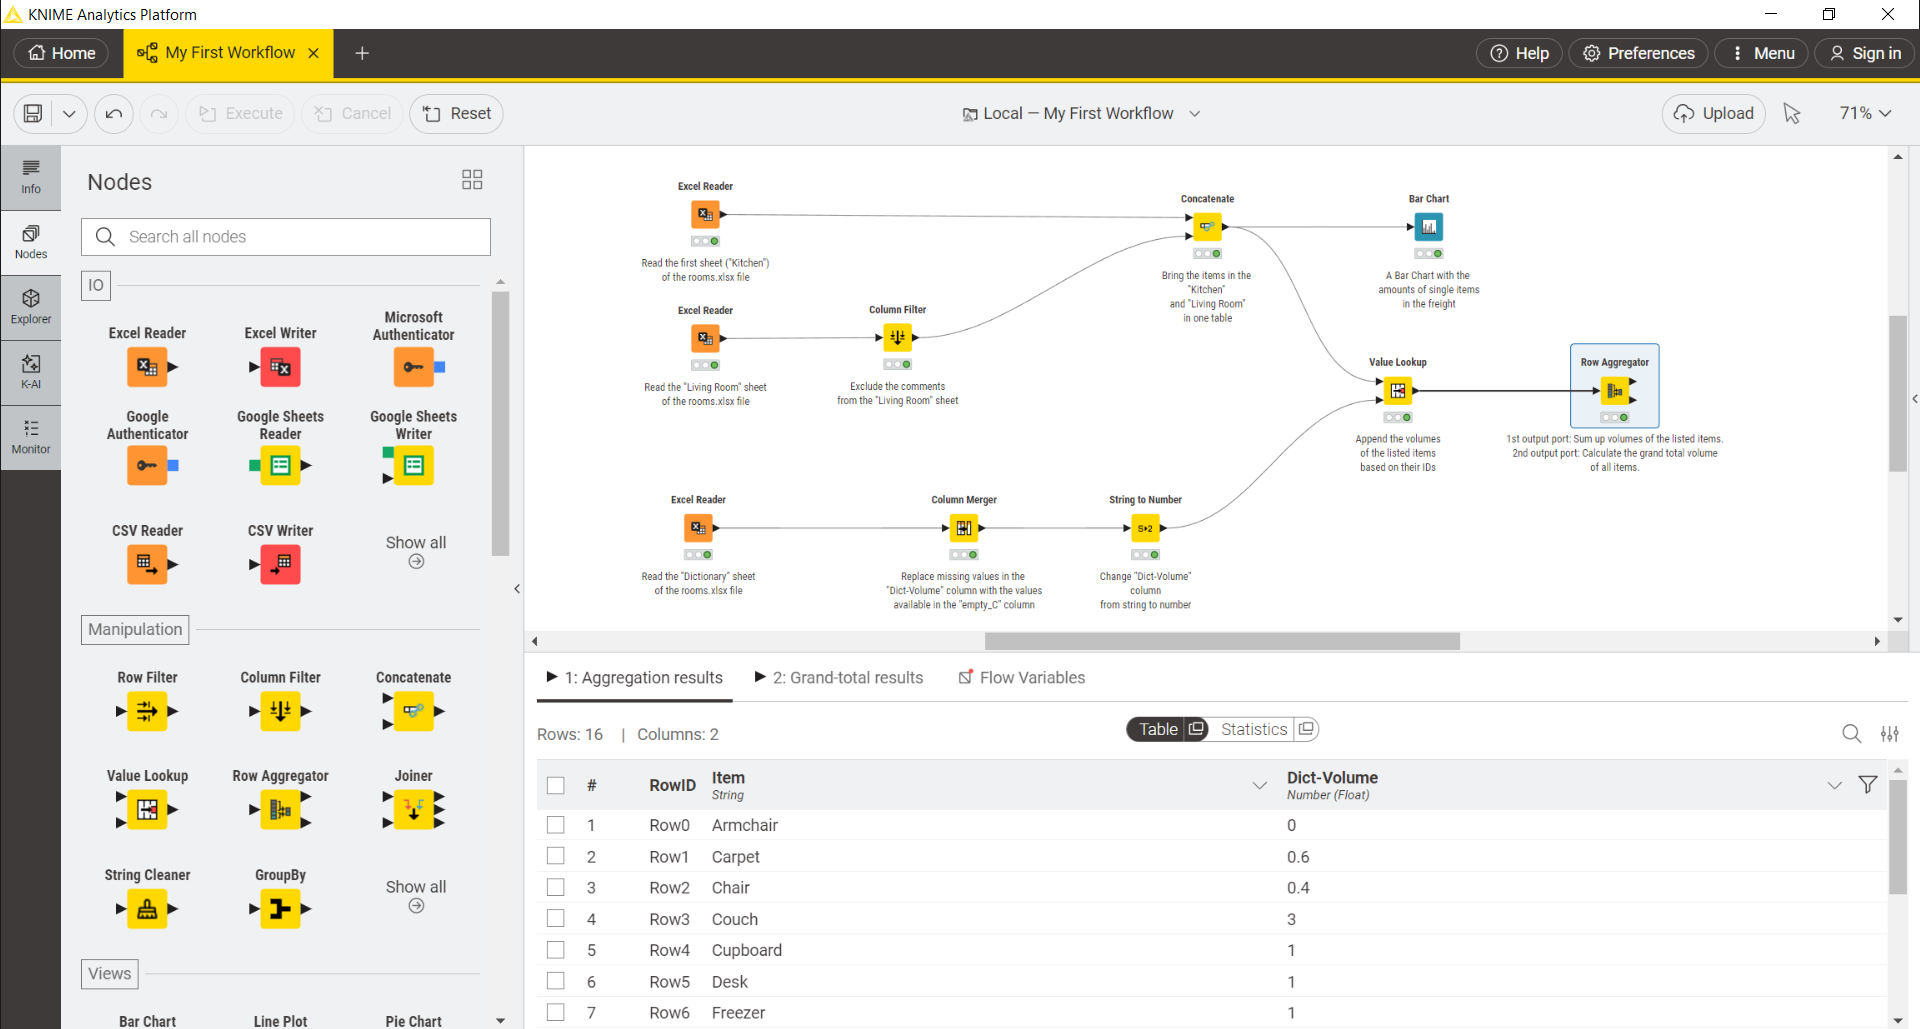
Now let’s say that you have some data that you want to process, analyze and visualize. With the following example workflow, you will read, combine, clean, and summarize data from multiple Excel sheets. Then you will calculate the total volume of a cargo that carries furniture from one house to another.
Step 1/6 – Download data and create new workflow
To get started, first download the xls file that contains the data that you are going to use in the workflow. Open your KNIME Analytics Platform and create a new, empty workflow by clicking the "Create new workflow" button on the entry page.
Step 2/6 - Drag and drop XLSX file into workbench editor
From the download folder, drag and drop the xlsx file into the workflow editor. An Excel Reader node will appear on the canvas. The node is already configured with the default settings. To open the configuration dialog of the node and inspect the settings, click the configuration cog button in the node action bar.
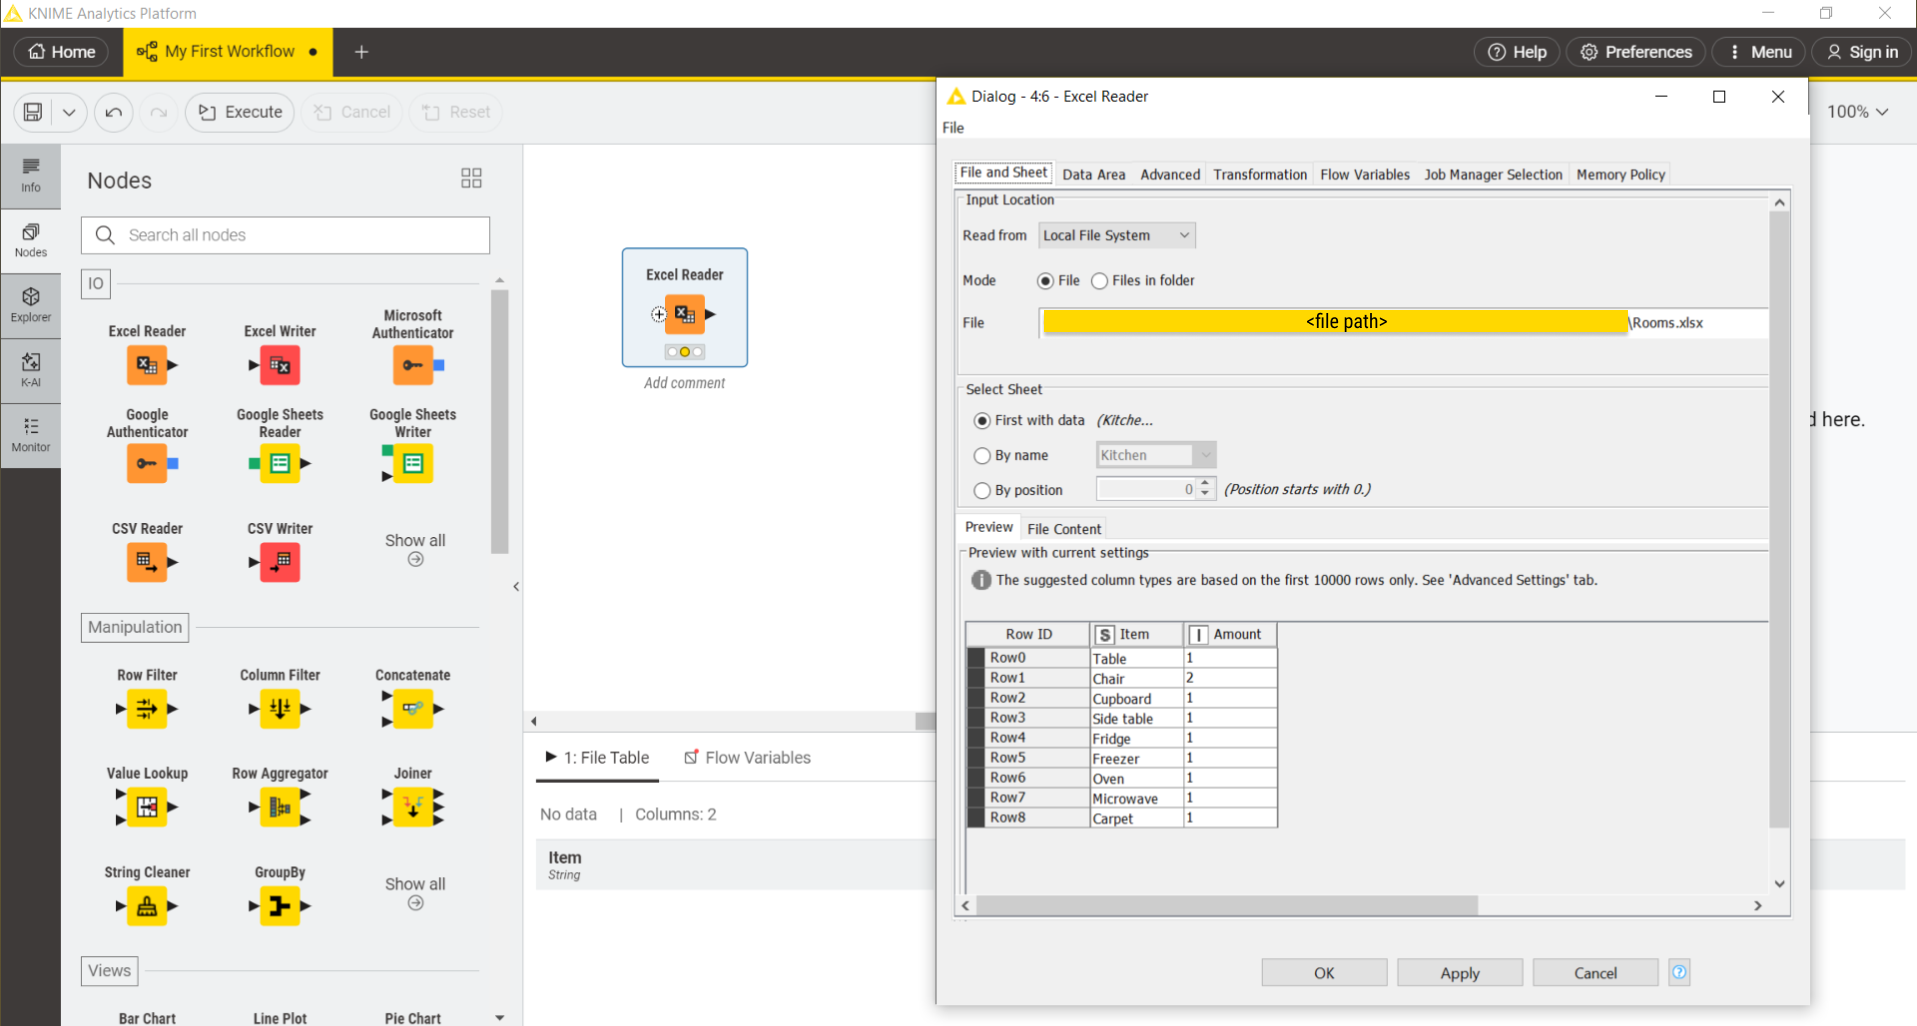
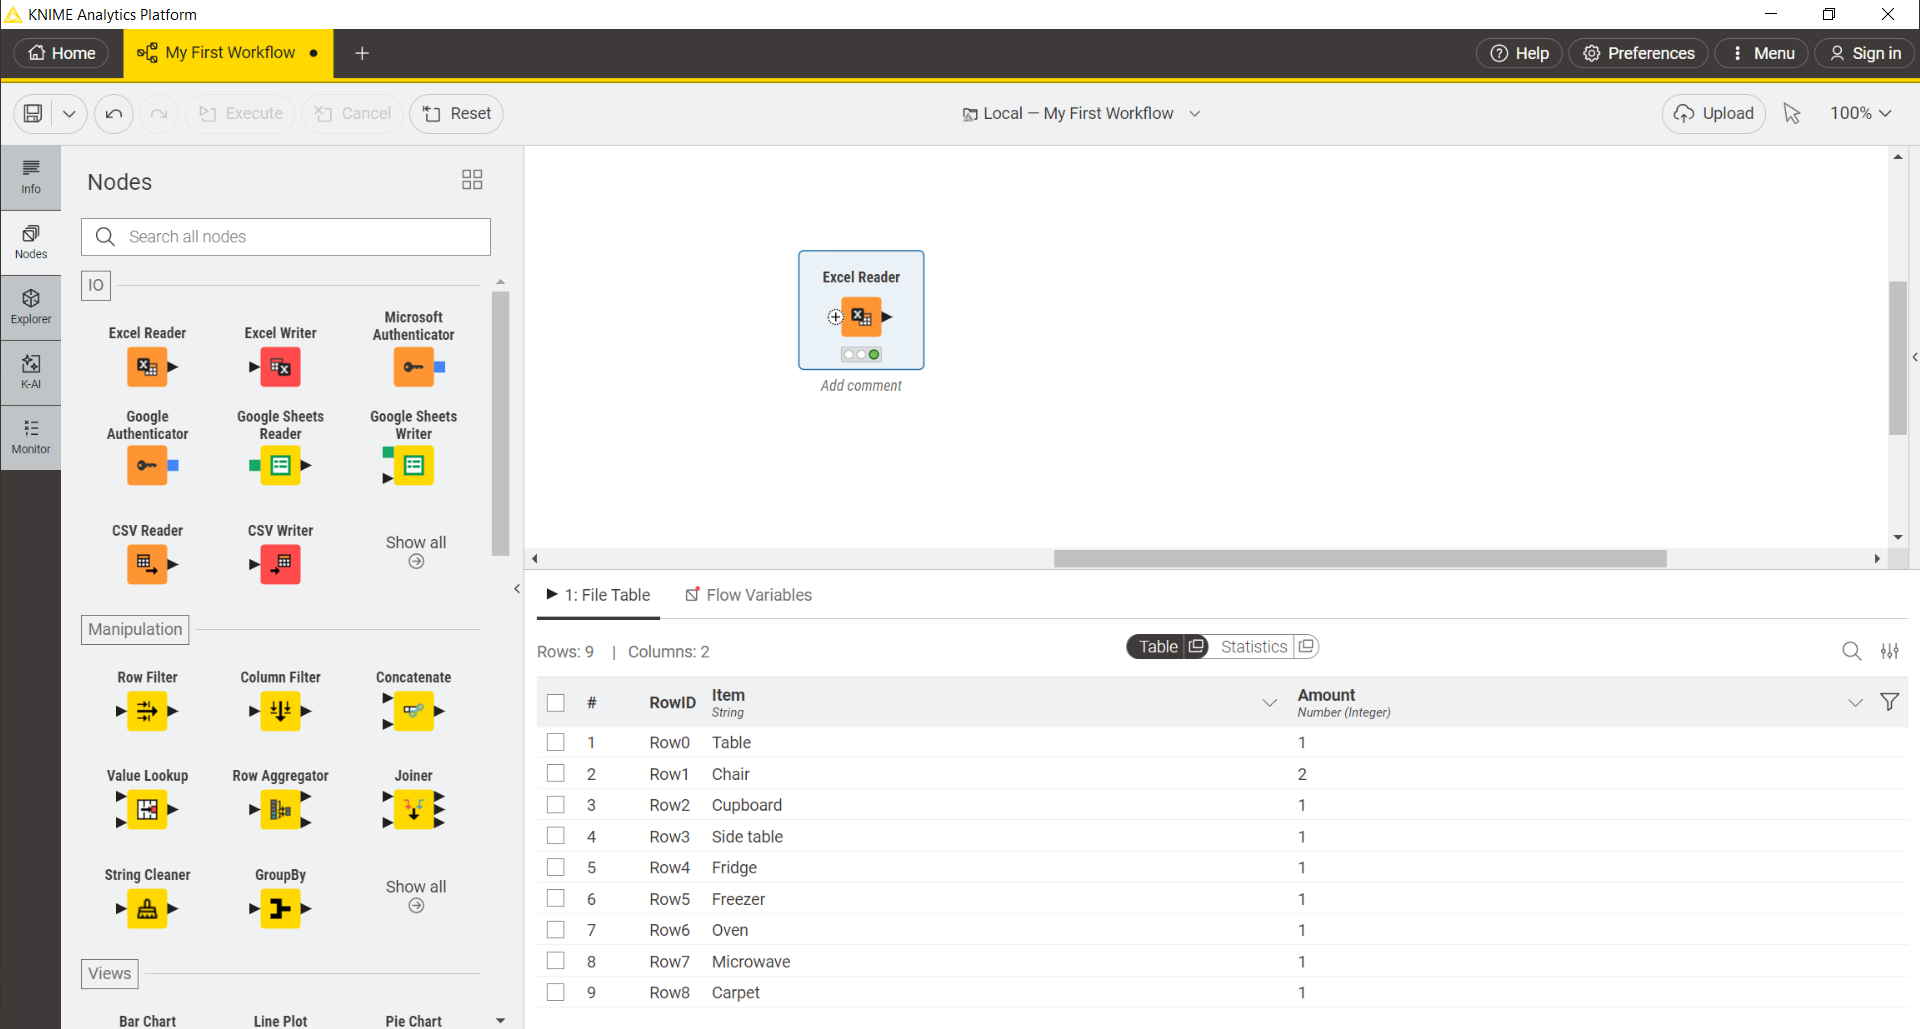
Here you can see the path to the file you dropped into the workflow editor and a preview of the data table. You can also select the sheet that you want to read the data from. First, read the data in the Kitchen sheet. Click OK and execute the Excel Reader node by clicking the play button in the node action bar. Now the input data are available at the output port of the Excel Reader node. After selecting the node, you can view the output table in the node monitor at the bottom of the workbench.
Next, drag and drop a second Excel Reader node from the node repository and configure it in such a way that it reads the same xlsx file but, this time, read in the data from the sheet called Living room.
Step 3/6 – Filter data with the Column Filter node
The data in the second sheet need to be cleaned. In fact, they contain a column named Comment that we want to filter out.
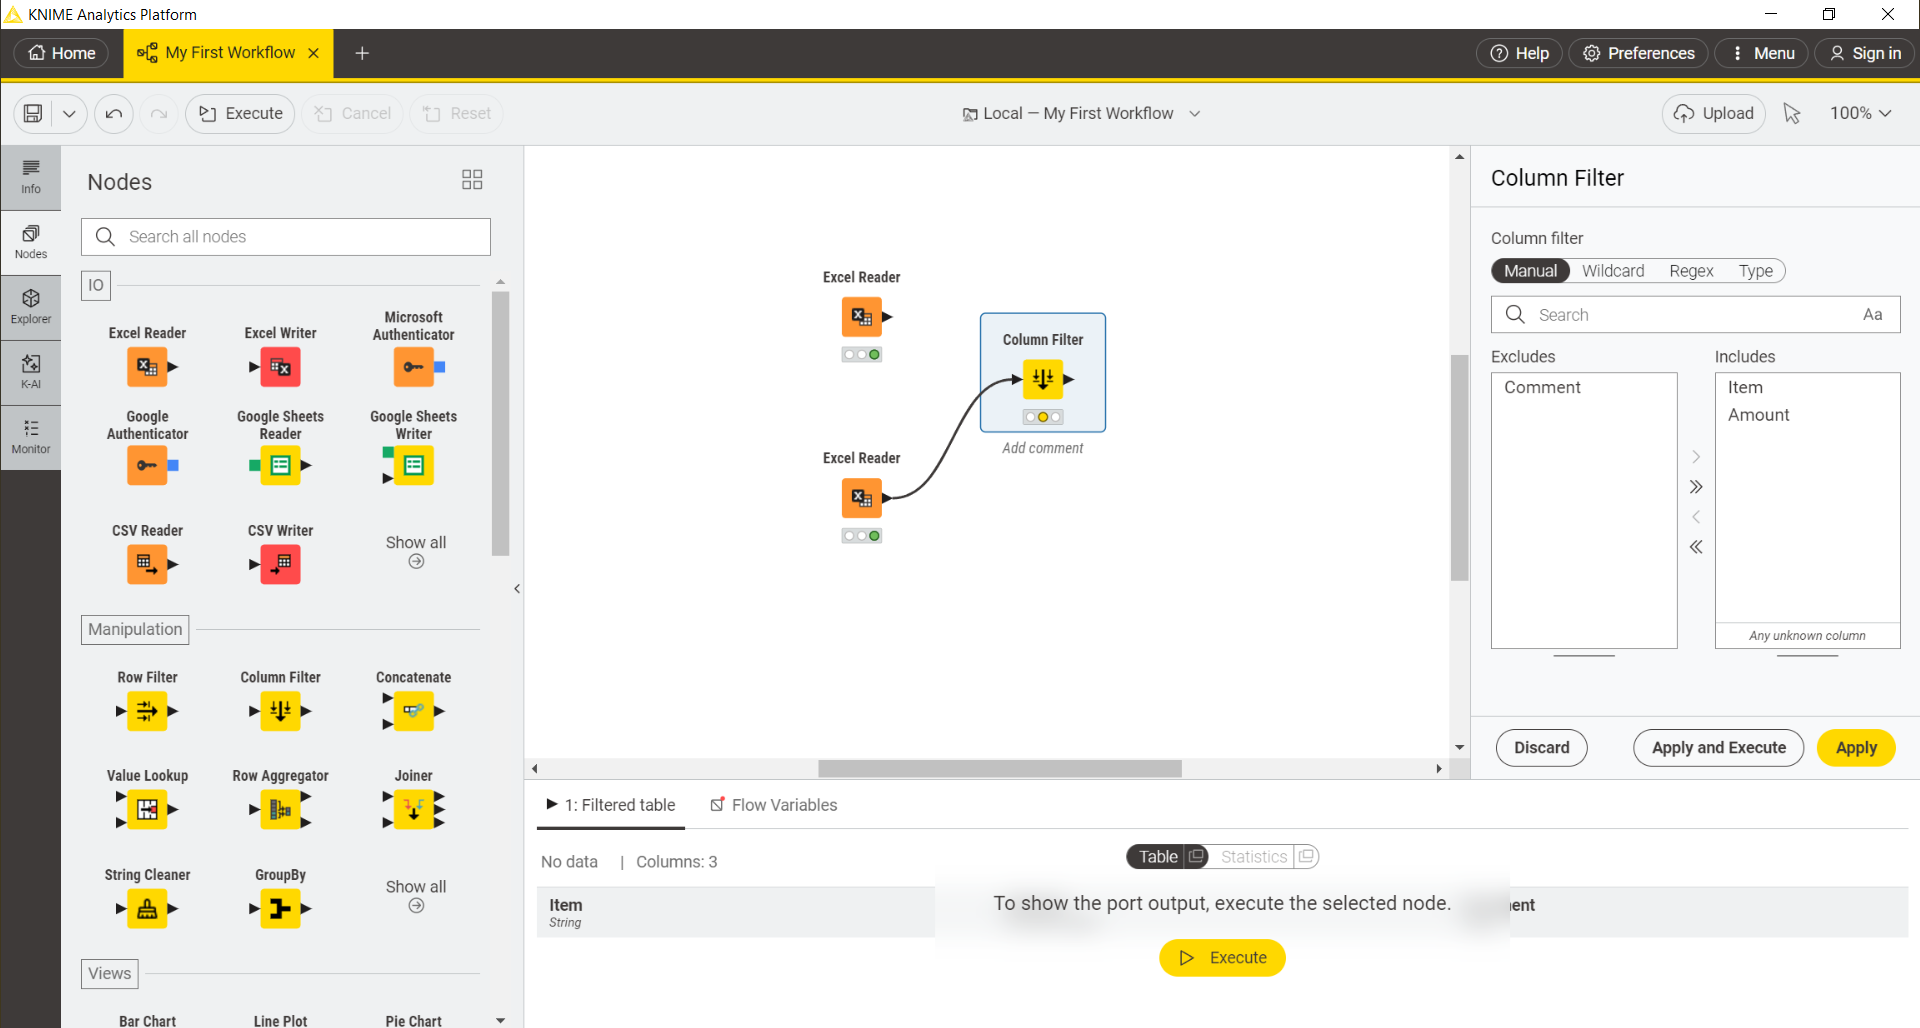
To do so, click the output port of the Excel Reader node and drag the arrow onto the blank workflow canvas. This action opens the quick node insertion panel. Type “Column Filter” into the search bar and click on the Column Filter node, as shown below. The arrow connects the output port of the Excel Reader node with the input port of the Column Filter node. That means that the file processed by the Excel Reader node will be passed on to the subsequent Column Filter node.
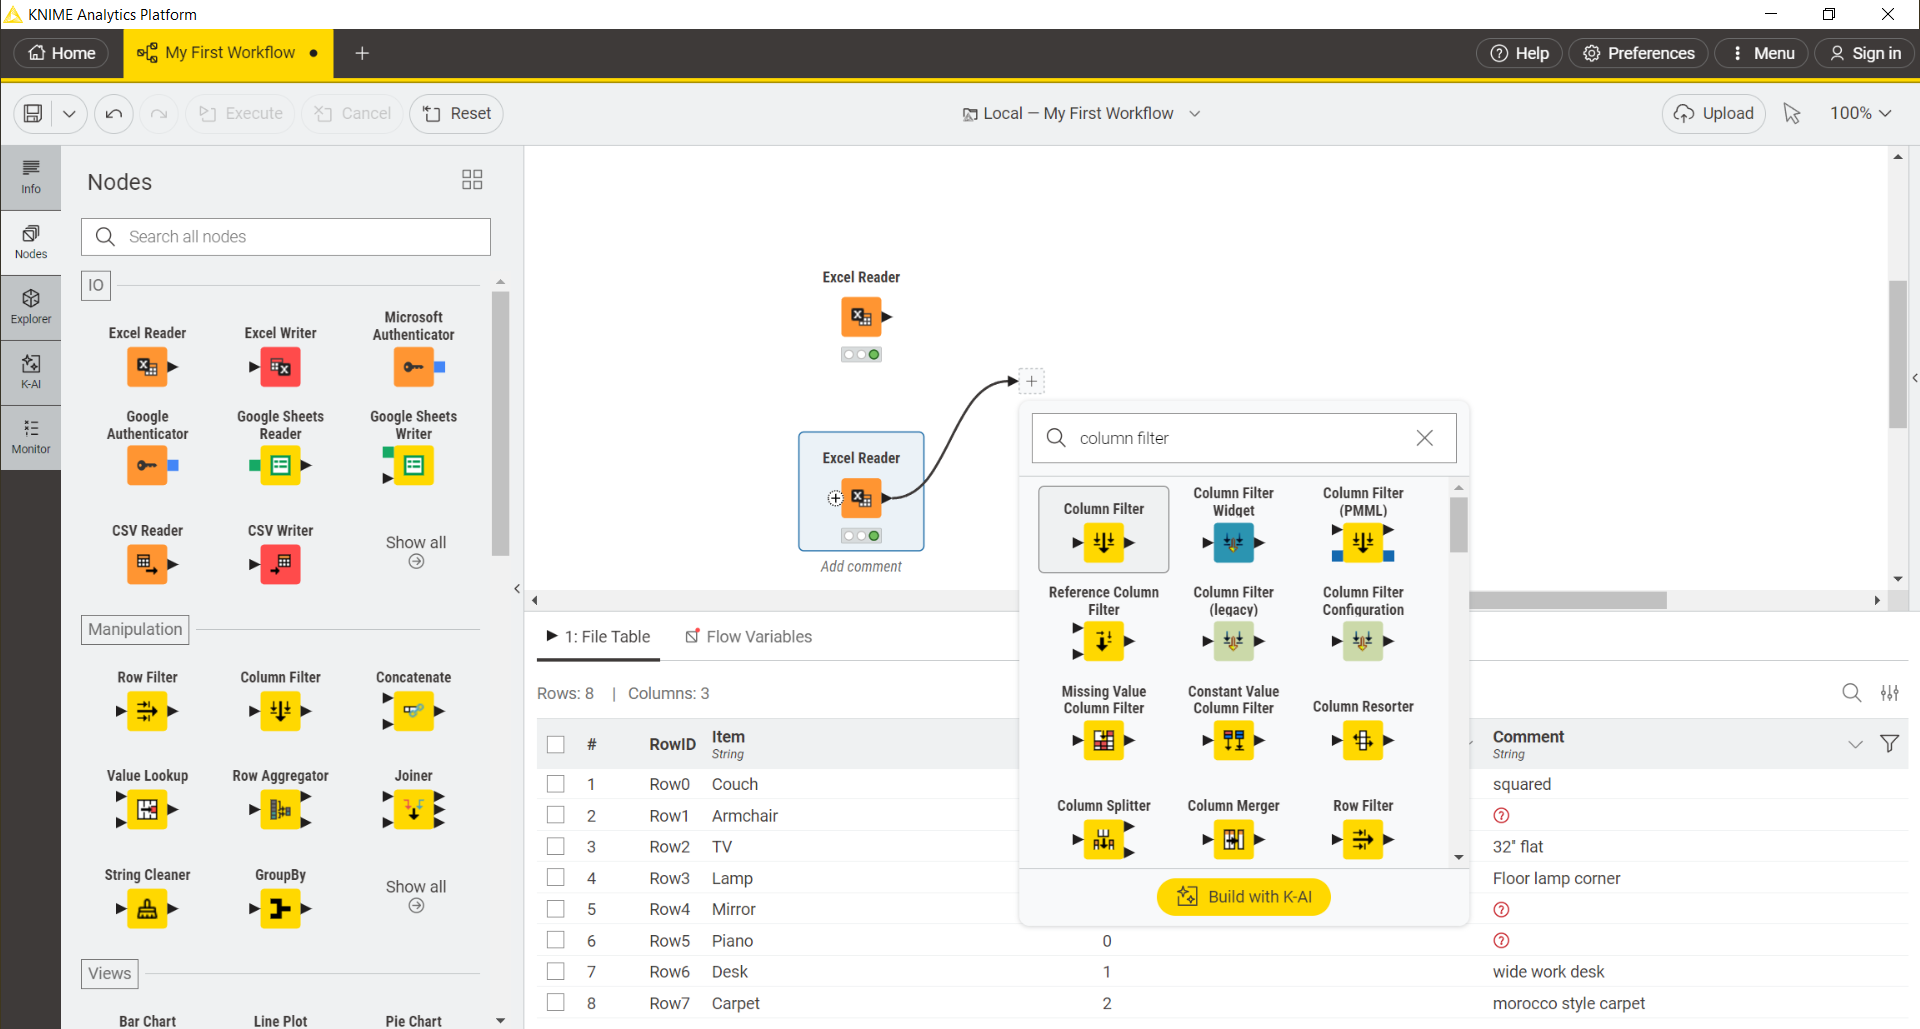
Select the node to show the configuration pane. Here, move the column Comment into the Excludes field by first selecting it from the list and then clicking the single arrow pointing to the left. Click apply and execute the node. Now the filtered data table is available at the output port of the Column Filter node.
Step 4/6 – Combine the data with Concatenate node
Now that you have cleaned up the data in the second sheet you can combine all the data in one table before proceeding with the next step.
To do so, click the output port of the first Excel Reader node and drag the arrow onto the blank workflow canvas. This action opens the quick node insertion panel. Type “Concatenate” into the search bar and click on the Concatenate node, as shown below. Since the data in the first input table did not need to be cleaned, it can serve as direct input for the Concatenate node. The arrow connects the output port of the Excel reader node with the first input port of the Concatenate node.
Then, connect the second input data table port of the Concatenate node to the output port of the Column Filter, which contains the cleaned-up data from the second Excel Reader node, as shown below.
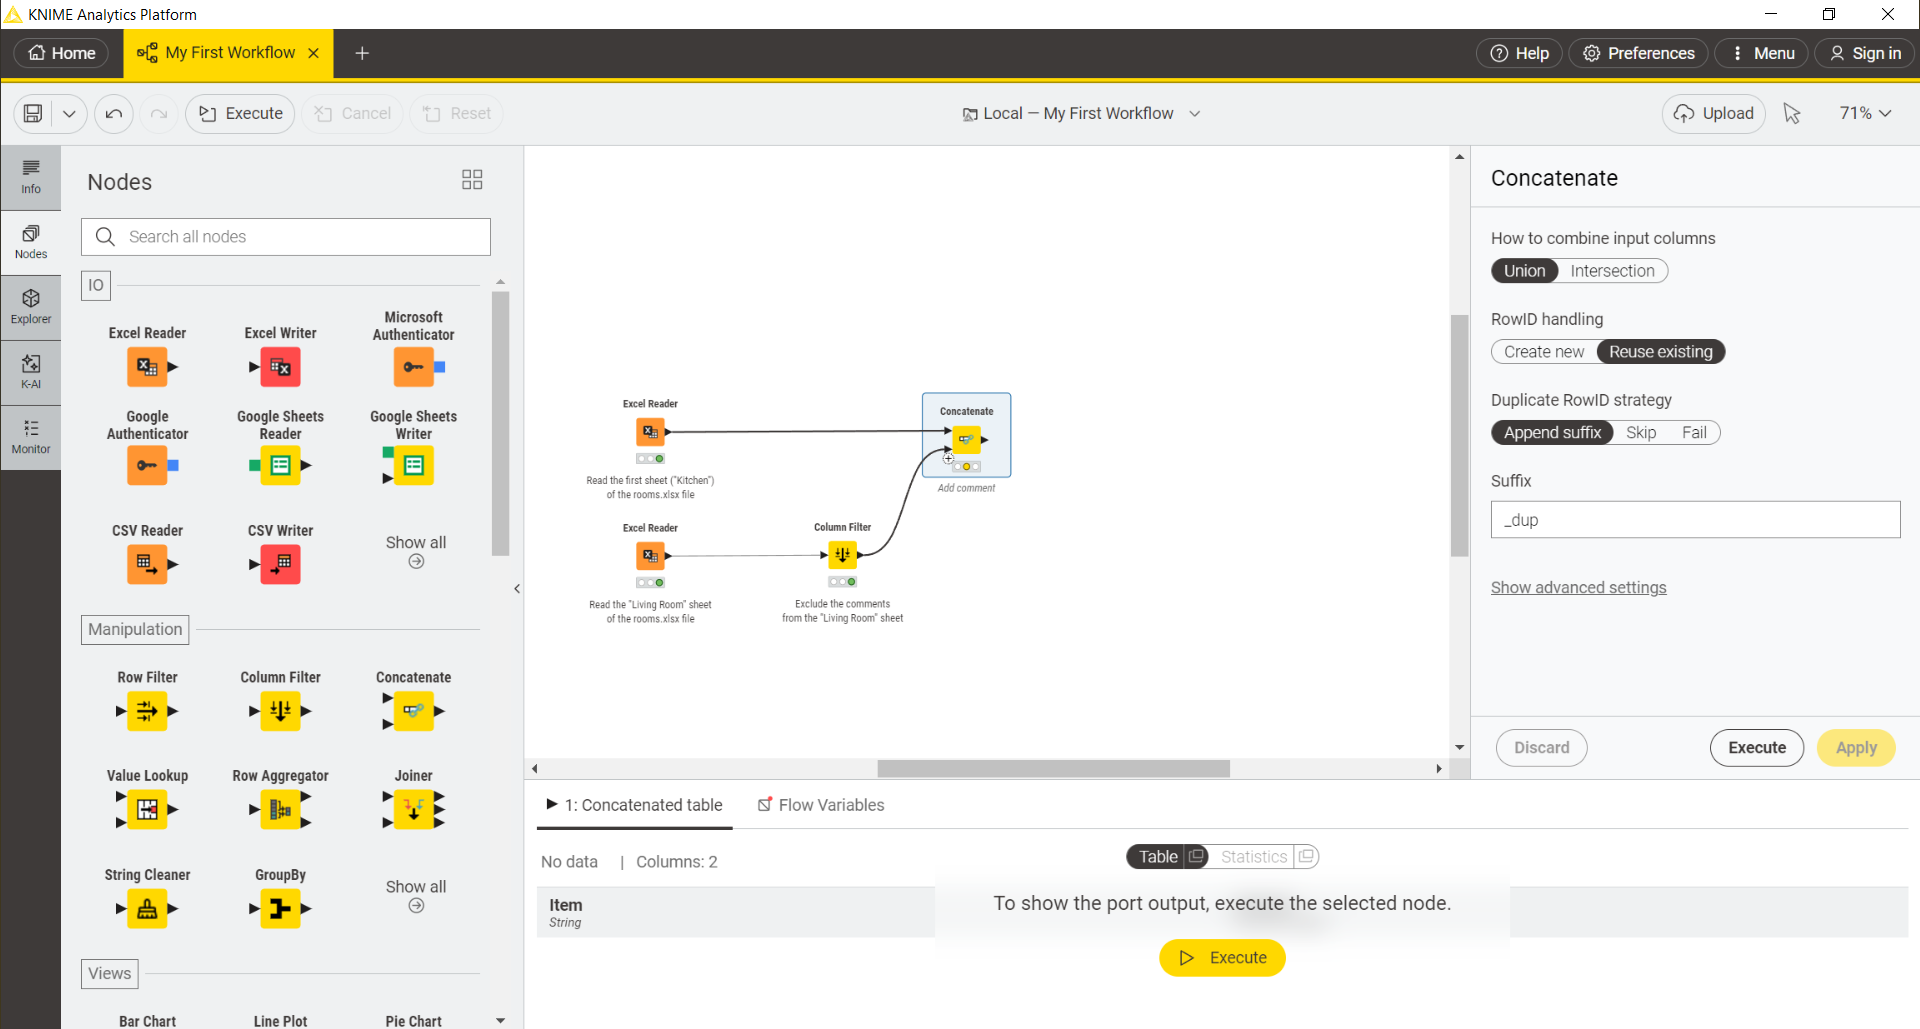
Open the Concatenate node configuration dialog to select how to combine the input columns and choose what to do in case there are duplicate row identifiers (RowIDs).
Select Union to use all columns from all input tables and Append suffix so that the output table will contain all rows from both input tables, but duplicate RowIDs are labeled with a suffix.
Step 5/6 – Visualize your data with Bar Chart node
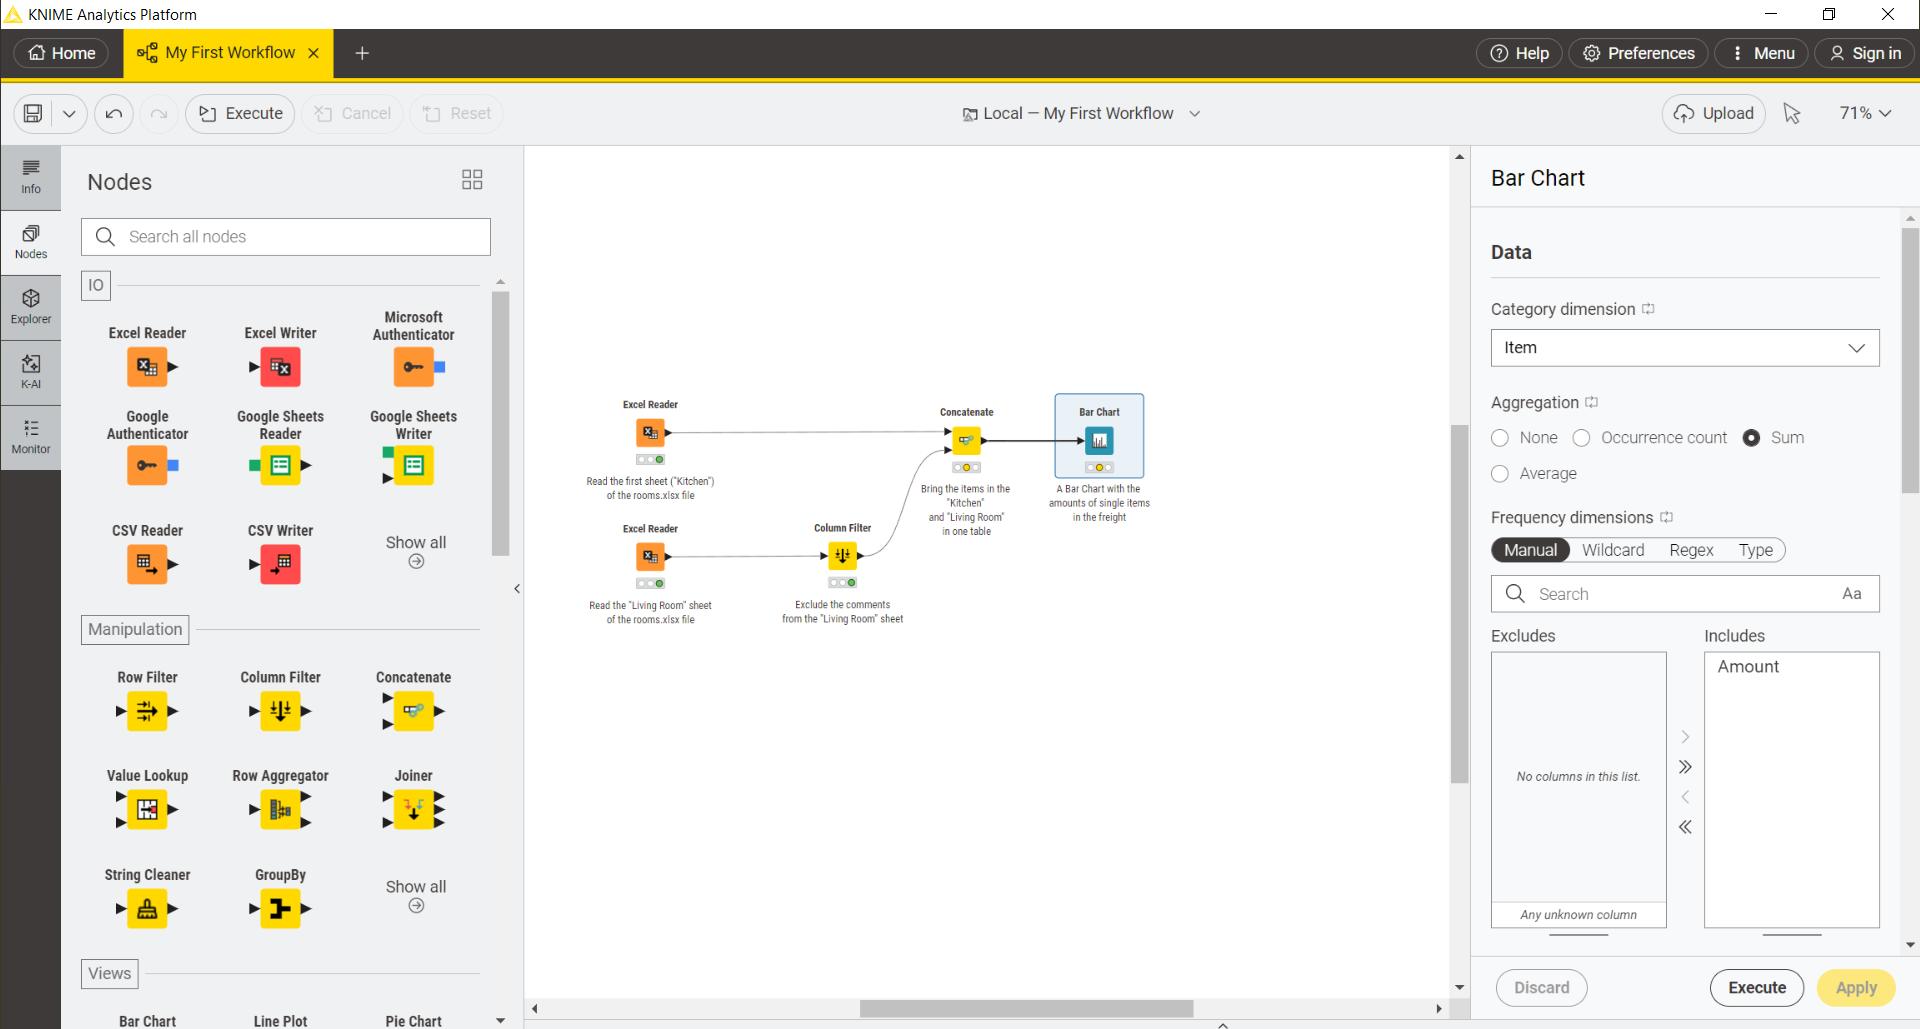
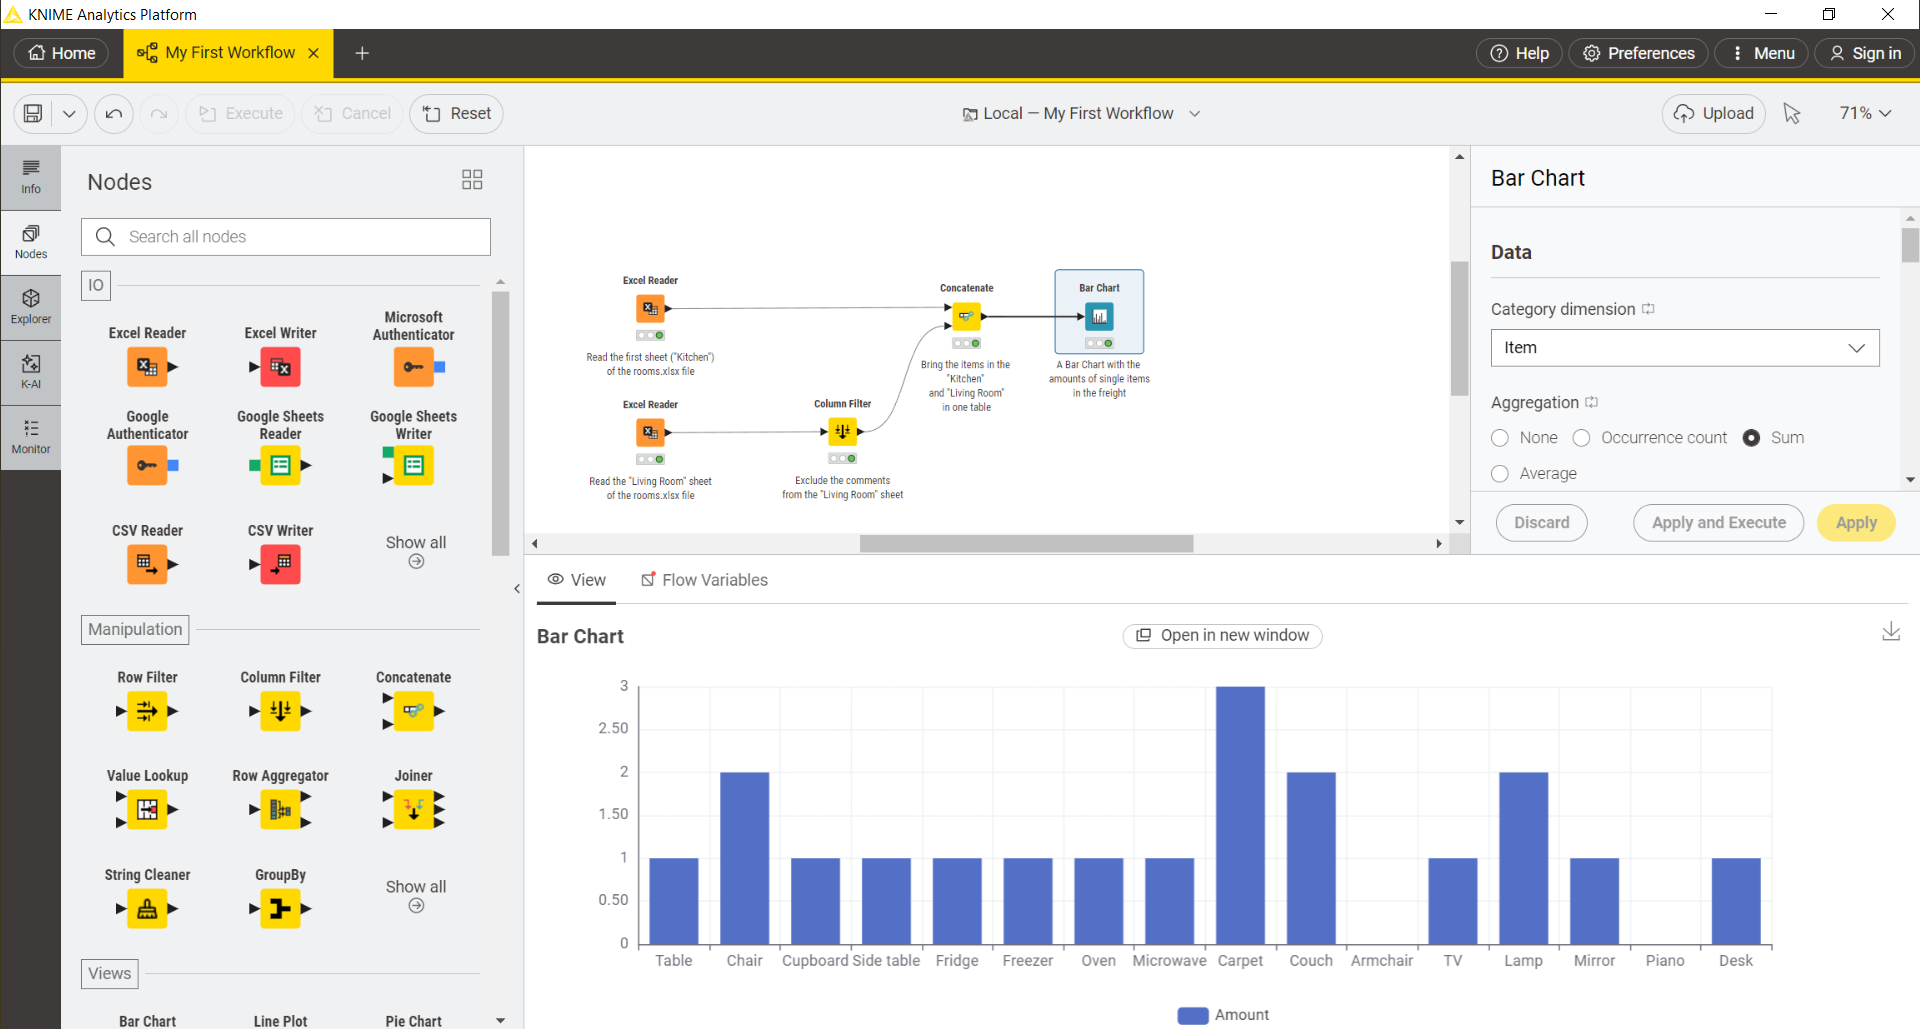
To visualize the data, you will need to use the view nodes. For example, to build a bar chart drag the arrow from the output port of the Concatenate node. The quick node insertion panel appears. Navigate to the search bar, type “Bar chart”, and select the Bar Chart node. Then, click the cog button in the node action bar to open the configuration dialog of the node. Here you can configure the node to visualize your data and also have a look at the resulting plot preview right away.
Select the column that contains the item names as the category dimension, select the sum as the aggregation method and finally include the column Amount as the quantitative dimension of the bars.
Click apply and execute to see the preview of the bar chart.
Step 6/6 – Advanced data manipulation with Value Lookup and Row Aggregator nodes
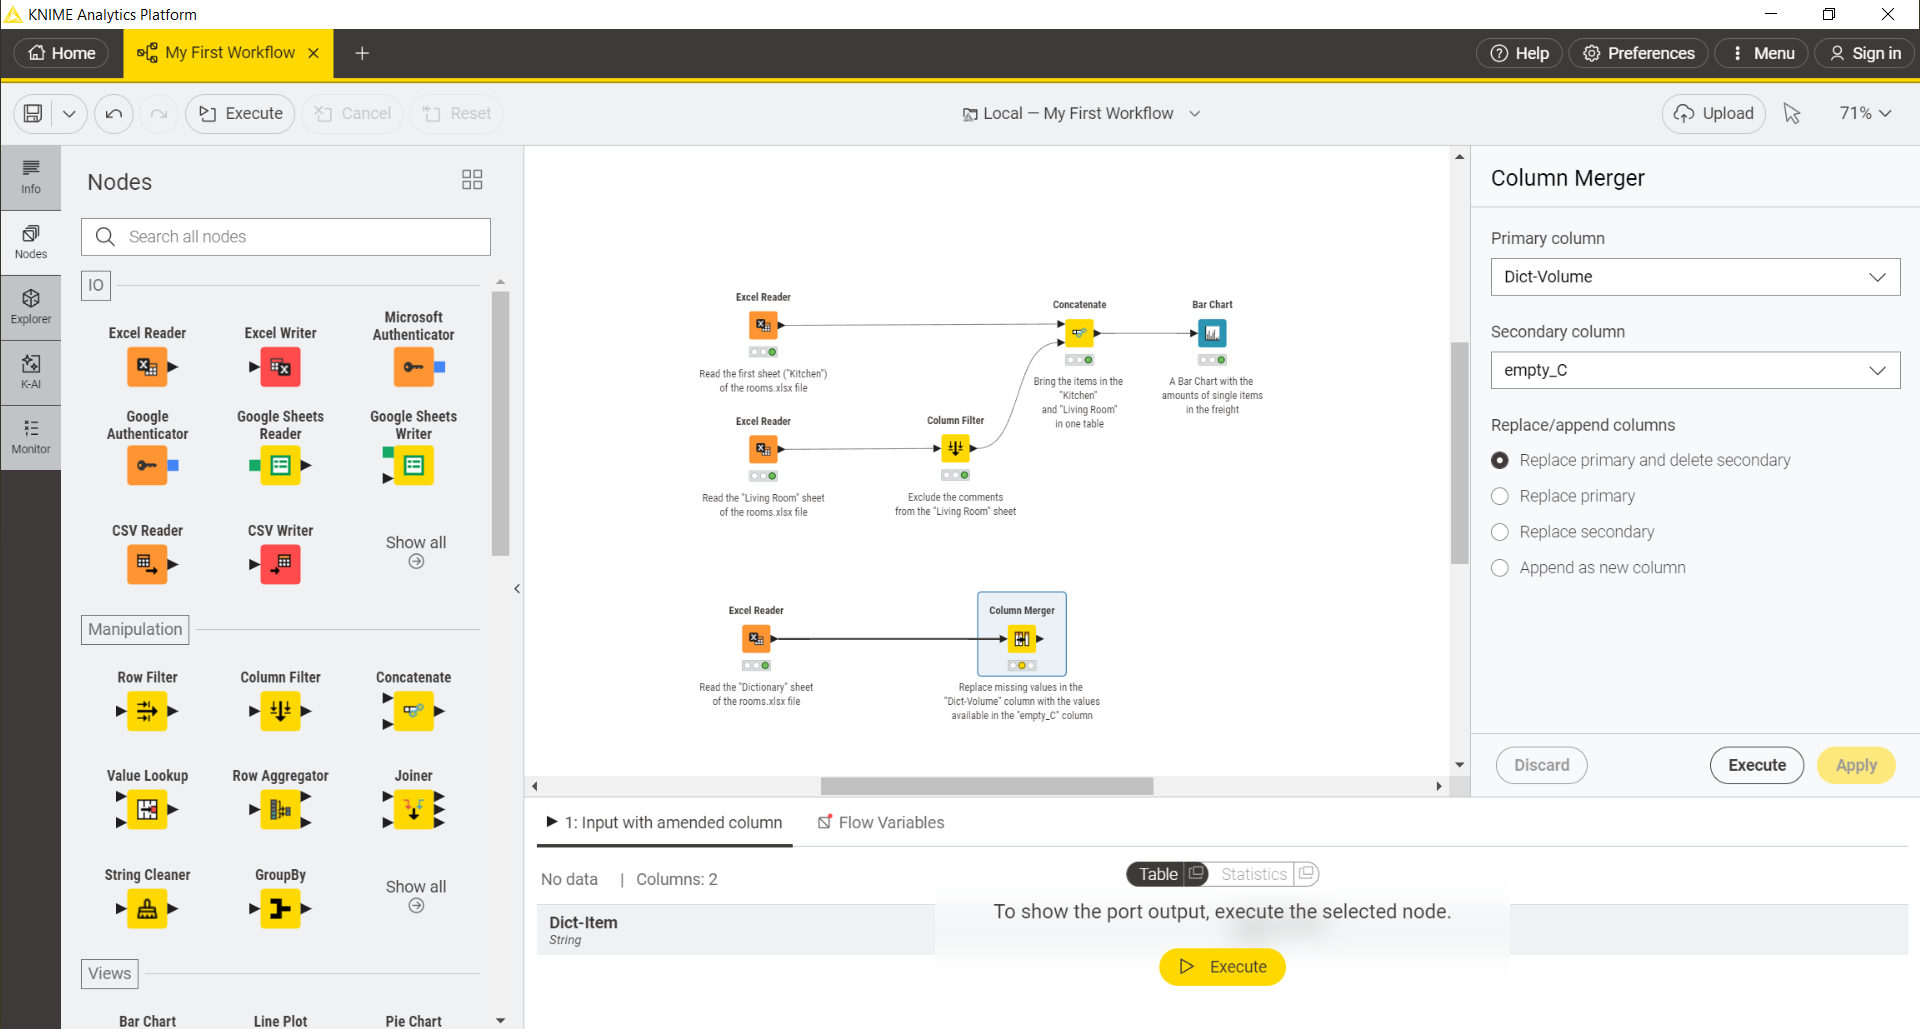
Now you want to perform a more advanced set of operations on your data by using a third sheet that is available in the xlsx file: the Dictionary sheet. To do so, you will first need a third Excel Reader node and you will configure it so that it reads the data from the sheet called Dictionary. The data table is made of three columns: the Dict-Item column that contains the key values of the dictionary, the column Dict-Volume that contains the corresponding dictionary values. The Dict-Volume column, however, contains missing values which are instead present in a third column, empty_C. You can use the Column Merger node to combine the two columns into one and filter out the second column. In the Column Merger configuration dialog, select the Primary column to be the Dict-Volume column and the Secondary column to be the empty_C column. Then select the first option in order to replace the values in the primary column and delete the secondary column.
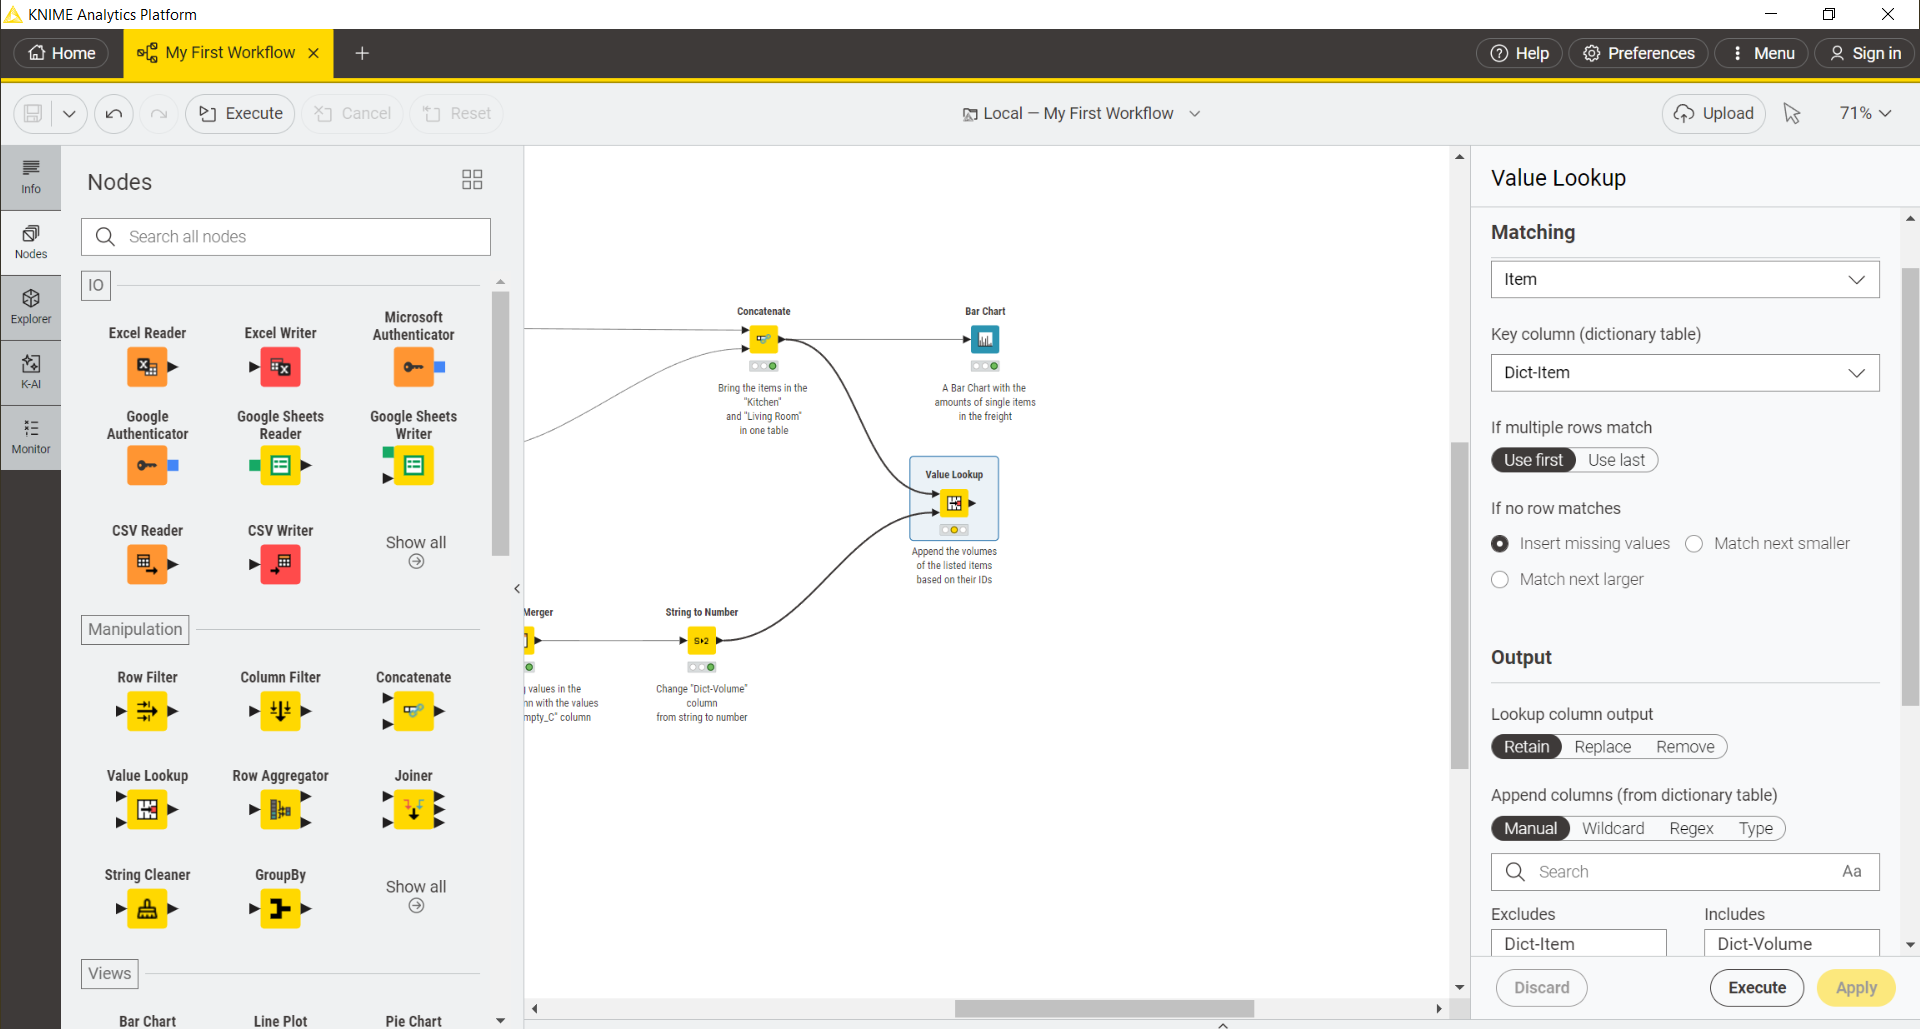
Now, first change the column type of the Dict-Volume column from string to number. You can do it by using a String to Number node. Then you want to create a table that contains the following columns: a column Item with a list of all the available items, a column Amount with the corresponding amount of those items and a column Dict-Volume containing the volumes of the listed items. The first two columns are available at the output port of the Concatenate node, resulting from the combination of the first two sheets of the xlsx file, while the third column is contained in the dictionary table. In order to combine these information in one table, matching the items names, you need to use a Value Lookup node.
The Value Lookup node has two inputs: a data table and a dictionary table. Connect the first input port to the output port of the Concatenate node which contains the data table and the second input port to the output port of the String to Number node which contains the dictionary table. Now open the configuration dialog of the Value Lookup node. From the data table, select the column Item that is used to look up values in the dictionary table.
From the dictionary table, instead, select the column Dict-Item that contains the search keys. In the Output section select the Dict-Volume column from the second table to be included in the output table. Click apply and execute the node.
Finally, you may want to calculate the total volume for each item and the grand total volume of all the items listed. To do this, you can use the Row Aggregator node, which aggregates columns using an aggregation function. The node has two output ports: the first one outputs the results of the aggregation function, while the second one, if the corresponding setting is enabled in the node configuration dialog, contains the grand total value.
Once you have added the Row Aggregator node into the workflow editor and connected it to the output port of the Value Lookup node, open the node configuration dialog.
Here, select Item as the Category column and Sum as the aggregation function. The column that we want to aggregate on for each item in the Category column is the Dict-Volume column, which is then added to the list of included columns.
Finally, since you want to calculate the grand total of the volume of all the items available in stock, you can select the column Amount to be the Weight column and activate the option to show additional “grand totals” at the second output port.
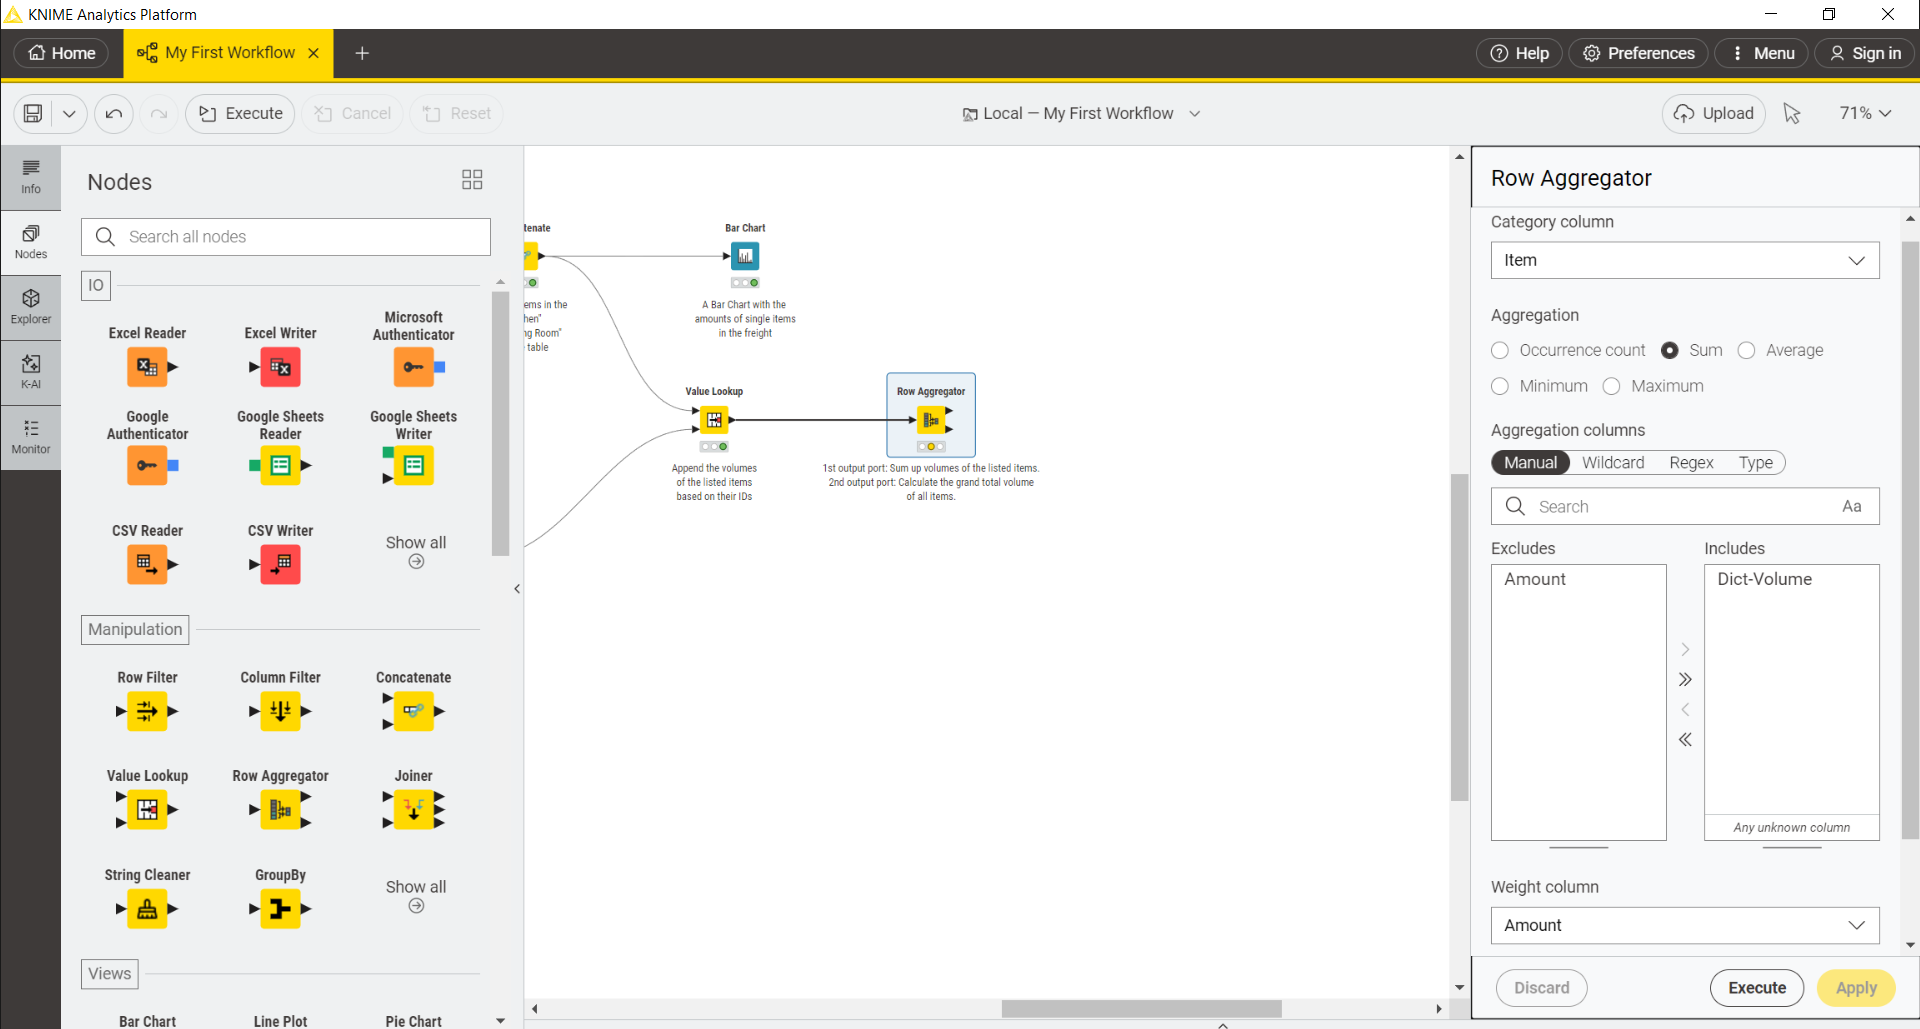
Click apply and execute the node.
Now, you can view the output table in the node monitor, at the bottom of the workbench, when you select the executed Row Aggregator node.
You can switch between viewing the output of the first output port data table, with the results of the aggregation, and the output of the second output port data table with the results of the grand total calculation.
Nodes and Workflows

In KNIME Analytics Platform, individual tasks are represented by nodes. Each node is displayed as a colored box with input and output ports. Nodes can perform all sorts of tasks, including reading/writing files, transforming data, training models, creating visualizations, and so on.
What are input and output ports?
The input(s) is the data that the node processes via the node ports, and the output(s) are the resulting data. Each node has specific settings, which you can adjust in a configuration dialog. Different types are represented by different node ports. Only ports of the same type indicated by the same color can be connected. Here are some examples of ports for frequently used data types.

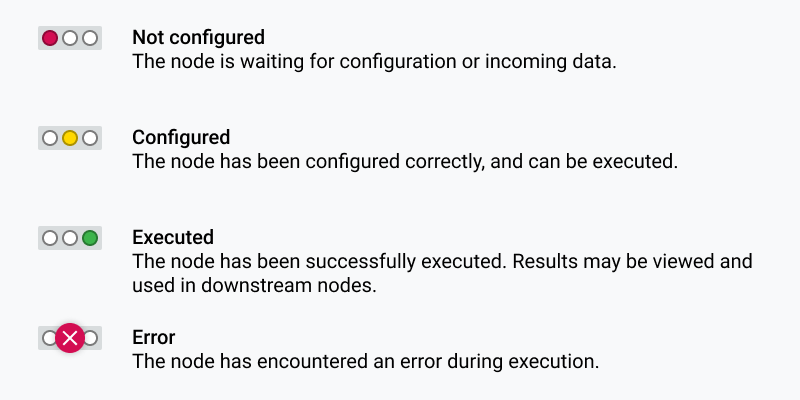
What is the node status?
A node can be in four different states. The node status is shown by a traffic light below each node.
What is the node action bar?
The node action bar provides quick access to the common operations that can be performed by a node. When hovering over a node, it appears on top of it. The node action bar contains at least four operations:
- Configure
Click the cog button most to the left in the node action bar. It opens the configuration dialog of the node.
- Execute
Click the play button in the node action bar. It executes the node.
- Cancel
Click the x button in the node action bar. It stops the execution of the node.
- Reset
Click the button showing an arrow that points to the left. It resets the node.
Other nodes contain buttons to perform operations specific to those node types. For example, the node action bar of a view node contains a magnifier. It executes the node and opens its view afterwards.
What is a workflow?
A series of interconnected nodes defines a workflow. Nodes can be connected via their input and output ports to form a workflow. Once a workflow is executed, the data inside the workflow flows then from left to right through the connections, either step-by-step or entirely.
What is a component?
Components are really KNIME nodes that you create with a KNIME workflow. They encapsulate and abstract functionality, can have their own dialog, and can have their own sophisticated, interactive views. Components can be reused in your own workflows but also shared with others: via KNIME Community Hub.
What is a metanode?
Metanodes allow you to organize your workflows better: you can take part of a larger workflow and collapse it into a gray box that hides that part of the workflow’s functionality. It also makes it easier for others to understand what your workflow does as you can structure it a bit more hierarchically.
More Examples
Jump start your analysis with the example workflows on the KNIME Community Hub. You can drag and drop the workflows to your local workspace, modify them according to your use case, or copy parts of them to your workflow.
The KNIME Beginners Space will guide you through common use cases and which KNIME workflows you can use to solve them. Find even more examples here.
Extensions and Integrations
Extensions provide additional functionalities such as access to and processing of complex data types, as well as the addition of advanced machine learning algorithms.
Integrations provide seamless access to some very cool open source projects such as Keras for deep learning, H2O for high performance machine learning, Apache Spark for big data processing, Python and R for scripting, and more.
Learn how to install extensions and integrations here.
KNIME Forum
Join the community and find solutions, support, and other inspirational thoughts from other KNIME users. The KNIME Forum is available for all types of questions, comments and conversations.
Visit KNIME Forum.