Topic Explorer View
This component generates a view to visualize the output of a topic model. You can use it to browse topics, their terms, semantic/exclusivity scores and documents. It can be deployed as a data app on KNIME Business Hub or KNIME Server. To see how to combine it with other nodes and verified components check the Topic Modeling space.
Category: Visualizations
Authors: Francesco Tuscolano, Application Engineer at KNIME and Paolo Tamagnini, Senior Data Scientist at KNIME

Topic Extractor and Assigner (STM)
These two twin components can be adopted to train and test a Structural Topic Model (STM) via the KNIME Interactive R Statistics Integration. The component adopts the KNIME Conda Integration to automatically install the environment on the first component execution. To see how to combine it with other nodes and verified components check the Topic Modeling space.
Category: Text Processing
Authors: Paolo Tamagnini, Senior Data Scientist at KNIME and Francisco Villaroel, Assistant Professor of Marketing at LUISS Guido Carli University
View Extractor Component View Assigner Component View Workflow

Topic Scorer (Labs)
This component is designed for scoring topics at the output of a topic model. The experimental component measures semantic coherence, exclusivity and neighbor distances of one or multiple models. The component is part of KNIME Labs as it is an experimental implementation. To see how to combine it with other nodes and verified components check the Topic Modeling space.
Category: Text Processing
Authors: Angus Veitch, Data Analytics Consultant at Forest Grove, Francesco Tuscolano, Application Engineer at KNIME and Paolo Tamagnini, Senior Data Scientist at KNIME

Verified Component Categories
Verified components are officially released by the KNIME team and are divided into the following categories. Explore all the verified Components in each category on the KNIME Hub.
Automation
Automation Components help when a workflow has to be executed in a production environment in an automated fashion - from complex AutoML to simple tricks to increase flexibility and traceability of your workflow.
Data Manipulation
When dealing with raw data, there are recurrent data manipulation techniques requiring complex workflows. We offer those workflows via Components to quickly clean, rename, filter, and transform raw data columns.
Finance Analytics
Finance teams across all industries require specific techniques to keep track of the company’s numbers while ensuring precision and compliance. Those time-consuming tasks usually rely on data from different spreadsheets, which can be hard to maintain and update. These Components help build reusable workflows for an efficient financial analysis.
Guided Analytics
Components can generate views when using Widget and JavaScript nodes. Those views can be used on their own or in sequence to interactively guide the user through the analysys. Use the Guided Analytics Components to create guided analytics workflows for local usage or remote access via KNIME WebPortal.
Life Sciences
Gather and analyse Life Science data with shared Components. For example, extract data from the European Nucleotide Archive, ChEMBL or PDB or perform a Pathway Enrichment Analysis by simply dragging and dropping the Component of your choice.
Model Interpretability
Training performant predictive models often leads to black boxes: data goes in the box, it's processed by nearly incomprehensible algorithms, predictions come out of the box. KNIME offers an extension to be combined with these Components for Machine Learning Interpretability (MLI) and Explainable AI (XAI) use cases.
Text Processing
The text processing Components help you to analyse text documents - from extracting data from biomedical literature, to document preprocessing, through to computing document similarity.
Time Series
Easily clean, aggregate, visualize, and forecast time series data with this set of Components. Includes options for seasonality visualization and removal, ACF and PACF plots, as well as ARIMA forecasting.
Visualizations
Countless visualizations exist to display data in colorful charts. Most of those visualizations are already provided in KNIME via JavaScript and Plotly nodes. If you cannot find the plot you need as a standard node, make sure to check this category of Components with more complex visualizations or interactive composite views.

What are Components?
Components are really KNIME nodes that you create with a KNIME workflow, enabling you to easily bundle, reuse, and share functionality. Configuration and widget nodes allow you to create Components that behave just like normal nodes with a logo, a dialogue, and often interactive views. With KNIME Analytics Platform, anyone can create Components and share them, via the KNIME Hub, with the community.
Learn More
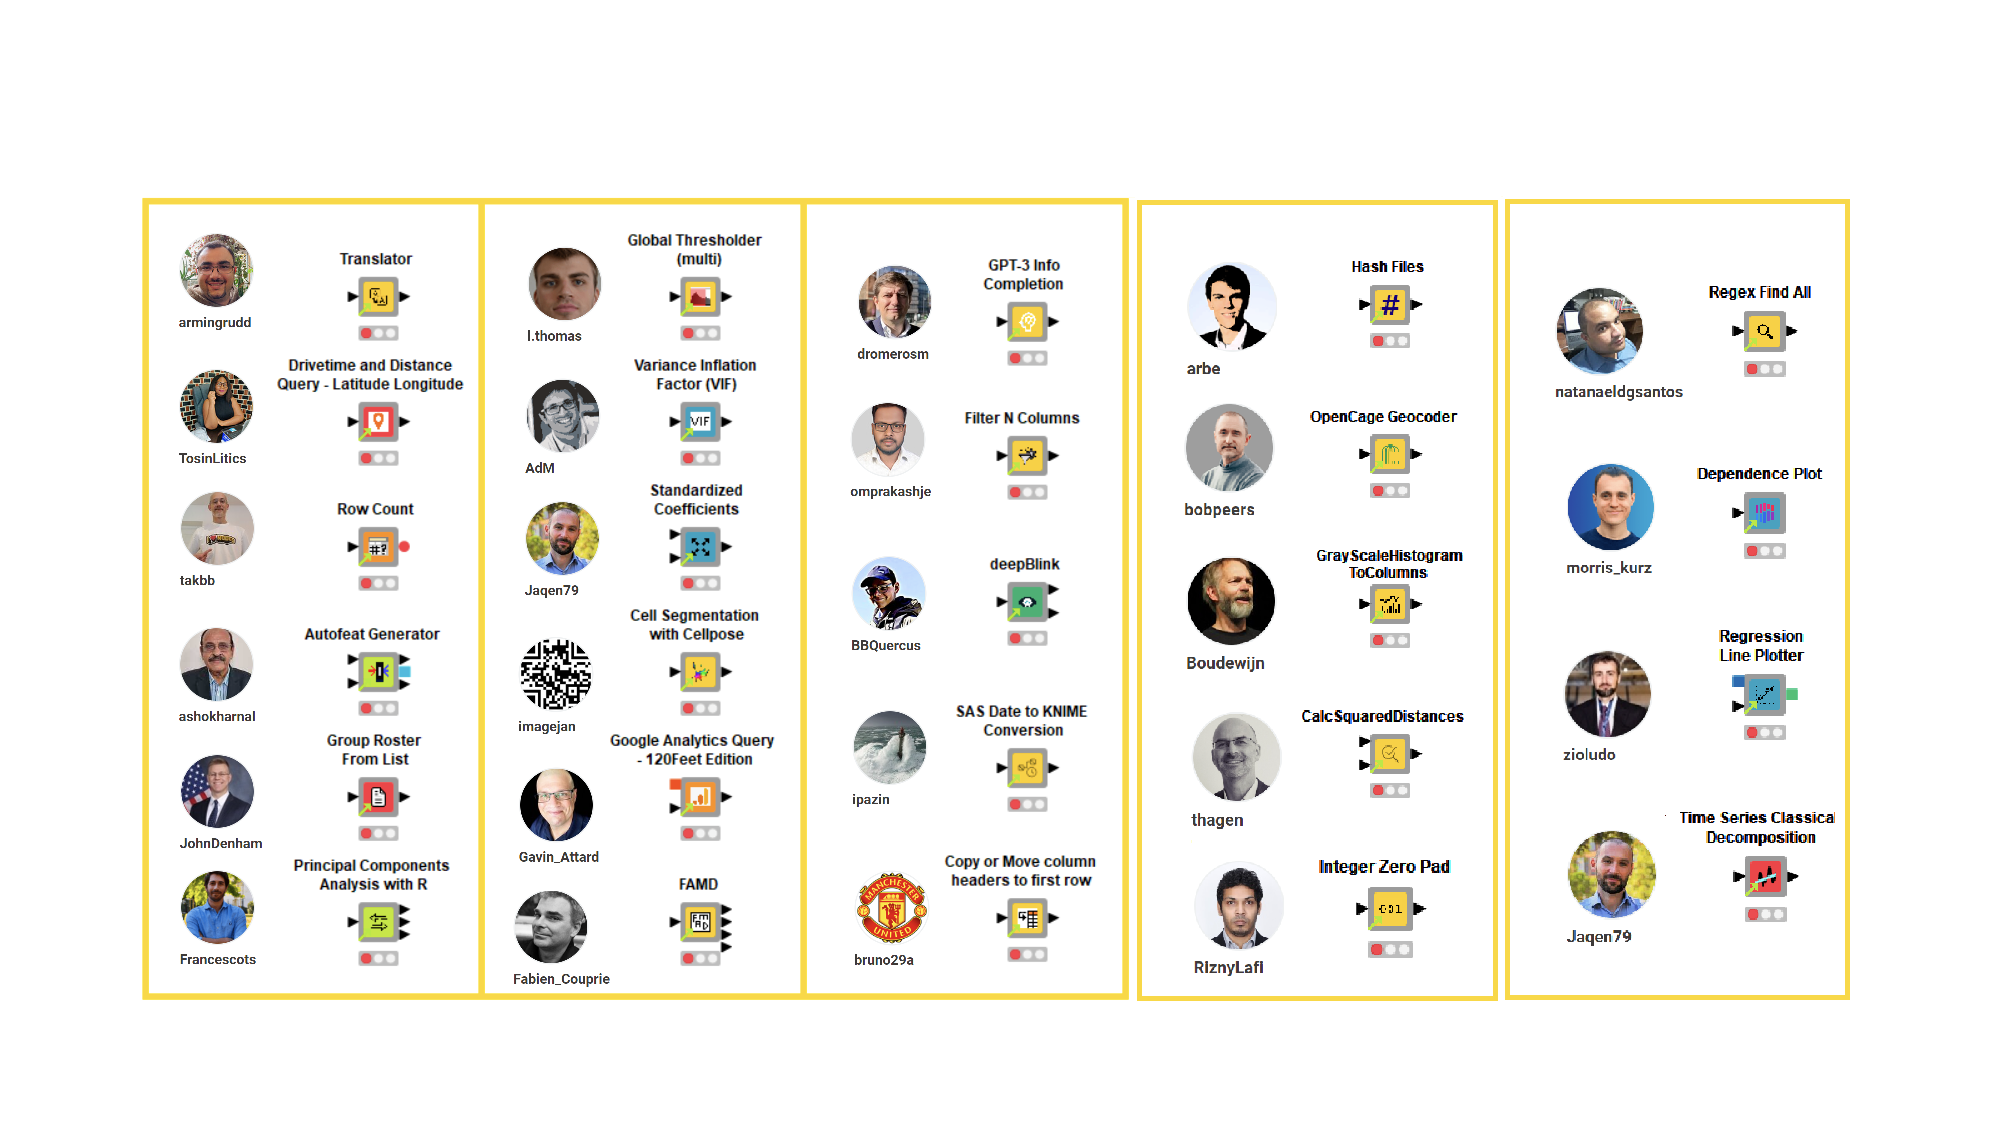
Community Components Collections
Seasonal reviews of community components are published on KNIME Blog. Components really are KNIME nodes that you create with a KNIME workflow. Note that these components are built by and for the community via the KNIME Hub. These components have not been officially verified by the KNIME team.
Browse all Components
Visit the KNIME Hub to browse all available components and add them to your workflow.
About KNIME Hub
Learn more about the KNIME Hub and how it can help with your data science solutions.