
Note that these components are built by and for the community. They have not been officially verified by the KNIME team.
Welcome to our seasonal review of community components!
KNIME users leverage its no-code/low-code framework to build their data solutions as KNIME workflows. This approach, which does not require pure coding, saves an organization loads of time. Given how easy and quick it is to build a new KNIME workflow from scratch, you might believe this only works for hard-coded solutions on a single dataset and/or set of parameters. You’d be wrong. KNIME offers yet another level of abstraction: the KNIME Components!
KNIME Components can make a workflow reliable and reusable with different data, parameters, execution environments, just like KNIME nodes! This feature has been initially adopted by KNIME and its partners to release new functionalities — for example, through the Verified Component project.
Soon after, the open-source community of KNIME experts followed the same approach, sharing their components on the KNIME Hub, and liking and commenting on each other's work on the KNIME Forum. On each component page, you can find the example workflows where these components have been adopted on a particular dataset and with specific parameters.
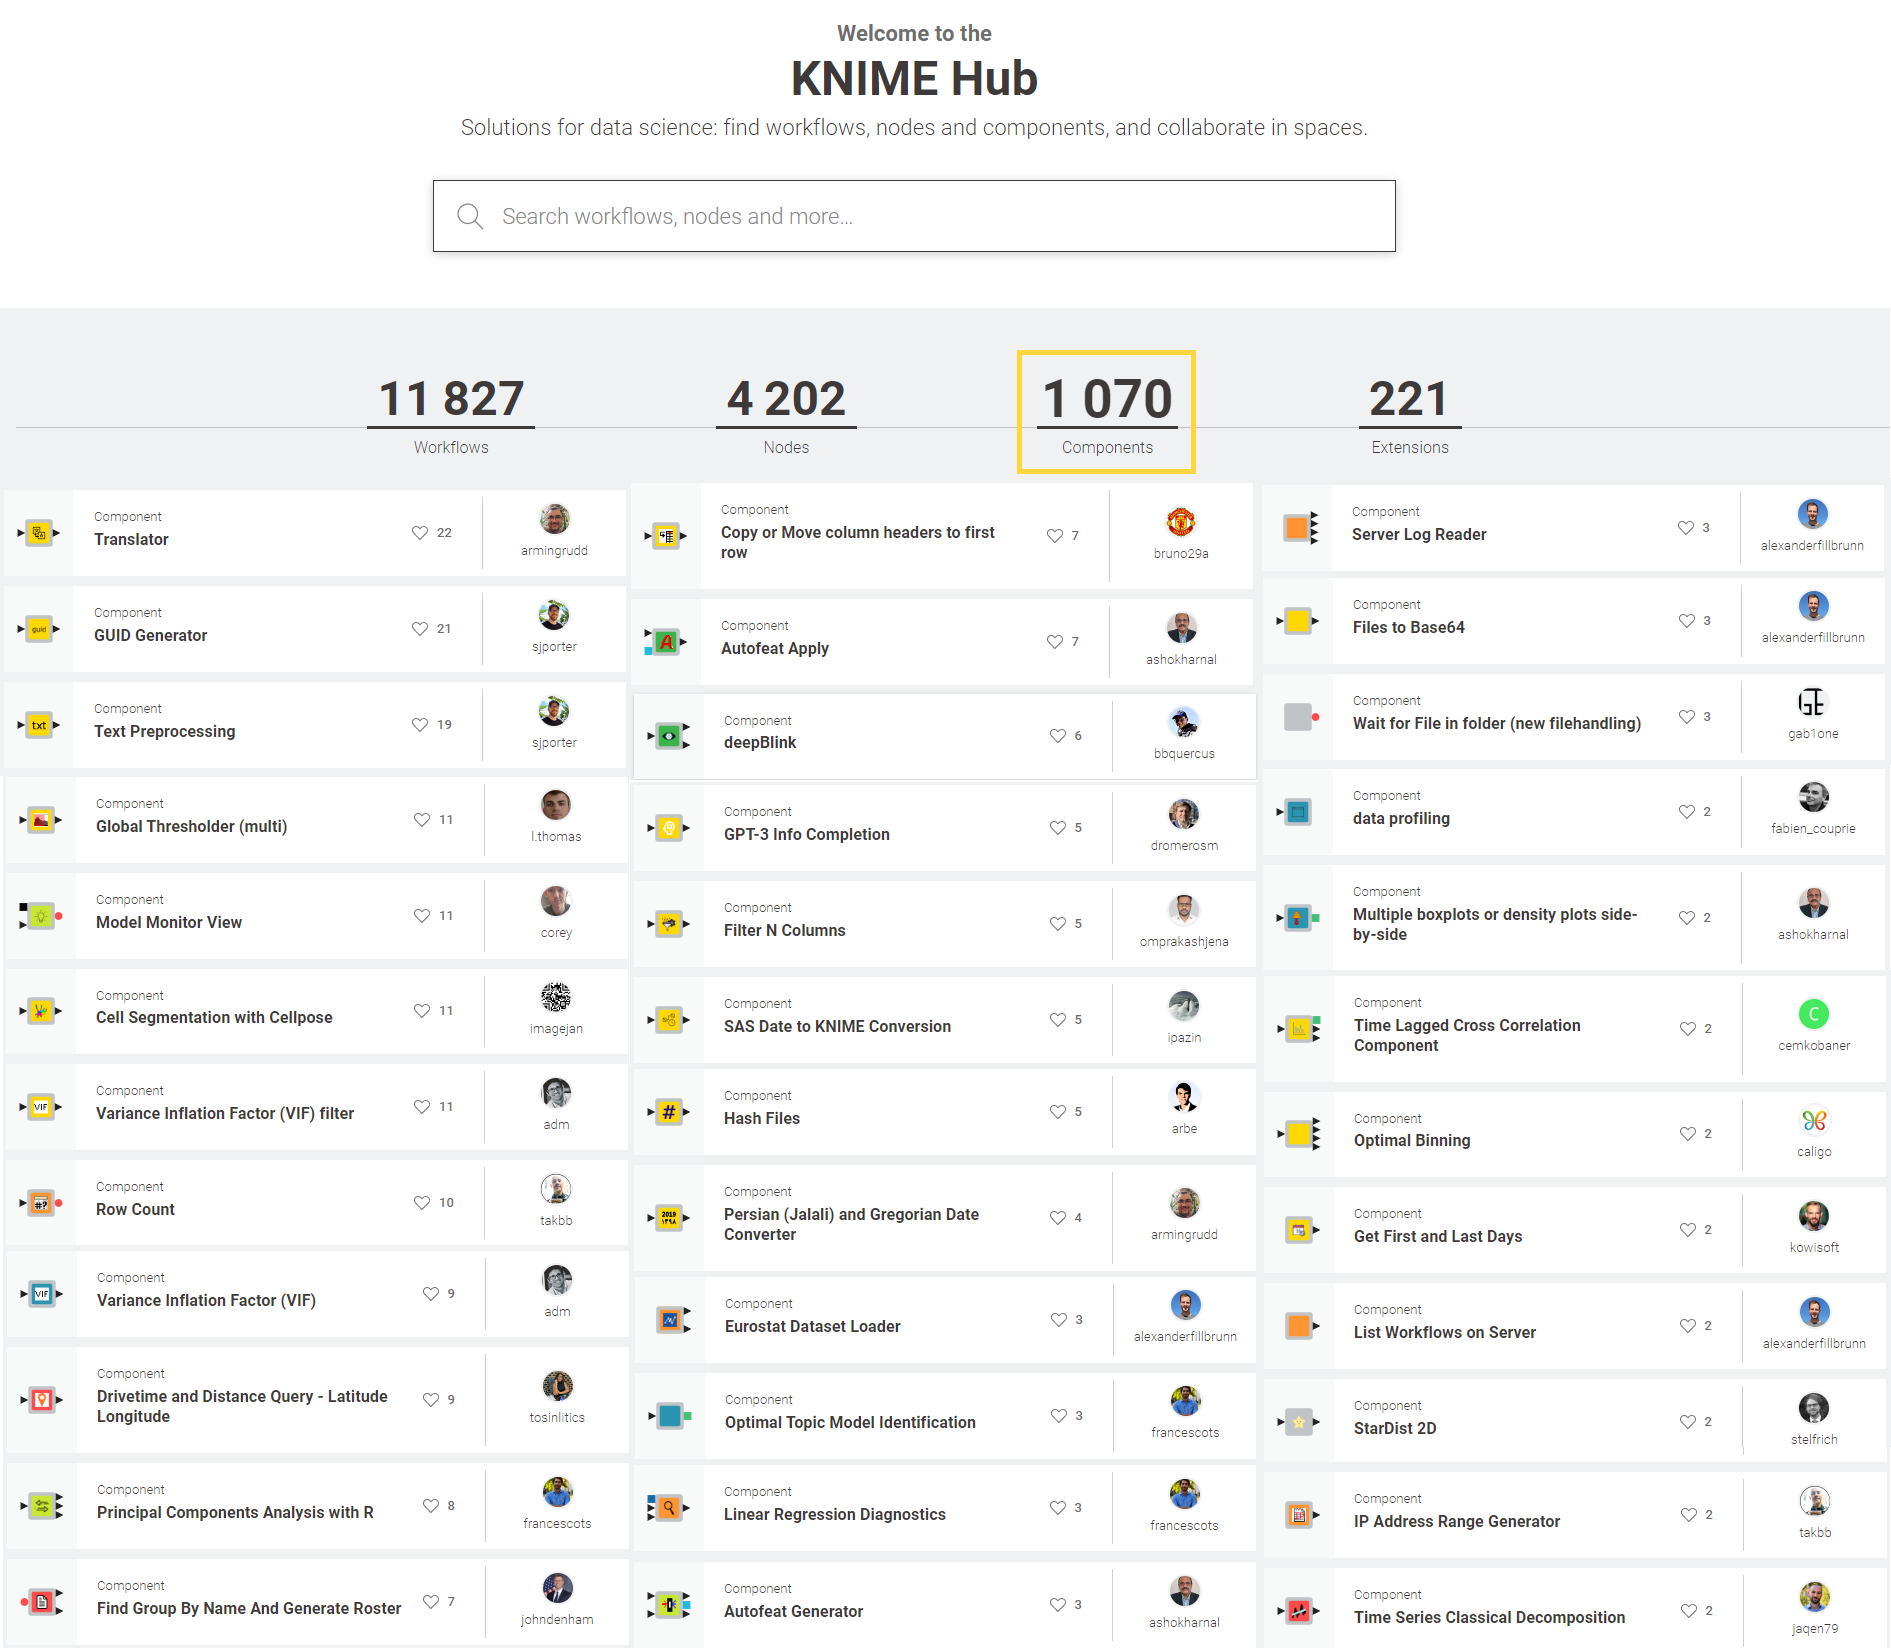
Each past season, we selected and reviewed a set of components built by community members from different industries and data domains.
For this season, we selected four components on four different topics: regression models, eXplainable AI (XAI), regex operations, and time series analysis! Enjoy, and don’t forget to drop a like!
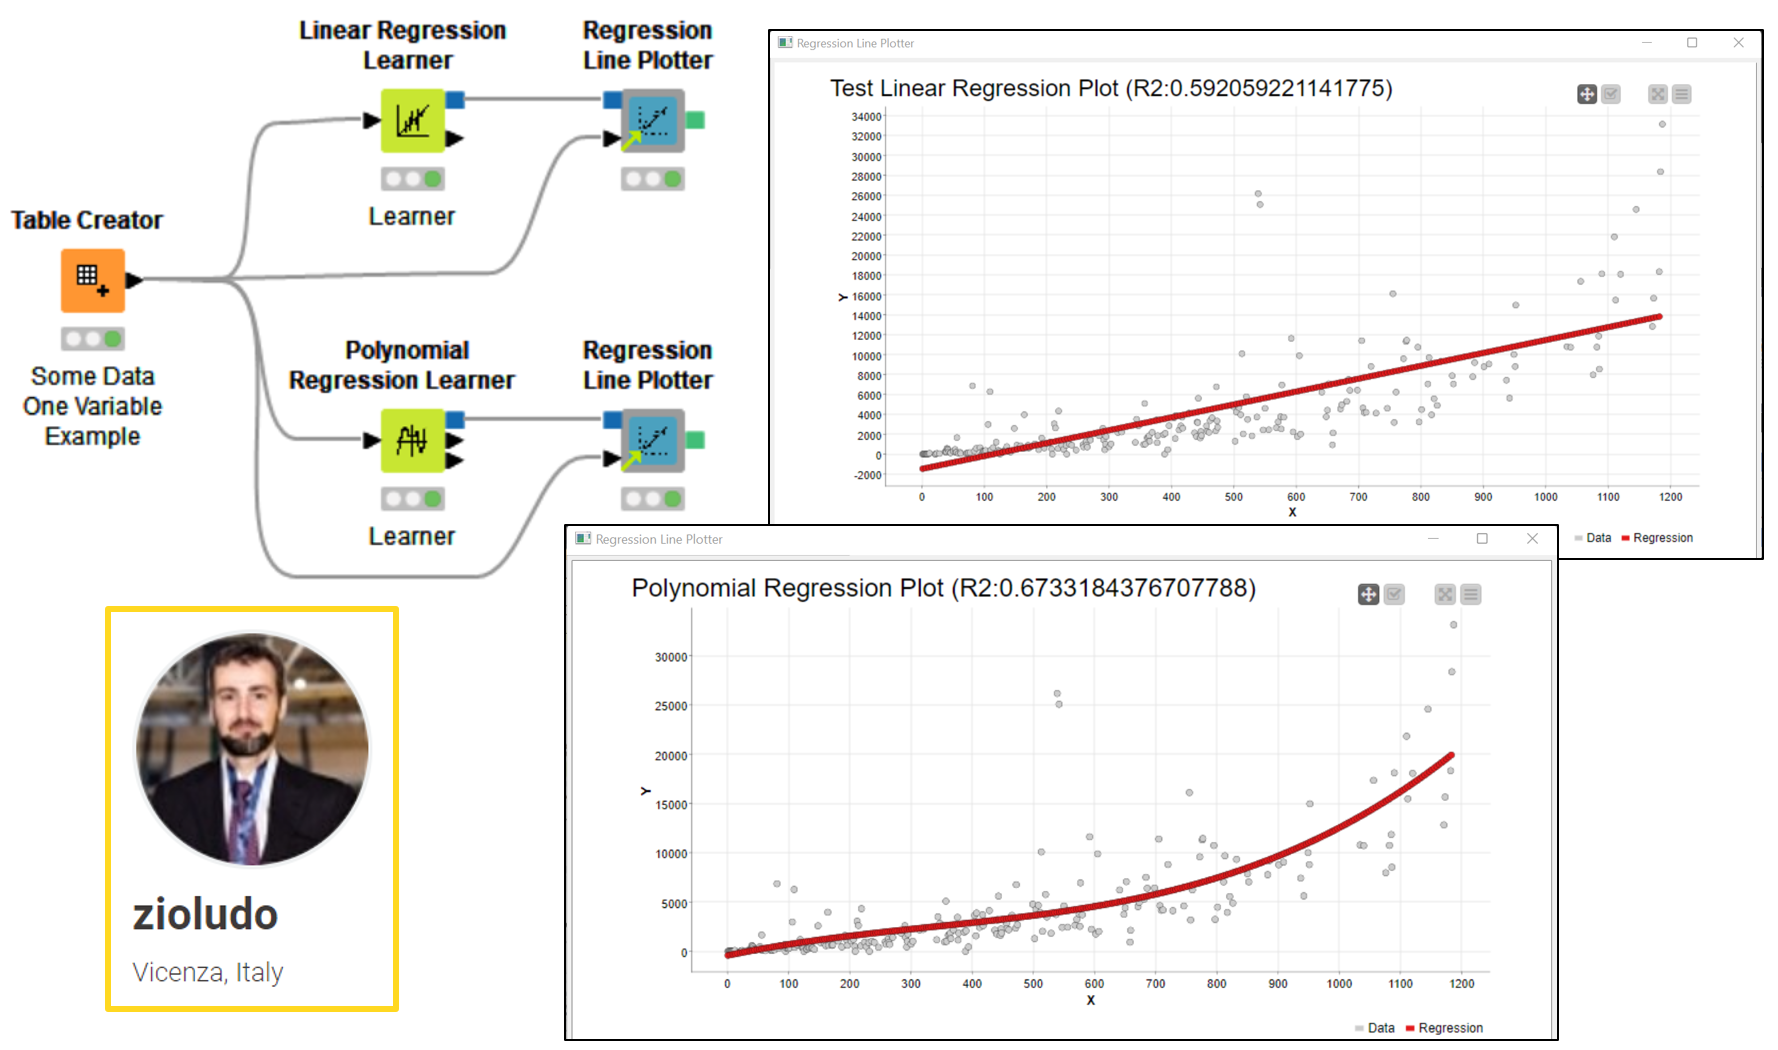
Regression Line Plotter by Ludovico Ruggeri Laderchi
Ludovico (@zioludo) built the Regression Line Plotter component to visualize the curve/line of the predictions in a 2-dimensional space. The component takes as input the PMML output of two precise learner nodes. It is compatible with the Linear and Polynomial Regression Learner nodes, just like the Regression Predictor. The component also needs some data with ground truth available. The user can select which feature should be plotted on the x axis. The y axis shows the ground truth data with gray markers in a scatter plot. The predictions by the regression model are displayed in red. Use this component to visualize how well the model is fitting on the different features/columns. Find an example on Ludovico’s space with the two compatible learner nodes.
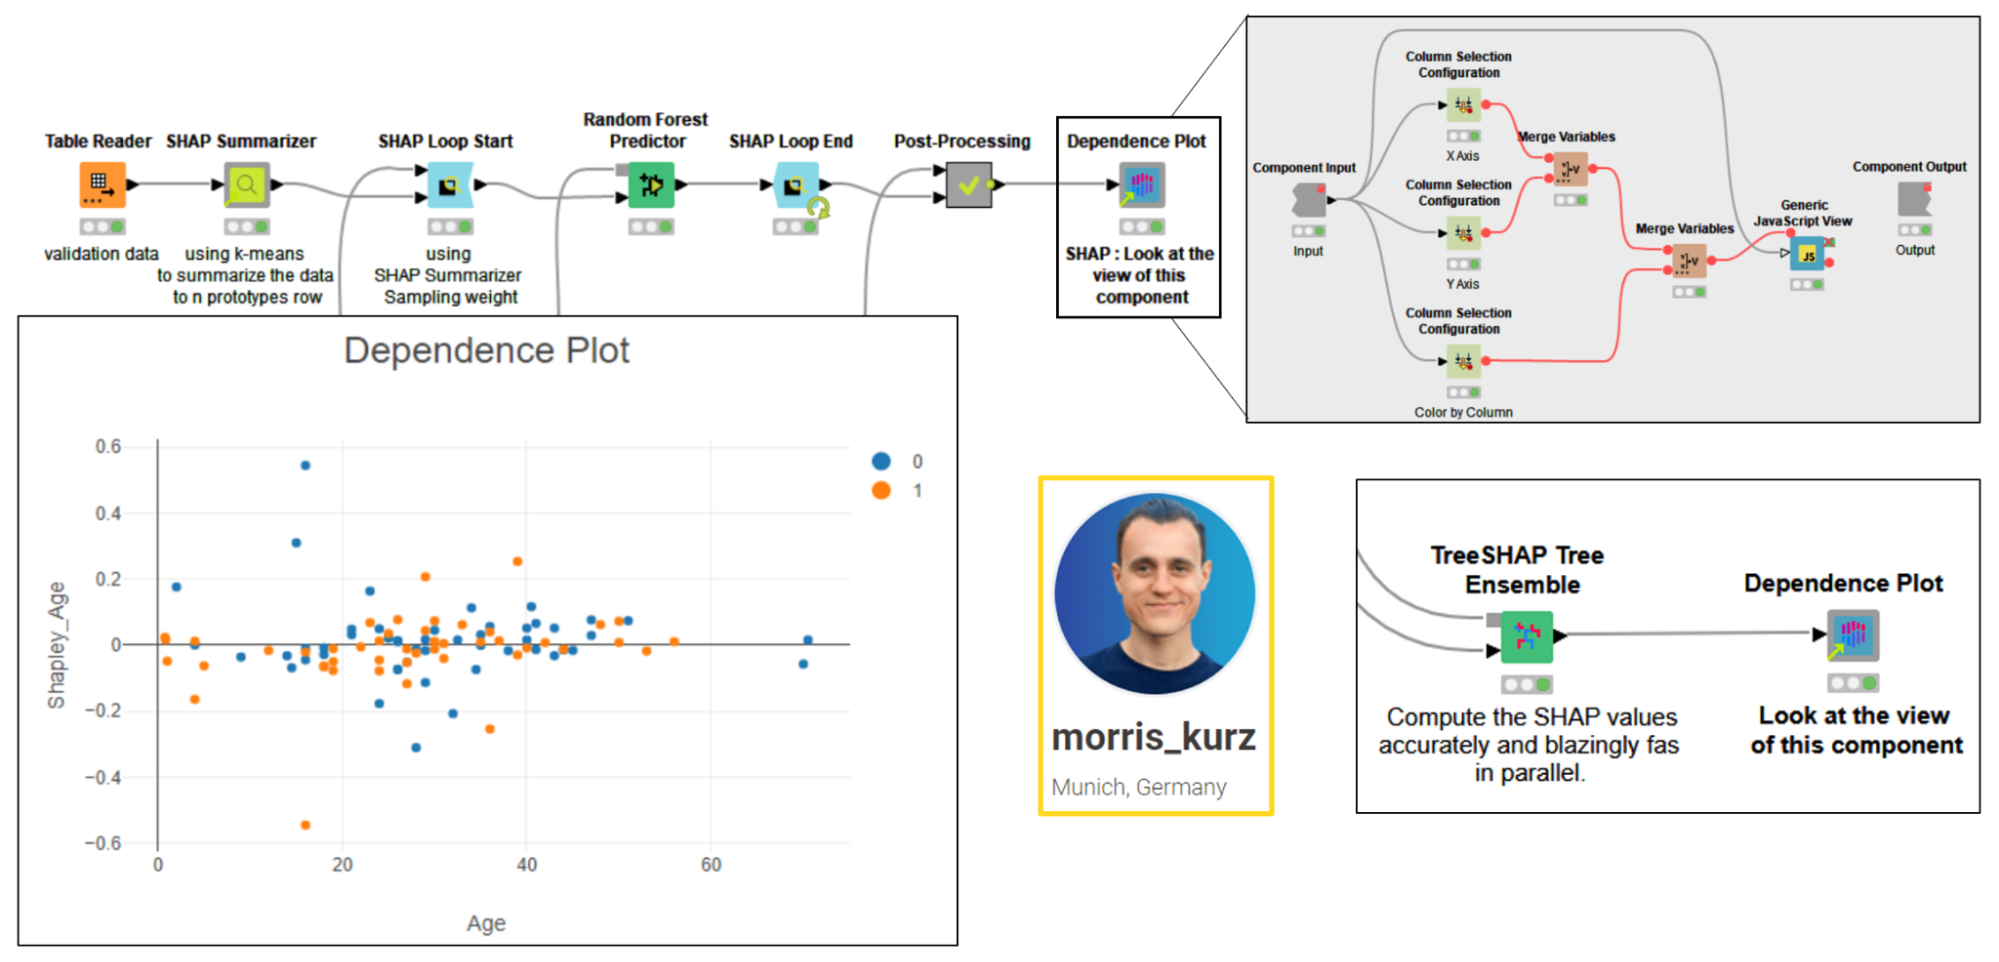
Dependence Plot by Morris Kurz
Morris (@morris_kurz) built the Dependence Plot component to visualize the output of “SHAP-like” explanations — a set of eXplainable AI (XAI) techniques to explain the predictions of ML models. The component adopts Generic JavaScript View node, starring Plotly Scatter Plot with special settings. The user needs to provide explanations as input — either SHAP or Shapley Values — via the KNIME Machine Learning Interpretability Extension or TreeSHAP explanations via the extension that Morris himself developed, TreeSHAP - Explainable Machine Learning in KNIME. TreeSHAP explanations only work for certain tree ensembles trained in KNIME (for example, the Random Forest Learner node), but they are much more efficient to compute than Shapley Values or SHAP.
Once you computed SHAP-like explanations and provided them as the input of the component, select which columns you would like to visualize. On the x axis, select one feature of the model. On the y axis, select the column for the explanation value for the same feature. For the color, select yet another feature. This type of scatter plot is called a “dependence plot,” and it shows trends in color and shape on how two features can together affect a model’s predictions. See Morris’ example on how to compute and visualize TreeSHAP in KNIME, or another example from the KNIME XAI space for the same with SHAP or Shapley Values explanations.
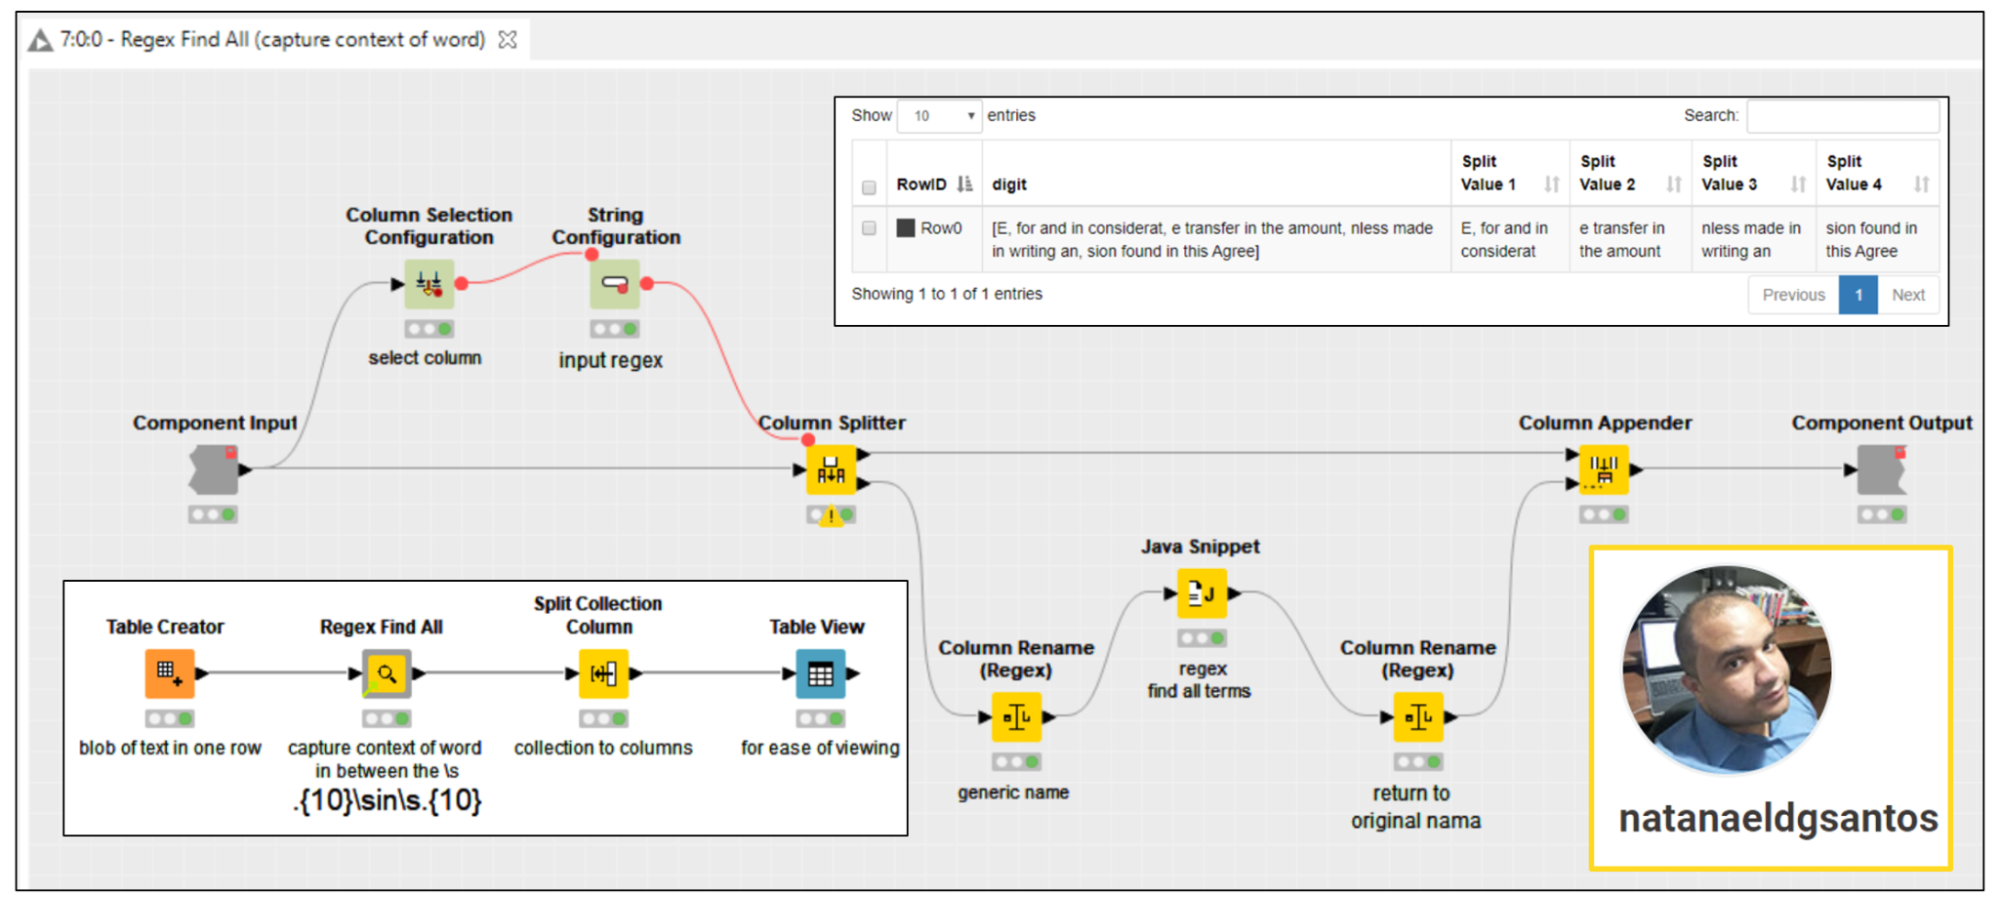
Regex Find All by Natanael Domingos
Natanael (@natanaeldgsantos) built the Regex Find All component to extract all substrings in a string that match the provided regular expression (regex). For each row, the component extracts via Java Snippet node a collection of strings from the selected string column. The output shows an additional column of collection type, which can be then unpacked via the Split Collection Column node, as shown in this example workflow. The same operation of this component could be performed (with a bit more effort) by a String Manipulation node, as shown in this more general example workflow.
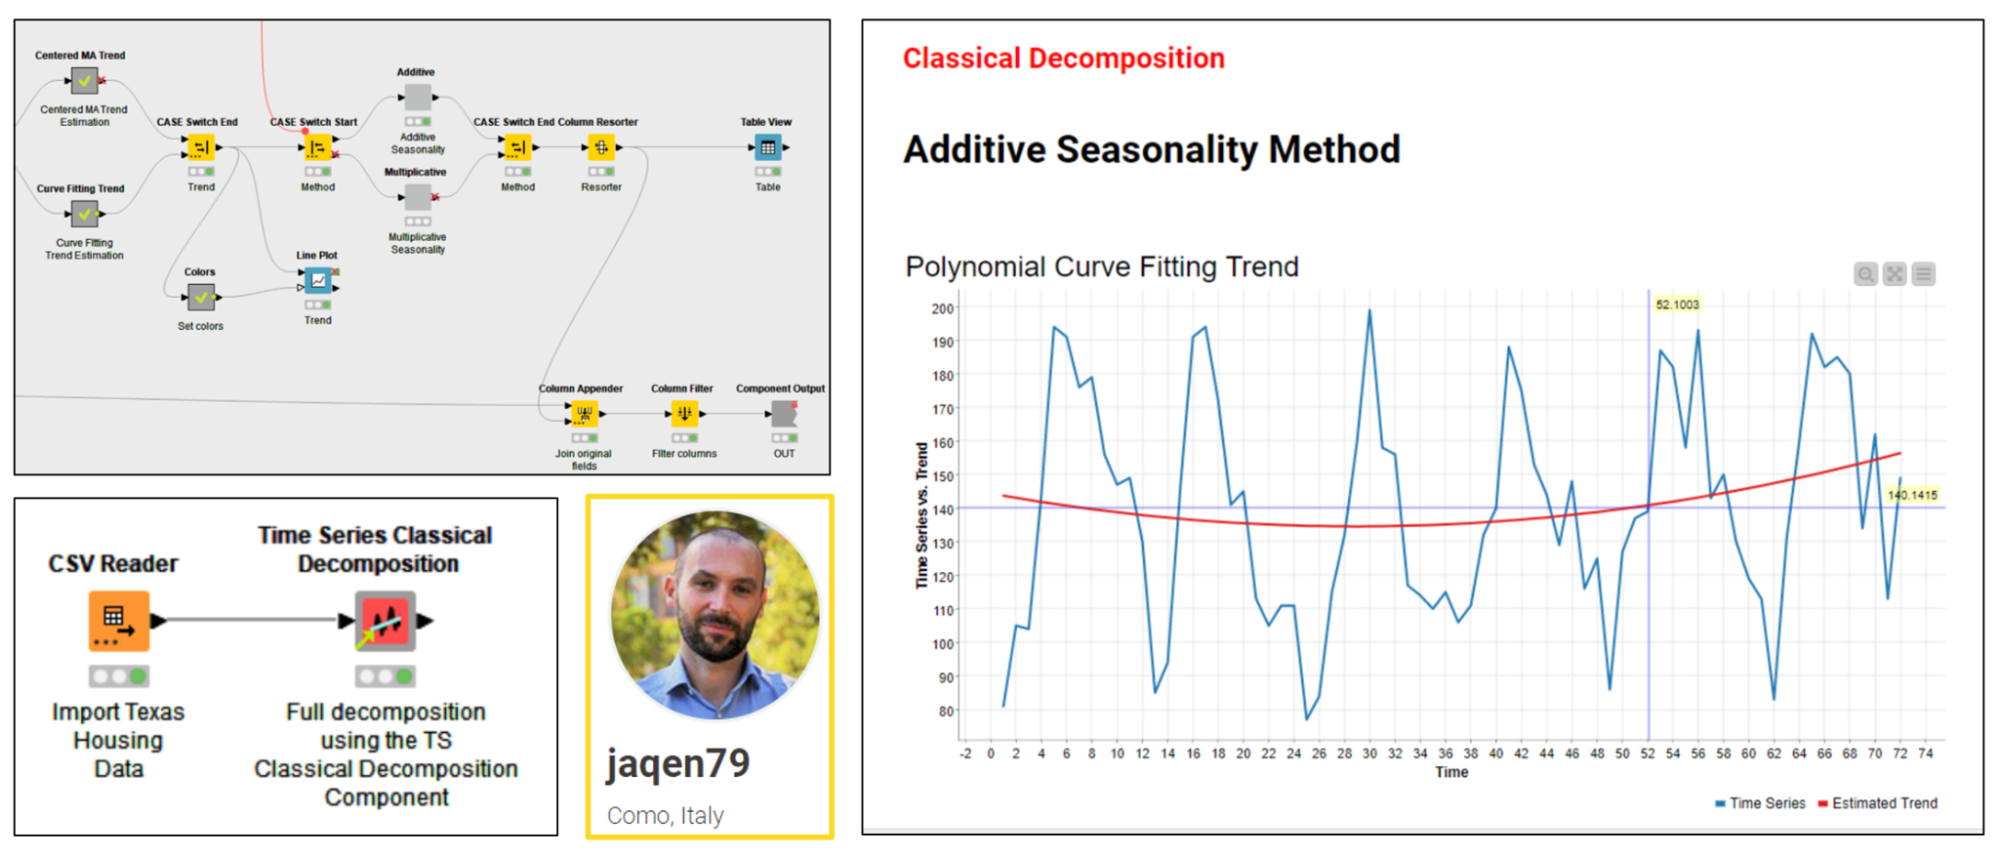
Time Series Classical Decomposition by Daniele Tonini
Daniele (@jaqen79) built the Time Series Classical Decomposition component, which can receive as input any time series and decompose it using the Classical Decomposition approach. The component outputs the input with six more columns attached, describing six elements: estimated trend, detrended series, seasonal factors, deseasonalized series, errors, and fitted series. The components also offer a view with a line chart for each of these elements. This component was adopted in the recent Packt book “Codeless Time Series Analysis with KNIME”, which Daniele wrote. Find three example workflows for this component in the KNIME Hub space dedicated to this book.
Note. Please notice that since the release of KNIME Analytics Platform 4.6 in June 2022, it is now possible to develop nodes directly in Python. If you want to make an open-source Python package available to KNIME users, consider reading “4 Steps for your Python Team to Develop KNIME Nodes.”
A Full Year of Community Component Collections!
Explore the community component collections we released this year and if you have feedback for us about the collections let us know at upskilling@knime.com!
-
The Winter 2022 Collection covered 12 components for different API services, Python and R packages, SEO, image processing, and regression analysis.
-
The Spring 2022 Collection covered five components dedicated to state-of-the-art AI, ETL, deep learning for image processing, and SAS migration.
-
The Summer 2022 Collection covered five components, based around hashing, clustering, more API services, more image processing, and more ETL.