
The World Economic Forum's 2026 report says competitive advantage will belong to those who prioritize foresight and ecosystem coordination. In reality, supply chain professionals are often buried in manual data cleaning — juggling ERPs and disconnected spreadsheets — with little time left for the decisions that actually matter.
This is where predictive analytics in supply chain comes in: the use of historical data, statistical modeling, and machine learning to forecast future outcomes. It enables teams to anticipate disruptions before they hit, rather than reacting after the fact.
In this guide you’ll find:
- The four supply chain roles that rely on predictive analytics most and what they do with it
- Four real customer implementations and what they achieved
- A side-by-side comparison of methods and when to use each
- A step-by-step tutorial for building a demand forecasting workflow in KNIME — no coding required
- A look at the tools landscape and how they compare
- The five most common mistakes teams make and how to avoid them
- What's next for supply chain analytics 2026 and beyond
Let’s start with the basics, then get practical.
What is predictive analytics in supply chain?
Predictive analytics uses historical data and statistical models to forecast what will happen next — so you can act before a problem arrives, not after. That puts it in a broader picture with two related types of analytics:
Analytics types in supply chain: a comparison
| Analytics type | Question it answers | Example |
| Descriptive | What happened? | Last quarter's stockout rate was 12% |
| Predictive | What will happen? | Stockout risk for SKU-X is 78% next month |
| Prescriptive | What should we do? | Reorder 5,000 units from Supplier B by March 15 |
Most supply chain teams are comfortable with descriptive analytics — reports, dashboards, KPIs. Fewer have made the jump to predictive, and fewer still have reached prescriptive. That gap is closing fast.
Why predictive supply chain analytics matters now
Supply chains have always been complex. What’s changed is the pace of supply chain disruption. Geopolitical events, raw material shortages, climate volatility, and demand swings that used to happen once a decade now happen every year. Predictive supply chain analytics is the only way to manage today’s extreme volatility and global risks.
Proactive description management: Predictive analytics scan global signs (weather, geopolitical, traffic) to alert managers about potential bottlenecks so they can reroute shipments or secure alternative suppliers in time.
Customer expectations and demand: Static forecasting methods are insufficient for modern markets where consumer preferences can change overnight. A-driven demand sensing includes real-time signals, such as yesterday’s sales and current social trends to improve short-term forecast accuracy. In 2026, applications such as hyperlocal demand forecasting are becoming key, where AI models can also forecast demand at zip code store level.
Inventory optimization and cost reduction: Predictive analytics help optimize stock levels, balancing demand forecasts with supplier lead times. This helps reduce inventory, lowers stockout rates, which is crucial for maintaining cash flow in a high-cost environment in 2026.
Shift from pilot to “agentic” AI: AI is no longer just for experiments and trials but embedded in platforms to act autonomously (within guardrails), such as automatically reordering stock or issuin RFPs, for example.
Meeting sustainability and regulatory demands: Predictive analytics are key to tracking things like product origins and verifying sustainability metrics automatically. This is important to comply with regulatory like the EU Digital Product Passport, which are mandatory in 2026.
Who uses predictive analytics? The four supply chain roles
The people who do this work aren’t data scientists in a centralized analytics team. It’s supply chain professionals — people with deep domain expertise — who need to turn that expertise into decisions, fast.
Demand planner
Focus: Forecast accuracy
Demand planners live and die by their forecast. Too high, and your organization carries excess stock. Too low, and you face stockouts and frustrated customers. Predictive analytics gives demand planners tools to detect seasonal patterns automatically, incorporate external signals (promotions, market trends), and build new product forecasts from limited data.
Key KPIs: Forecast bias, service level vs. demand, planning cycle time
Inventory analyst
Focus: Working capital
Every dollar tied up in inventory is a dollar not working elsewhere. Inventory analysts use predictive analytics to optimize safety stock levels, identify overstock before it becomes obsolescence, and model the working capital impact of different service-level targets.
Key KPIs: Inventory turns, days of supply, stockout rate, OTIF (on-time, in-full)
Sourcing analyst
Focus: Risk and cost
Sourcing analysts manage supplier relationships, contract compliance, and cost forecasting. Predictive analytics helps them score supplier risk before a disruption arrives, model price trends, and detect spend anomalies before they compound.
Key KPIs: Total cost of ownership, contract compliance rate, spend visibility
Logistics analyst
Focus: Lead time
For logistics analysts, predictive analytics means knowing — before a shipment goes out — which carriers are likely to miss their delivery window, which routes are at risk, and where consolidation opportunities exist.
Key KPIs: On-time delivery rate, transport cost per shipment, consolidation efficiency
What all four roles share:
- They pull data from different systems — ERP, TMS, WMS, Excel — and spend most of their time cleaning and connecting that data before they can do any analysis.
- These professionals aren’t data scientists. They’re business experts who are forced to be data cleaners to do their jobs effectively.
- That data integration challenge is where the tooling choice matters most. We’ll come back to that later in the article.
Key use cases — and what real customers achieved
What the following use cases have in common is that the starting point wasn’t an AI moonshot. It was fixing broken data flows and setting a foundation for predictive analytics. These four companies used KNIME for that, a platform for automated and explainable data and AI work.
Real-time forecasting — Procter & Gamble
- Challenge: Supply chain disruptions across 5,000 products and 22,000+ components. Identifying affected suppliers meant pulling data from 10+ systems manually, taking hundreds of hours.
- What they built: A KNIME automation platform that integrates bills of materials, vendor data, inventory, and logistics into a single real-time view with dashboards for every level of the organization.
- Result: Response time dropped from 2+ hours daily to instantaneous. Regional daily meetings became one global meeting.
Why it worked: Supply chain professionals build and modify workflows themselves — no data team required. "KNIME gives us access to advanced data science techniques" without pulling people away from their core work.
Inventory optimization — Karcher
- Challenge: Overstock was tying up working capital. Karcher needed to reduce inventory value without hurting service levels — a classic supply chain trade-off.
- What they built: A data-driven stock recommendation engine combining current stocks, open orders, delivered orders, planned promotions, and master data into a single analytical pipeline.
- Result: 15% reduction in inventory value at continued high service levels.
- Why it worked: KNIME unified multiple data sources without requiring IT development work. “We now make extremely precise stock-level recommendations by computing huge quantities of data.”
Supplier data enrichment — Volkswagen
- Challenge: 30,000 supplier records requiring manual entry and enrichment. The volume made accuracy impossible at human speed.
- What they built: Automated supplier data enrichment workflows, including distance calculation and data quality checks.
- Result: ~500 hours of manual work eliminated; 15% improvement in German supplier data quality.
- Why it worked: The workflow automated what sourcing analysts were doing by hand. “We are talking about 30,000 records that would have to be entered manually… this is the amount of manual work we saved.”
Logistics automation — Lindner
- Challenge: Disconnected ERP and logistics systems were causing data loss — information entered in one system wasn’t making it cleanly to the other.
- What they built: An automated logistics integration connecting the ERP and logistics systems with no manual handoff.
- Result: Enriched ERP data with zero information loss.
- Why it worked: Visual workflow design let the logistics team build the integration without depending on IT. “With KNIME, we were able to take our logistics processes to a completely new level.”
Data science & AI methods compared for supply chain analytics: which model, when?
The practical question supply chain managers need for their best data and AI work is: what model do I choose?
Comparison of data science & AI methods for supply chain analytics
| Method | Best for | Data needed | Complexity | When to use |
| Moving averages | Stable demand patterns | 12+ months historical | Low | Mature products, steady markets |
| ARIMA/SARIMA | Seasonal demand | 2+ years with seasonality | Low-Medium | Retail, CPG, anything with clear cycles |
| Linear regression | Understanding cost/demand drivers | Structured tabular data | Low | Price sensitivity, promotion impact |
| Random Forest/XGBoost | Complex, non-linear patterns | Moderate structured data | Medium | Multi-variable demand, risk scoring |
| LSTM/neural networks | Large-scale, real-time signals | Large datasets, IoT streams | High | Real-time logistics, sensor-heavy environments |
A practical decision framework to help decide which method to use
Start simple. If you have clean historical data with seasonal patterns, ARIMA or SARIMA gets you 80% of the way to a useful forecast. Add complexity only when simpler models plateau.
Tree-based models are the sweet spot for most teams. Random Forest and XGBoost offer good accuracy, handle messy data well, and produce results interpretable enough to share with business stakeholders. They’re not black boxes.
Neural networks make sense only at volume. If you have fewer than 100,000 records and don’t need real-time prediction, you’re adding complexity without proportional gain.
The model is rarely the bottleneck. Data quality and integration are. A well-tuned XGBoost model on clean, connected data outperforms any neural network on fragmented, inconsistent data. Fix the data pipeline first.
Where supply chain analytics is heading
Three approaches are gaining traction in 2026:
- LLM-augmented forecasting — using language models to incorporate unstructured signals (news, supplier communications) into demand models
- Digital twins — simulation environments for running “what if” scenarios without touching production systems
- Agentic AI — systems that autonomously adjust inventory based on forecast signals. Gartner identified
Tutorial: Build a demand forecast in KNIME
Learn how to build a working demand forecast.
What we’re building
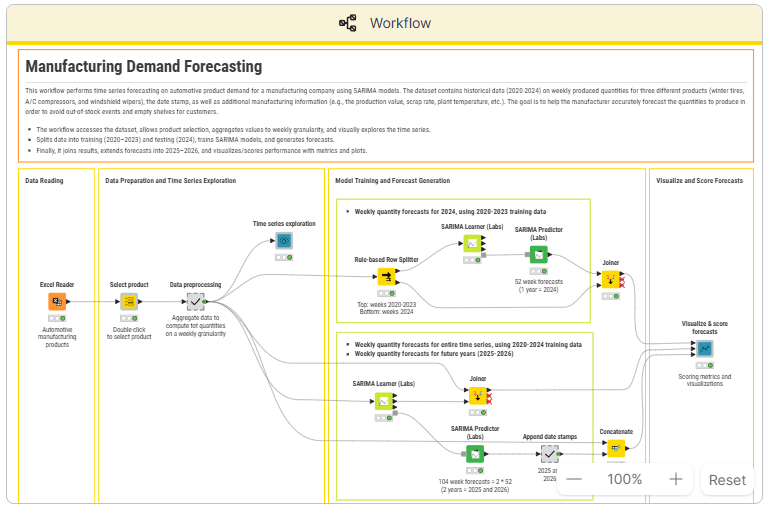
A SARIMA-based demand forecasting workflow that predicts the next three months of demand for a product category, using historical sales data. SARIMA (Seasonal Autoregressive Integrated Moving Average) is the right choice for most supply chain use cases because it handles seasonal patterns natively — exactly what you find in retail, CPG, and manufacturing demand data.
Step-by-step walkthrough of the demand forecasting workflow in KNIME
| Step | What happens | Key KNIME nodes & compoents |
| 1. Load data | Connect to CSV/Excel/database with historical sales | File Reader, Database Connector |
| 2. Explore and clean | Handle missing values, check for outliers, visualize trends | Missing Value, Statistics, Line Plot |
| 3. Feature engineering | Add time-based features: month, quarter, lag variables | Date and Time, Lag Column |
| 4. Train model | Fit SARIMA model on training set | SARIMA Learner |
| 5. Evaluate | Compare predictions to actuals on holdout set | Numeric Scorer, Line Plot |
| 6. Forecast | Generate predictions for next three months | SARIMA Predictor |
| 7. Visualize | Dashboard-ready output with actuals vs. forecast | Data Visualization Nodes and Components |
Step 1: Load your data. Connect to a CSV, Excel file, or database containing historical sales data. You need at minimum: a date column and a quantity column. Tip: make sure your date column is formatted consistently before loading. The File Reader auto-detects most formats, but a quick check saves debugging time later.
Step 2: Explore and clean. Before building any model, understand what you’re working with. Check for missing values and outliers — a promotion spike can skew your model. Tip: use a Line Plot to visualize demand over time. If you see a spike that looks suspicious, investigate before including it in training.
Step 3: Feature engineering. Add time-based features that help the model understand seasonality: month, quarter, week of year, and lagged variables (demand from the same period last year). Tip: lag variables are often the most powerful predictors. Demand from 12 months ago is usually a strong signal for this month’s forecast.
Step 4: Train the model. Split your data into a training set and a holdout set (the last three months works well), then fit the SARIMA model on the training data. Tip: make sure your date column is sorted ascending before feeding into the SARIMA Learner. The node expects chronological order.
Step 5: Evaluate. Compare predictions on the holdout set against actuals. Look at mean absolute percentage error (MAPE) and visual fit — both matter. Tip: a MAPE under 15% is a reasonable target for most supply chain categories. Above 20%, go back to Step 3 — feature engineering is usually where accuracy gains come from.
Step 6: Forecast. Generate predictions for the next three months using your trained model.
Step 7: Visualize and distribute. Build a dashboard-ready output — a bar chart showing actual vs. forecast with confidence intervals is the standard. The goal is something the demand planner can open each morning, not a raw data table.
Try the workflow yourself
The full workflow is available to download from KNIME’s templates library. You’ll also find an extended SARIMA example with a sample dataset — a good starting point if you don’t have clean historical data ready yet.
What to do next
- Swap the data source for your own ERP or sales data
- Schedule the workflow to run daily so your forecast refreshes automatically — no more “first task every morning is updating the spreadsheet”
Tools landscape: what’s available and how they compare
| Tool | Type | Best for | Pricing | Code required? |
| SAP IBP | Enterprise suite | Large orgs already on SAP | $$$$$ | Config-heavy |
| Oracle SCM Cloud | Enterprise suite | Oracle ecosystem | $$$$$ | Config-heavy |
| Azure ML | Cloud ML platform | Data science teams | $$-$$$$ | Yes (Python/R) |
| Alteryx | Desktop analytics | Analysts who want drag-and-drop | $$$$ | No |
| Dataiku | Enterprise AI | Teams scaling from experimentation | $$$-$$$$ | Optional |
| Python/R | Open-source | Data scientists | Free | Yes |
| KNIME | Open-source visual analytics | Business experts and data teams connecting data and building models without code | Free | No |
Where KNIME fits in
KNIME isn’t a replacement for SAP IBP or Oracle SCM Cloud — those platforms manage transactions, KNIME analyzes data. Think of KNIME as "analytical glue": it connects your ERPs, BI dashboards, and decision systems, turning fragmented data into a coherent analytical pipeline.
KNIME is for all business professionals, not just data scientists. It’s for the demand planner, inventory analyst, or sourcing analyst — business users who need to build a predictive model without waiting months for IT or a data science team.Honest trade-offs
If you’re already deep in the SAP ecosystem, IBP may be the path of least resistance — KNIME connects to it, but doesn’t replace it. If you have a data science team writing Python daily, KNIME integrates Python scripts so the two can work alongside each other. KNIME’s core strength is the fastest path from fragmented data to a working predictive model for supply chain teams who don’t have a dedicated data science team — or who can’t wait for one.
Common supply chain analytics pitfalls — and how to avoid them
Most supply chain analytics projects don’t fail because of a bad model. They fail for five reasons that have nothing to do with the model.
Starting with the model instead of the data
Teams spend months selecting and tuning a predictive model while the underlying data sits in four different systems with inconsistent formats and missing fields.
Fix: Spend 60% of your project time connecting and cleaning data sources. The model is the easy part.
Overfitting to historical patterns
COVID, tariff changes, and geopolitical events break historical patterns. A model trained on pre-disruption data will underperform in a disrupted environment.
Fix: Use shorter training windows, add external signals (commodity prices, logistics indices), and validate outputs with domain experts who know what the numbers mean.
Building in isolation
A demand planner’s forecast is only useful if the inventory analyst can act on it — and only if the sourcing analyst’s procurement schedule is aligned with it.
Analytics built in silos gets ignored.
Fix: Deploy workflows where the whole team can use them. As the Audi team found, shared deployment is what moves a forecast from “one person’s spreadsheet” to “a resource the whole team trusts.”
Skipping change management
New tools require new habits. If your team doesn’t trust the model, they’ll override it manually and you’ll lose the efficiency you built.
Fix: Start with one use case. Show the results. Let the team see the model working before asking them to rely on it for critical decisions.
Ignoring the last mile — scheduling and automation
If someone has to manually run the forecast workflow every morning, it becomes another task on the to-do list. Eventually, it gets skipped.
Fix: Schedule the workflow to refresh daily and distribute outputs automatically. The forecast should be waiting in your inbox — not something you have to generate.
What’s next: 2026 and beyond
Here are four themes shaping where supply chain analytics is heading.
Supply chain control towers
Centralized visibility across planning, sourcing, inventory, and logistics — powered by predictive analytics in real time. Rather than monitoring each function separately, control towers surface risk across the full supply chain as it emerges. Predictive analytics is the engine. The control tower is the interface.
Agentic AI for autonomous decisions
The next step beyond prediction: AI systems that act on forecasts automatically. An agentic system might detect a demand spike, check inventory levels, evaluate supplier capacity, and generate a purchase order — without human intervention. This is still emerging, but the direction is clear. Teams building solid predictive foundations now will be positioned to adopt it when it’s ready.
Real-time data integration
IoT sensors, live shipment tracking, and weather data are increasingly feeding directly into predictive models, shrinking the gap between “something changed” and “we responded.” The analytics workflows stay the same; the data inputs get faster and richer.Resilience over efficiency
The dominant optimization target has shifted. For years, the goal was cost efficiency. Now it’s adaptable. Predictive analytics supports this by powering scenario planning and “what if” simulation — letting teams model the impact of a disruption before it happens.
FAQs
What is an example of predictive analytics in supply chain?
Kärcher used predictive analytics to generate data-driven stock-level recommendations, combining current stocks, open orders, planned promotions, and master data into a single analytical pipeline. The result: a 15% reduction in inventory value while maintaining high service levels.
What are the main benefits of predictive analytics in supply chain?
Better forecast accuracy, lower inventory costs, faster decision-making, reduced manual work, and improved supplier and carrier coordination. The biggest gains typically come from replacing manual data processes with automated, repeatable workflows.
What tools are used for supply chain predictive analytics?
Enterprise platforms like SAP IBP and Oracle SCM Cloud, cloud platforms like Azure ML, and open-source solutions like KNIME and Python. The best choice depends on your team’s technical skills and existing systems. Many teams start free with KNIME or Python, prove ROI on one use case, and scale from there.
How much does it cost to implement predictive analytics in supply chain?
Costs range from free (KNIME/Python) to $500,000+ for large enterprise deployments. Starting with a free tool and a focused use case is the lowest-risk path to proving value before committing to a major platform investment.
What’s the difference between predictive and prescriptive analytics in supply chain?
Predictive analytics forecasts what will happen — for example, demand will increase 30% in Q4. Prescriptive analytics recommends what to do about it — for example, increase orders from Supplier B by March 15 to meet that demand while maintaining safety stock. Predictive is the input; prescriptive is the output.
Meet volatility with modern supply chain analytics
When volatility is a structural condition, not a temporary disruption, reacting faster isn't enough. You need to see further.
Modern supply chain analytics is how that foresight gets built. Not through AI moonshots, but through connected data, automated workflows, and models that give demand planners, inventory analysts, and sourcing teams the visibility to act before problems compound. The shift toward supply chain control towers, real-time data integration, and agentic AI isn't a distant horizon — it's the direction teams with solid predictive foundations are already moving toward.
The organizations seeing the clearest results — Audi, Kärcher, Volkswagen, Lindner, P&G — didn't start there. They started by fixing broken data flows. Clean data, connected systems, and workflows that run without manual intervention. That foundation is what makes resilience operational, not just aspirational.
As the World Economic Forum's 2026 report makes clear, competitive advantage belongs to those who prioritize foresight and ecosystem coordination. Predictive analytics is how that plays out in practice — one workflow at a time.
KNIME is built for exactly that starting point: a visual analytics platform that connects the data sources you already have, without requiring a data science team or months of IT development. Supply chain resilience builds from there.