Healthcare, like medicine, has been in constant evolution since Hippocrates' times. The latest evolution step has been digitalization. Digitization of healthcare data has unified what has been isolated and siloed for a long time. It has opened the doors to a large number of potential applications with significant clinical impact!
Digital healthcare ranges from accessing and analyzing patient records to monitoring bio-signals, from reading and absorbing new concepts in specialist literature to innovative drug design, identification of novel combination treatments, and so much more.
The data analysis procedures are often run by non-domain experts such as data scientists. However, it’s the physicians, surgeons, nurses, and pharmacists who understand the need for data driven solutions. Their domain knowledge makes them the best at drawing meaningful and actionable insights from such analysis. Training in computer programming and data science are not an integral part of their education. Ergo: Those who best understand the problems in healthcare and keen to apply data driven solutions are the least likely to create an impact from the digitized data available at their fingertips.
Low-code enables self-sufficient domain experts
KNIME Analytics Platform, as a no-code/low-code data science tool removes these barriers and enables the healthcare domain experts to easily start creating and testing data driven solutions for their area of specialization.
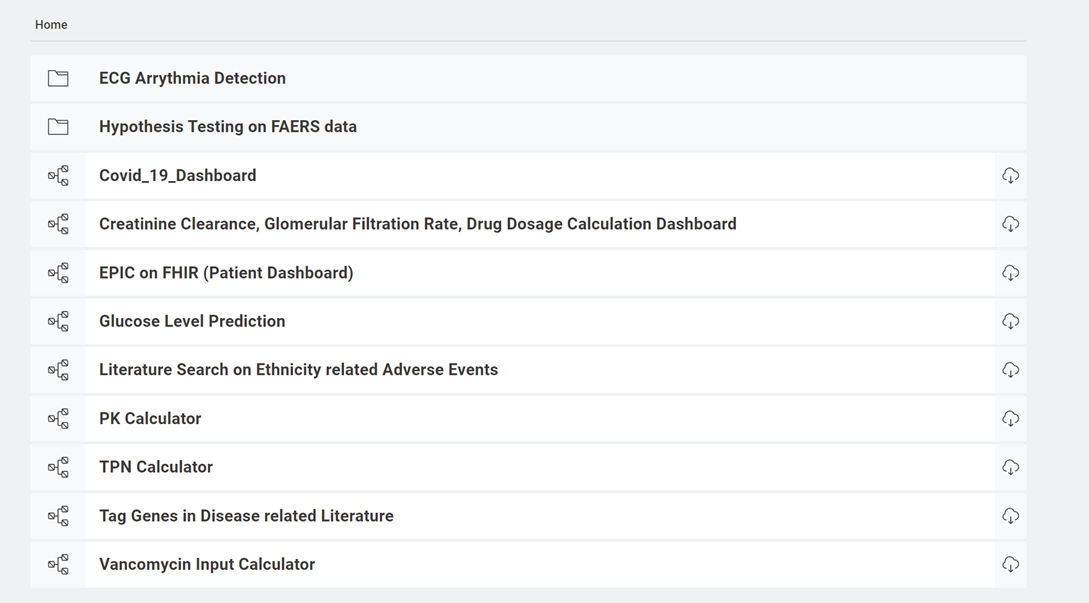
Here, in this project we highlight seven common digital healthcare use cases that can be solved using KNIME Analytics Platform. All these solutions are collected in the Digital Healthcare space on the KNIME Hub. They are free to download and adapt to your own requirements. In this article we describe the use cases, demonstrate the relevance of each workflow and the insights they bring.
We have created example workflows for:
- Vancomycin dosing in obesity
- Automating TPN calculation
- Kidney Health Monitoring
- Automating pharmacokinetics calculations
- Accessing patient digital records via EPIC on FHIR
- Visualizing disease tracking data using COVID-19 as an example
- Predicting patient glucose levels with signal processing
- Detecting ECG Arrhythmia with signal classification:
- Hypothesis testing based on the FAERS dataset
- Disease tagging in literature articles using NLP techniques
- Reviewing scientific literature reviews using ontologies, dictionaries and synonyms
Note. This solution repository has been designed, implemented, and maintained by a mixed team of KNIME users from the KNIME offices in Germany and healthcare and data science research experts from the Virginia Commonwealth University, School of Pharmacy (VCU-SOP) in Richmond, Virginia (USA).
1. Calculate vancomycin dosing based on latest scientific findings
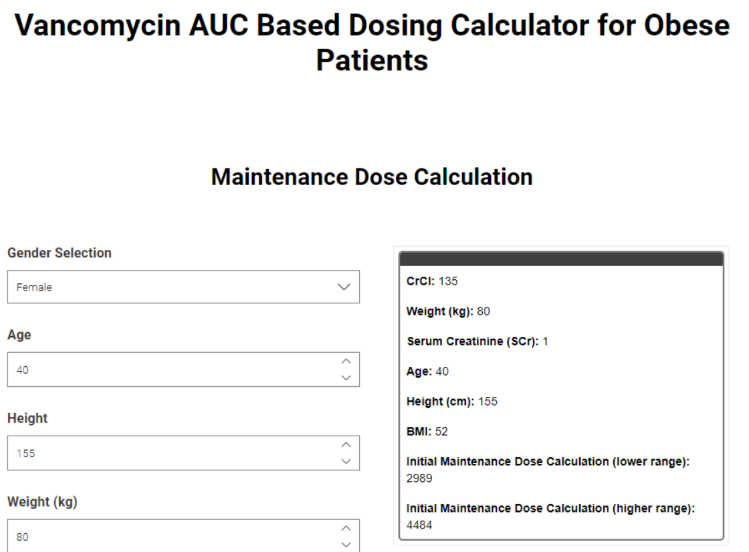
The dosing of Vancomycin, an antibiotic used to treat serious bacterial infections, is a complex calculation that often can be time consuming in a clinical setting. Therefore an automated solution, deployed as a data app and accessible via the web browser brings many advantages covering time constraints, dosing inaccuracies and also special population considerations.
With this example Danielle Holdren shows how KNIME Analytics Platform can be used to create a Vancomycin dosing calculator, based on latest scientific publications, keeping it fully flexible for changes and needs for future users.
Read the full article, How a Data App Improves Vancomycin Dosing in Obesity.
2. Automate calculation of Total Parenteral Nutrition (TPN) for results in seconds
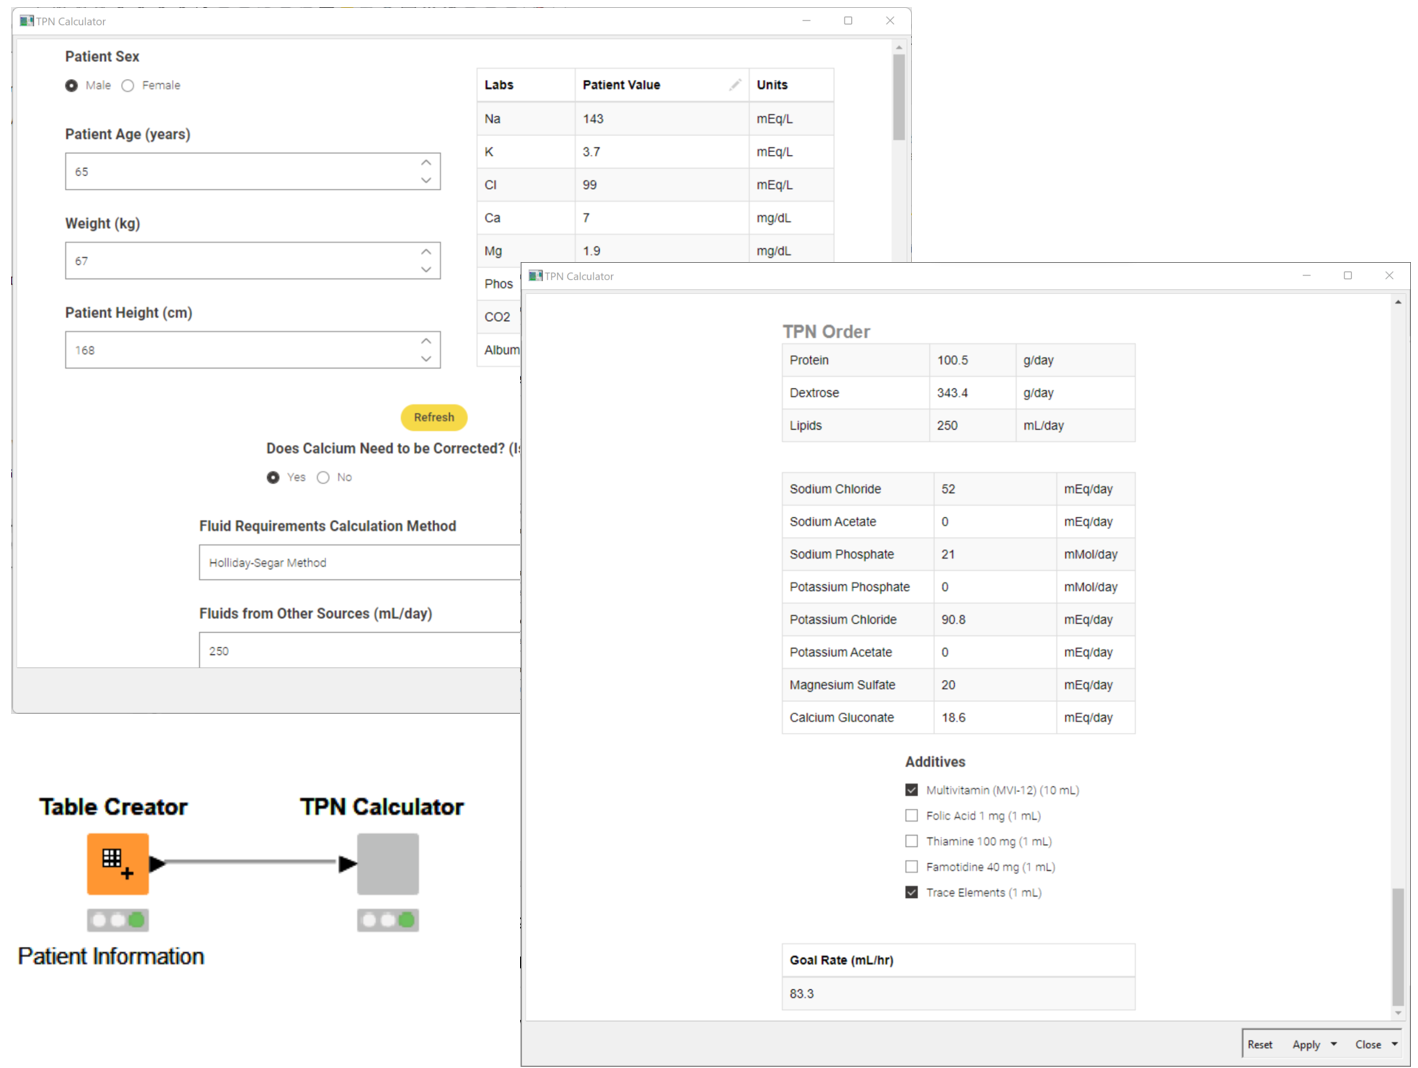
Total Parenteral Nutrition (TPN) is an important tool that ensure patients are provided with their daily nutritional needs. However, calculation of TPN isn’t an easy task and contains many constraints that can lead to errors during the calculation. With this example workflow Courtney Ciarroca shows how KNIME can be used to develop an easy-to-use calculator that is capable of quickly calculating the TPN. It’s an intuitive dashboard that allows the clinician to change values as they change during patients treatment and get results within seconds.
Read the full article, Automating TPN Calculation in KNIME for Quality Care.
3. Monitor kidney health with a data app for easier calculation of Creatine Clearance
There are several values that are often used as a measurement to monitor how well our kidneys are working. Not all measurements are easy to calculate and are influenced by many different factors. With this example workflow Malik Graves shows how KNIME can be used to simplify the calculation of Creatinine Clearance via a data application that can be used in a clinical setting.
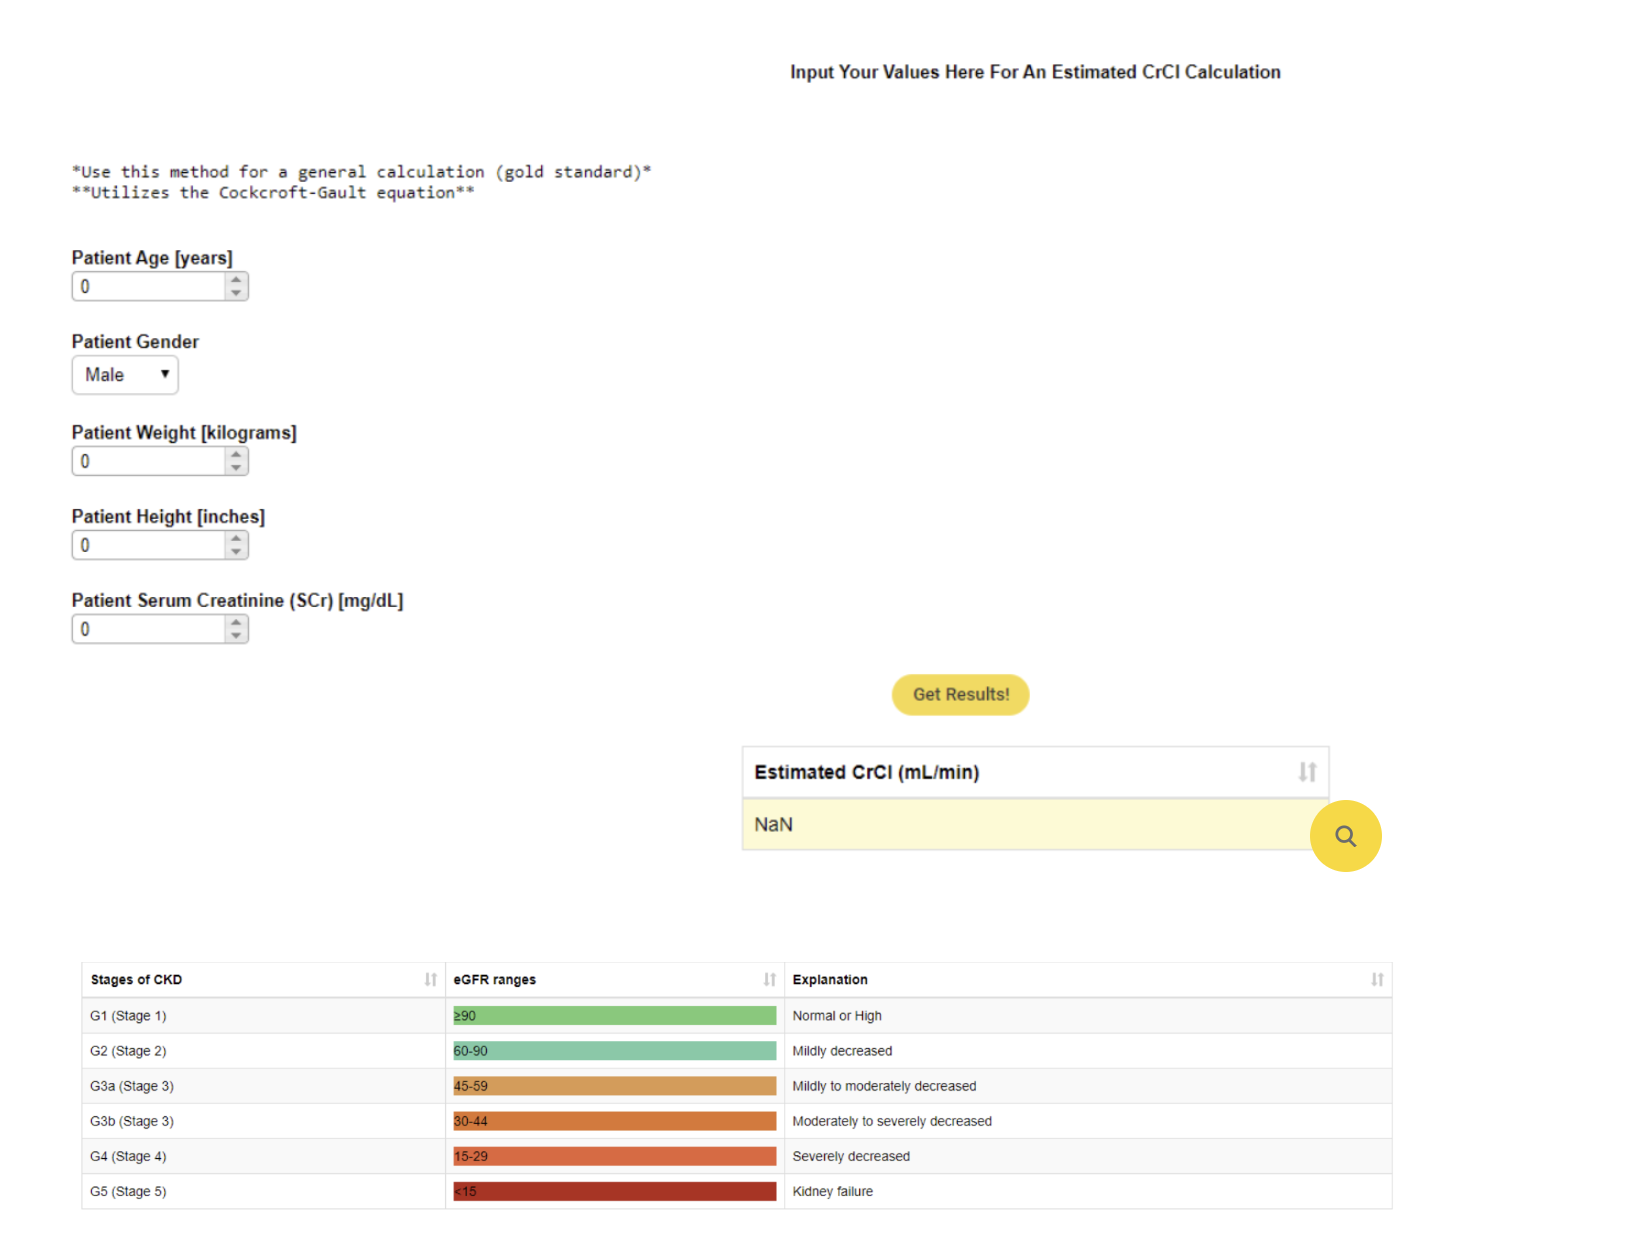
Read the full article, Monitor Kidney Health in KNIME.
4. Automate pharmacokinetics calculation to save time and compute-power
Pharmacokinetics is a branch of pharmacology that provides insight on how the body responds to a drug. It encompasses processes such as Absorption, Distribution, Metabolism, and Excretion (ADME), which can be used to determine how efficient and how safe a drug is. Clinicians use pharmacokinetic parameters and calculations to visualize and interpret each of the phases of ADME as they monitor a drug’s action in vivo. However, one of the challenges in pharmacokinetics (PK) is the time and computational power these calculations require.
Automating PL calculation in clinical practice can provide a more efficient process of drug monitoring with pharmacokinetic parameters. Danielle Holdren built a workflow for pharmacokinetic calculation and added an interactive dashboard which enables clinicians to quickly gain insight on how patients are responding to a drug.
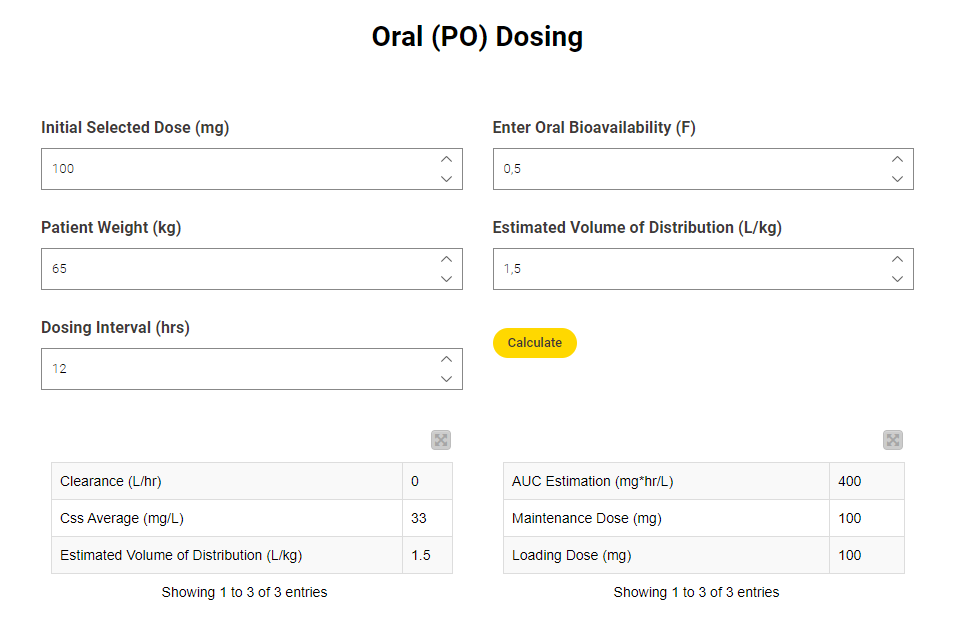
Read the full article, Automating Pharmacokinetics Calculation in KNIME.
5. Access patient digital records on FHIR
A majority of the US healthcare systems are moving to Epic as their primary electronic medical record platform. The ability to integrate a code free data analysis solution to such an EMR platform has potential for significant impact by allowing healthcare domain experts to test out new treatment approaches without having to learn how to code, using KNIME.
In a prior publication, Mateen et al., demonstrated how to populate patient data to a FHIR server using the KNIME Analytics Platform and the POST method. Here we demonstrate how to extract FHIR patient data coming from Epic on FHIR using the a GET Request. With our workflow we show what data extraction could look like using the REST based WebService. Once the data is there, we display it in a very simple visualization.
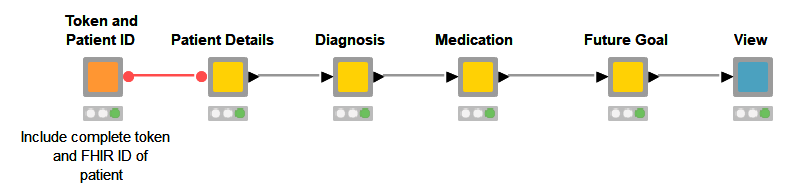
Read the full article, Interact with EPIC on FHIR to Visualize Patient Data.
6. Visualize disease tracking data in a dashboard
The John Hopkins University tracks Covid19 data from sources from across the world. It introduced a coronavirus-tracker web service to query data from the entire world or from any specific country. With this short project we now show how to gather data from the web service they provide and also demonstrate how that data can be displayed as a dashboard.
Read the full article, Track Disease with KNIME on COVID-19 Dashboard.
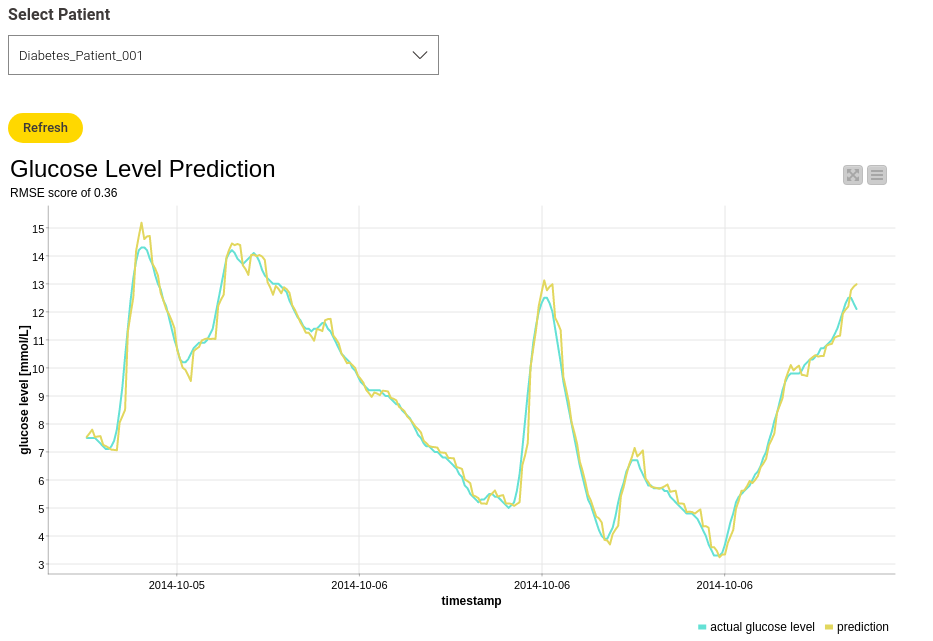
7. Predict blood sugar levels from glucose monitoring
Continuous glucose monitoring (CGM) has been demonstrated to provide highly actionable insights for healthcare professionals to better manage diabetes among their patients with both type I and type II diabetes.
In this project we demonstrate how machine learning, Long Short-Term Network (LSTM) in particular, can be used to predict future blood glucose levels. Devices called continuous glucose monitors record blood sugar (glucose) levels at certain time intervals, transmitting the data to an app or software. This way, a user can see their current and past blood glucose levels. To predict future blood glucose levels an LSTM network has been trained on the sensor data. This makes it possible to recognize early on how blood sugar levels could change in response to changes such as medications, lifestyle or diet.
The fact that the person's own prior data is being used to make future predictions allows a highly personalized approach towards managing diabetes. The same approach can be applied to the management of other chronic conditions where near continuous monitoring is available. Examples include the improved management of blood pressure via LSTM predictive modeling of readings from continuous blood pressure monitoring.
Read the full article, Predict Blood Glucose with an LSTM on CGM data
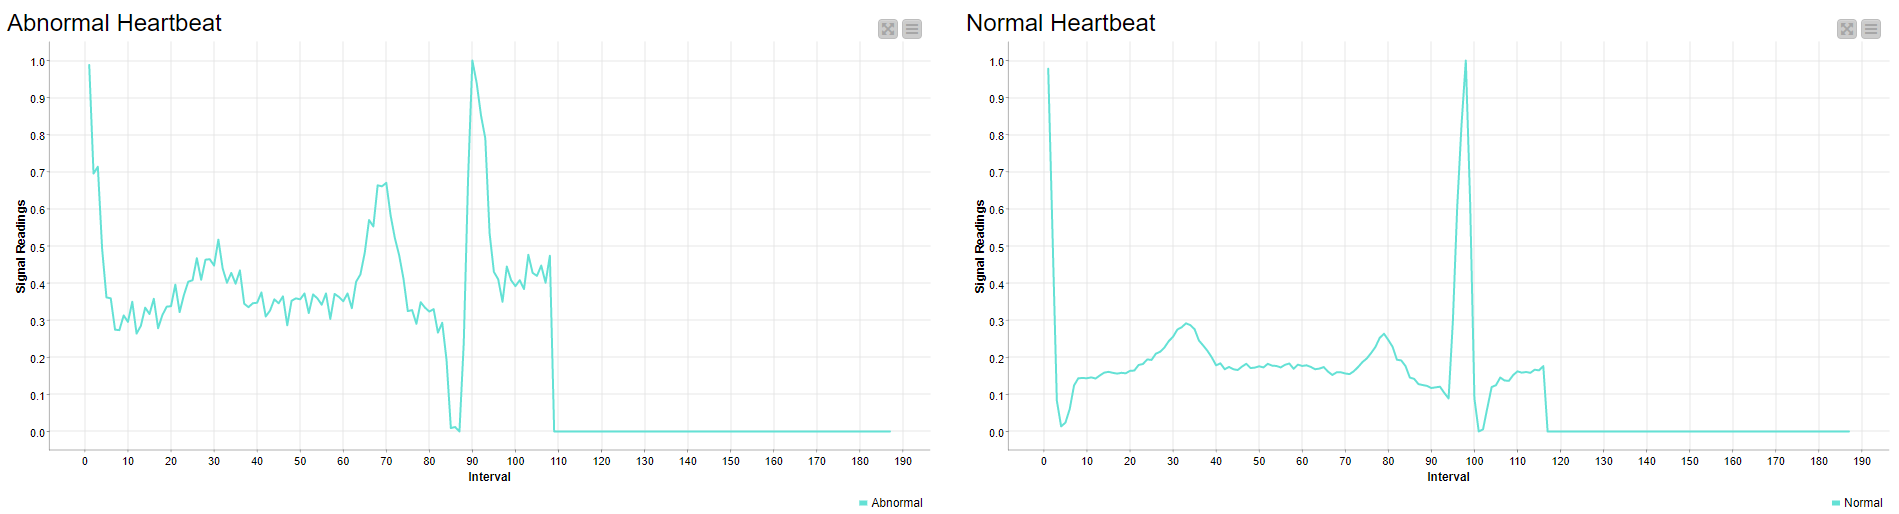
8. Detect arrhythmia with signal classification on electrocardiogram (ECG) data
In this project, ECG data from Kaggle is used to train a deep learning model and classify ECG signals in KNIME. There are two parts of the project; the first part classifies ECG data into normal or abnormal readings and the second part is the multiclass classification for detecting Arrhythmia from a set of five different groups of readings.
Read the full articles:
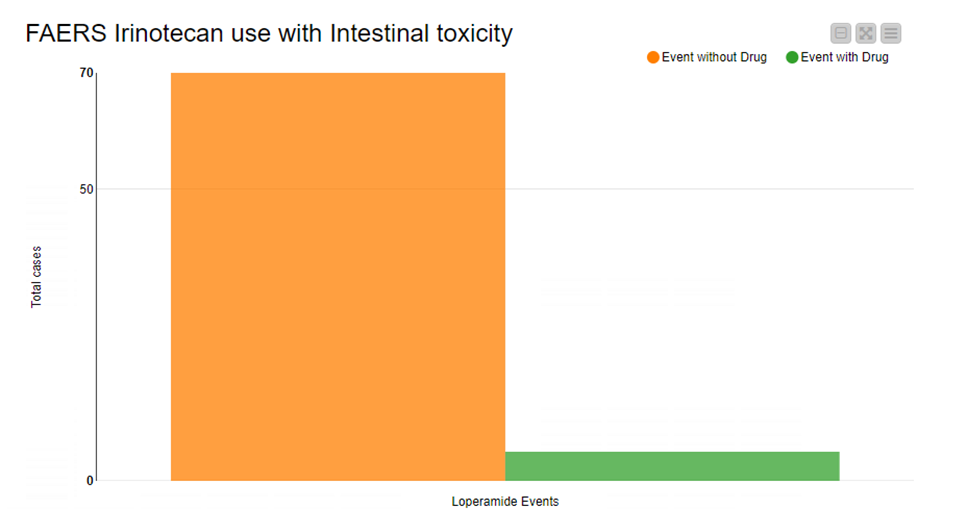
9. Hypothesis testing in medicine with FAERS data
Traditionally testing medical interventions always required clinical trials. However, with the large volumes of healthcare data becoming more publicly accessible, early hypotheses can be verified using a data driven approach prior to moving into clinical trials for validation.
Often accessing and analyzing these vast healthcare data repositories require a significant amount of coding knowledge. We asked the question, can such early data driven hypotheses be tested in large healthcare datasets using KNIME? Should this be the case, it will empower healthcare professionals to quickly test out possible outcomes of different treatments among specific patient populations and also to identify potential new treatment combinations.
KNIME based workflows are highly reproducible and once built can be deployed into multiple healthcare settings to assess the validity of such approaches. With this example workflow we show how to investigate adverse events submitted to the FDA from the FAERS database and try to answer the question if there are any medications that when administered with Irinotecan, has the potential to negate the onset of intestinal toxicity.
Read the full article, How to use FAERS for Adverse Reaction Management.
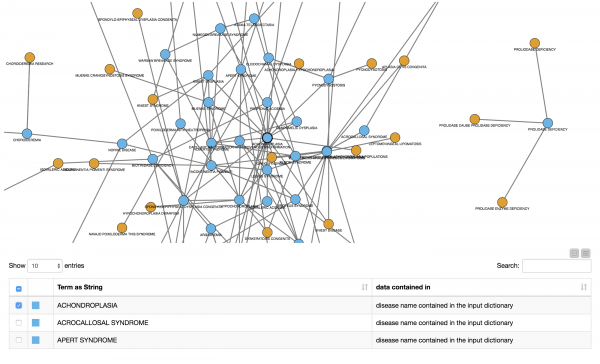
10. Disease tagging to understand impact of new diseases
The pace of scientific discoveries is quickly exceeding our ability to digest those findings and apply them as innovative healthcare solutions. Computational approaches are sorely needed to find hidden insights. In this example, we demonstrate how to create a model that learns disease names in a set of documents from the biomedical literature. The authors demonstrate how to automatically extract abstracts from PubMed and use these documents to train a model with an initial list of disease names from a dictionary. Once they find new disease names they can check their co-occurrence with other diseases in the extracted abstracts and create a co-occurrence network.
Insights gained from such information extraction has significant benefit in understanding the differential impacts of new diseases among patients with other co-occurring diseases. One current and relevant example would be to investigate how COVID-19 impacted different groups of people based on the co-occurrence of prior diseases.
Read a walk-through of how to Tag Disease Names in Biomedical Literature.
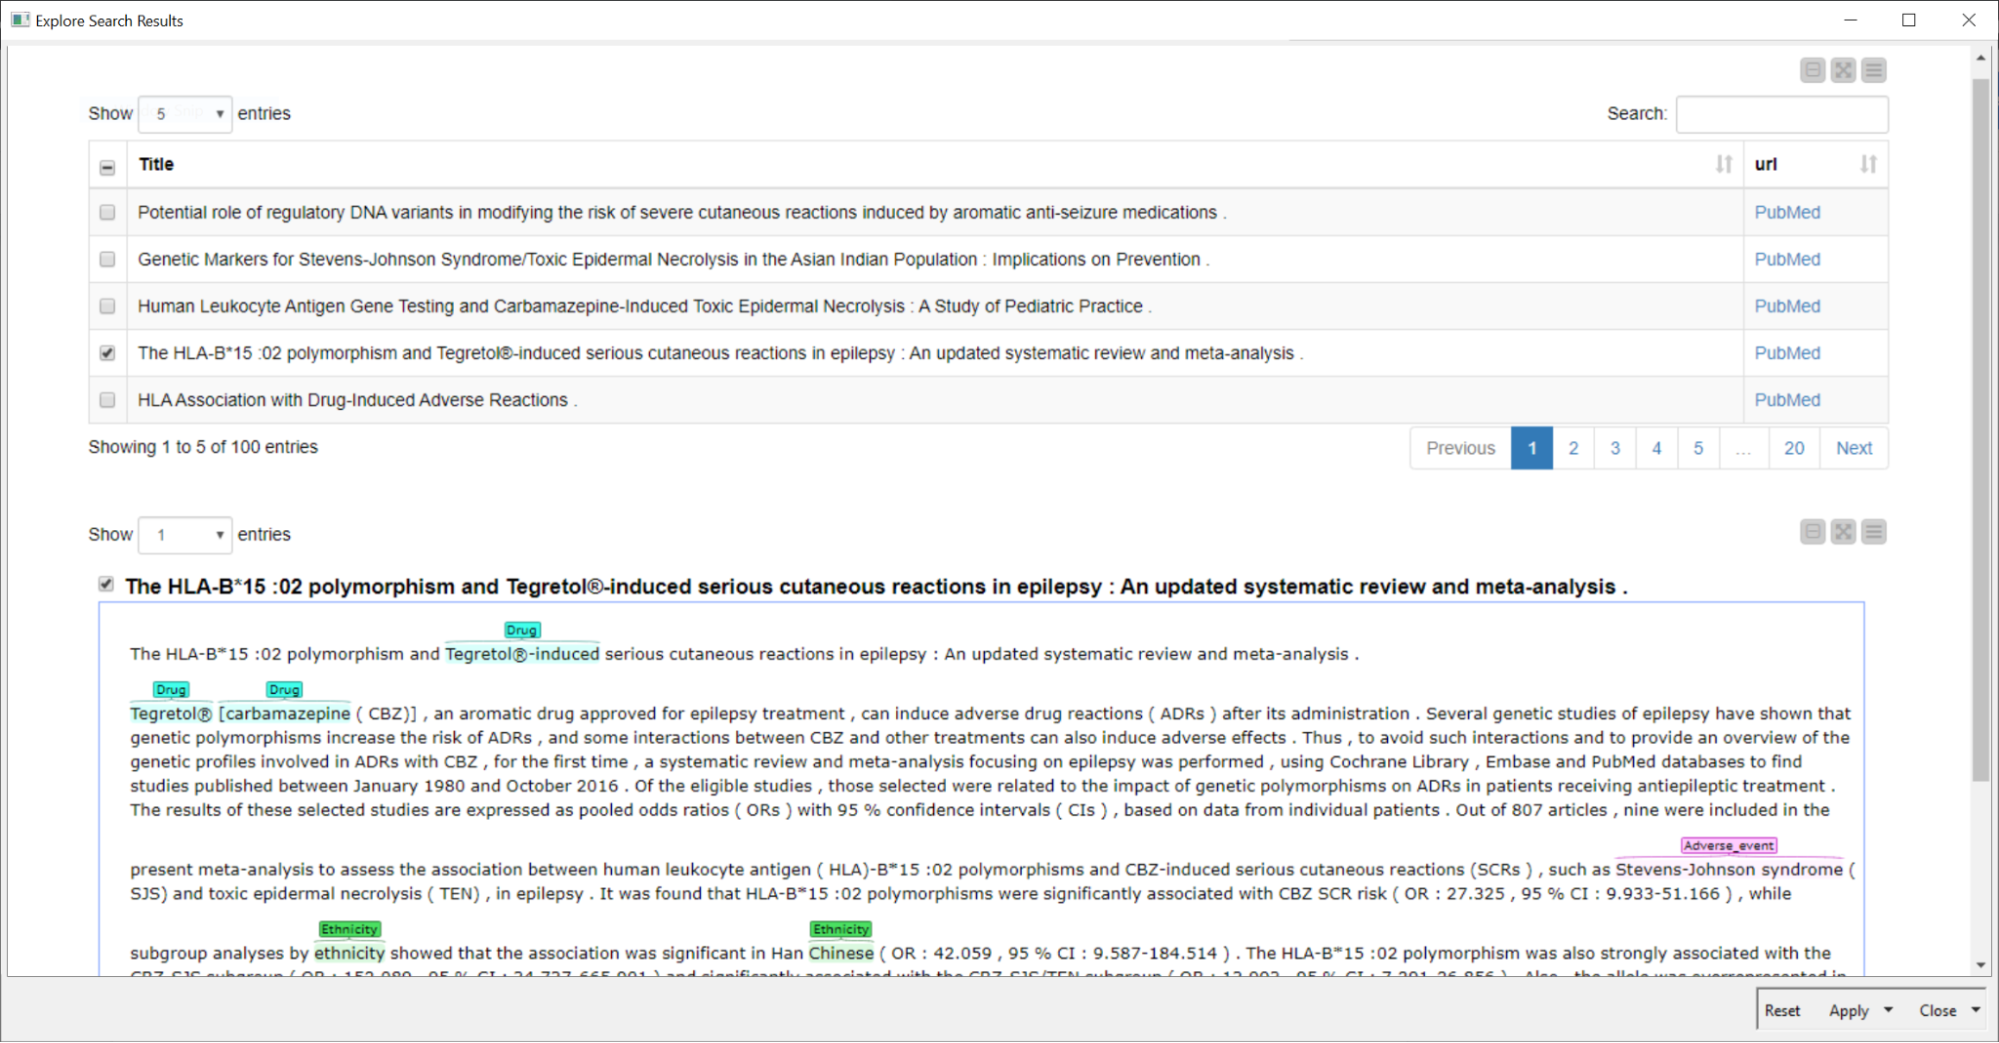
11. Improve identification of key information in scientific literature reviews
Searching for relevant information within the large volumes of various scientific literature is not a simple task. We’ve built two example workflows to demonstrate how to improve the identification of relevant information via an interactive visualization. This approach helps to identify the right information with tagged terms directly in one place.
We’ve added two improvements: To improve the search we added terms from an ontology and synonyms to the search query. To improve coverage of the published literature we also used two different sources for biomedical literature simultaneously. We demonstrate this application of KNIME, investigating relationships between adverse events of a drug and the ethnic background of a patient to gain insights towards pharmacogenetic based precision medicine. The second example workflow maps genes identified in literature that are related to the disease being investigated.
Read the full article, Improve Literature Search & Minimize Information Overload.
Low-Code Tool Empowers Healthcare Experts
A mixed team of KNIME users from industry and academia has created, developed, and is maintaining low code solutions to access patient digital records via FHIR and EPIC, to design dashboards for disease tracking, for example for COVID19 data; to monitor glucose level or similar signals, to classify arrhythmia from an ECG signal, to perform hypothesis testing in medicine, and to tag diseases and investigate adverse events via NLP techniques.
These workflows are intended as example solutions to common problems in digital healthcare. Pharmacists, physicians, surgeons, dentists, nurses, biologists, and other domain expert figures can download them and customize them to their data and their business requirements.