
Working in finance or in accounting, you know how much time and work is spent in balancing Excel sheets. The biggest drawback here is that in Excel you always have to redefine the process for how you work with your data. You process the data and finally produce a table but you have no documentation of what happened during your process. That means the next time, you have to repeat it.
A data science tool can help by reliably automating all your operations on financial data.
KNIME Analytics Platform enables you to automate and simplify data access, data blending, reporting, as well as many other operations with data. The interaction with your data happens via nodes – each node performing a particular operation and offering you different configuration options. The nodes connect into visual workflows. These workflows, once built and configured, can be reused with up-to-date data on a regular basis. A workflow allows you to store different stages of your process – you can always go back to the workflow, check each node’s configuration and input and output data. This makes your workflows transparent and shareable.
In this article, we have packaged up some example solutions for common tasks in financial analysis. Find data science solutions for advanced finance analytics topics including data visualization, time series analysis, machine learning modeling, and model evaluation. The blueprints described in this article also include codeless solutions for problems that are usually expected to be tackled via coding.
Read on to find finance analytics solutions for:
- MRR and ARR of Customer Groups
- Overview of Credit Card Fraud Detection Techniques
- Finding the Optimal Classification based on Cost and Profit
- Calculate and Analyze Asset Return
This article also provides further resources: links to blog posts, book chapters, or videos for more details. All workflows can be downloaded for free from the Finance, Accounting, and Audit space on the KNIME Hub and all verified components from the Financial Analysis space. Ready? Get started with KNIME for FP&A!
MRR and ARR of Customer Groups
Sometimes analyzing the cohorts – groups of customers sharing some characteristics – can reveal trends and patterns that could not be identified from individual records. One of the characteristics you can group your customers by is the time when they started doing business with you. We then talk about the time-based cohorts. Another dimension for analysis is the metric to be compared across different cohorts, such as ARR, MRR, customer count, customer churn, or any other.
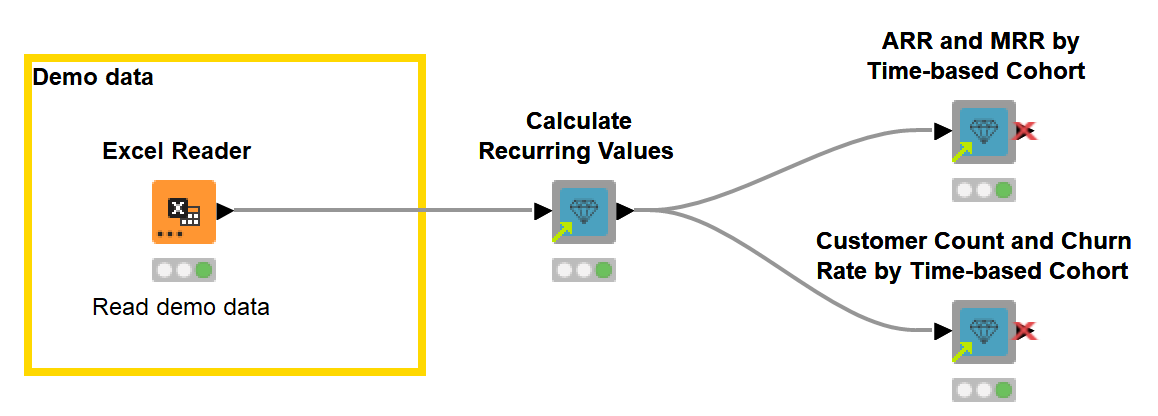
The workflow, MRR and ARR of Customer Groups, enables you to analyze time-based cohorts in just two steps (Fig. 1).
- The blueprint first formats the contract data to time series data using the Calculate Recurring Values component.
- Then, you can choose the metric to compare between the cohorts: ARR, MRR, Customer Count, or Churn Rate, and whether to visualize a cumulative or an actual metric. To calculate and visualize the revenue metrics and the churn metrics by time and time-based cohorts, the blueprint uses the following shared components:
You can find more details on this use case in the blog article, Seeing the Forest for the Trees - Cohort Analysis.
Shared components. In KNIME, you can encapsulate workflow parts, e.g., routine repetitive processes, into reusable components. Since components can have a configuration dialog just like KNIME nodes, when you create a component, you basically create a new node performing a customized task. You can create your components as well as use the components dedicated for the financial analysis created and verified by KNIME experts. Yet shared components for financial analysis aren’t the only way to interact with financial data. In the next blueprints you’ll see how we combined standard KNIME nodes into extremely flexible and powerful workflows.
Overview of Credit Card Fraud Detection Techniques
With global credit card fraud loss on the rise, it is important for banks, as well as e-commerce companies, to be able to detect fraudulent transactions before they are completed. Fraud detection in credit card transactions is a very wide and complex field. Over the years, a number of techniques have been proposed, mostly stemming from the anomaly detection branch of data science.
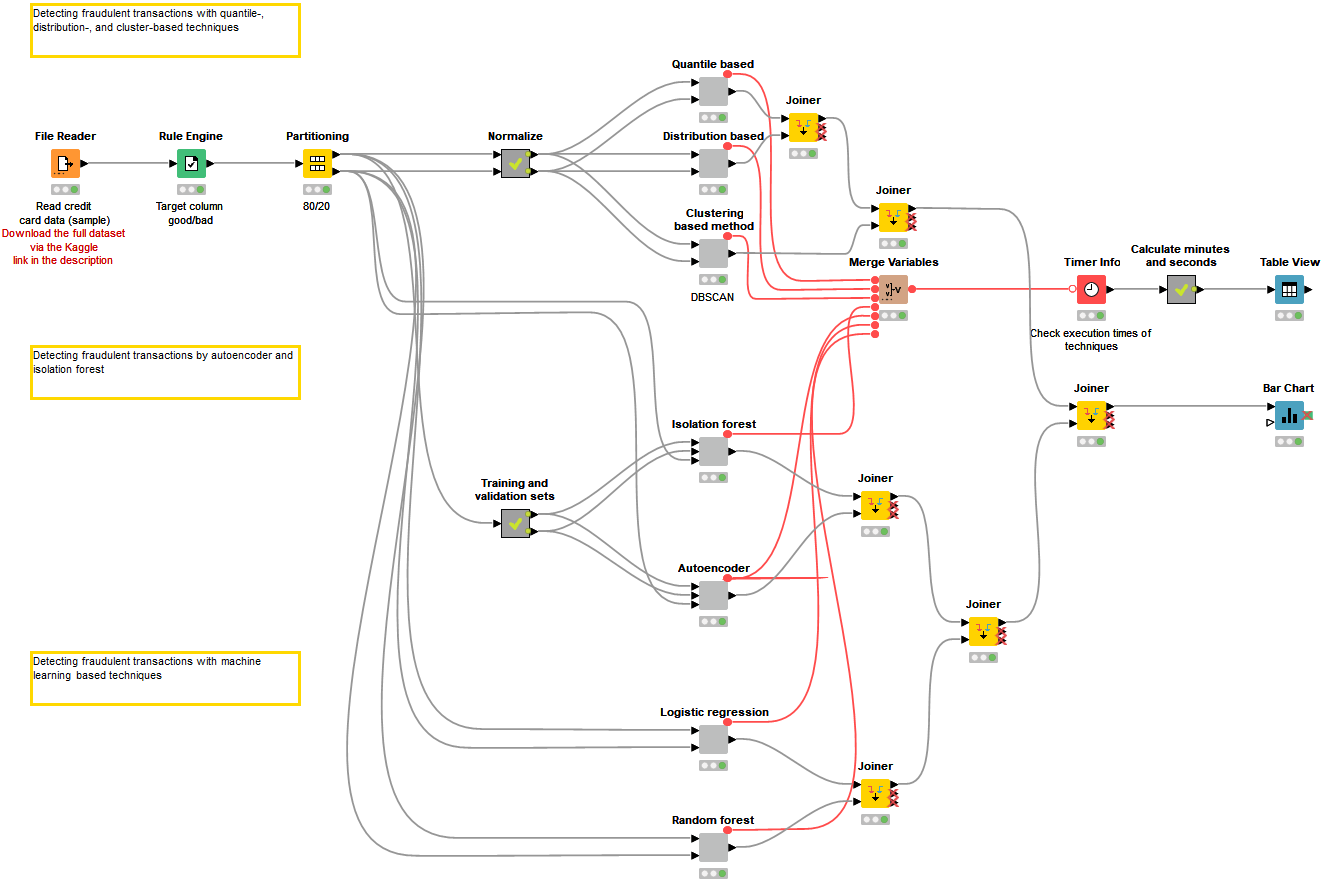
The workflow, Overview of Credit Card Fraud Detection Techniques, presents the overview of seven statistics and machine learning based techniques for credit card fraud detection (Fig. 2):
-
Among the techniques commonly used when the data set has a sufficient number of fraudulent transactions, the blueprint presents two classification algorithms (Logistic Regression and Random Forest). You will see that both supervised approaches perform very well even though the number of legitimate transactions in the data set is much higher than the number of the fraudulent transactions.
-
Since sometimes even a small number of fraudulent transactions is not available and supervised algorithms can’t be trained, the blueprint also demonstrates the techniques used when the data set has no or very few fraudulent transactions. Among these techniques are quantile, distribution, clustering (DBSCAN), and anomaly or outlier detection (Autoencoder and Isolation Forest) approaches. You will see that these techniques are less accurate but are still feasible for detecting fraud.
You can find more information on some of the presented techniques in this webinar and in the blog article, Fraud Detection using Random Forest, Neural Autoencoder, and Isolation Forest techniques.
Finding the Optimal Classification based on Cost and Profit
If you train machine learning models, you will know about the model evaluation stage – measuring model’s accuracy, checking confusion matrix… But what exactly does low accuracy mean for a company’s budget?
For example, in a credit scoring application, refusing a reliable applicant causes opportunity costs whereas approving a risky applicant leads to a bad debt. We see that although both errors are bad, the latter is worse. Therefore, errors a machine learning model makes actually cost a company money, some errors more and some less. Weighting the classification errors in terms of expected profit, optimizing a model’s threshold, and measuring a model’s performance with the more concrete metric, for example, expected profit, can significantly improve a company's decision making and increase profits.
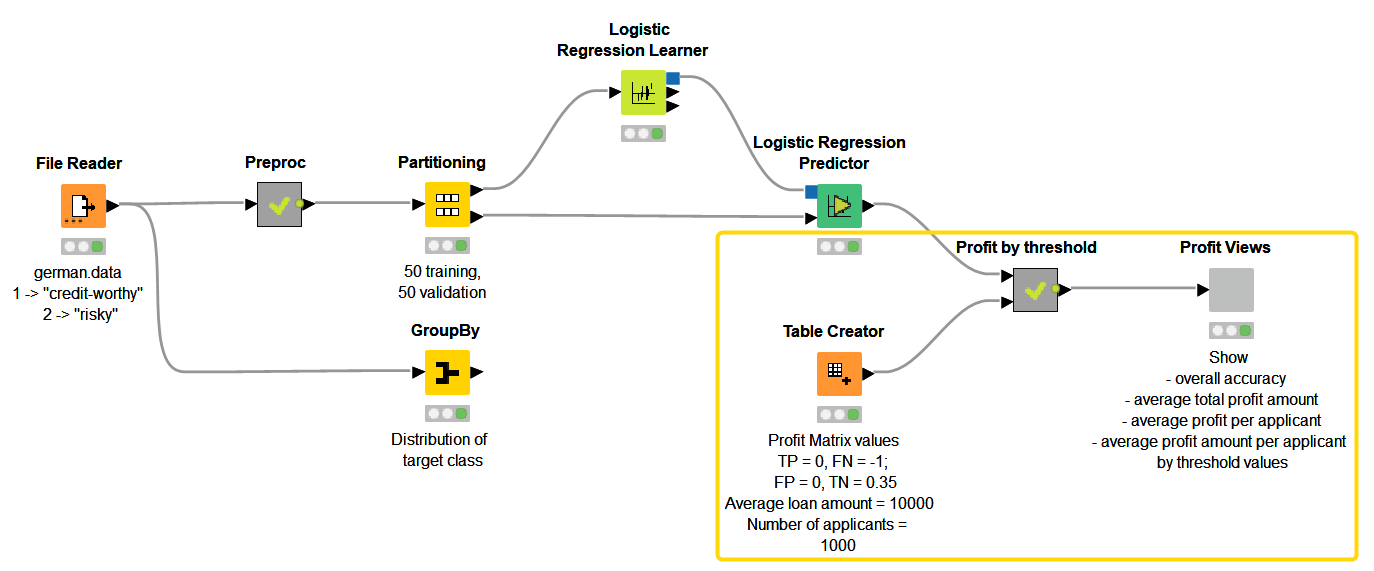
The workflow, Finding the Optimal Classification based on Cost and Profit (Fig. 3):
- Trains a classification model that predicts creditworthiness,
- Assesses its accuracy and expected profit based on the predicted scores, predefined weights for misclassification (reasoned in terms of expected profit), and varying values of the classification threshold.
- Visualizes the expected profit by different threshold values and allows empirically to find the optimal threshold
You can find more details on this use case in the blog article, From Modeling to Scoring: Finding an Optimal Classification Threshold based on Cost and Profit. To find out even more about machine learning models evaluation, download our new free e-book From Modeling to Model Evaluation.
Calculate and Analyze Asset Return
Asset prices are the daily bread of financial time series analysis. In practice, the first step in the analysis is to convert the prices into returns. Since returns are percentages, comparison between different assets becomes possible. Besides, returns are closer to stationarity and normality, which makes both the predictable and the unpredictable part of the series easier to model. Furthermore, the returns are often transformed into log returns. The log returns have even better distribution properties than simple returns. They can also be easily aggregated: the weekly log returns are simply the sums of daily log returns within each week.
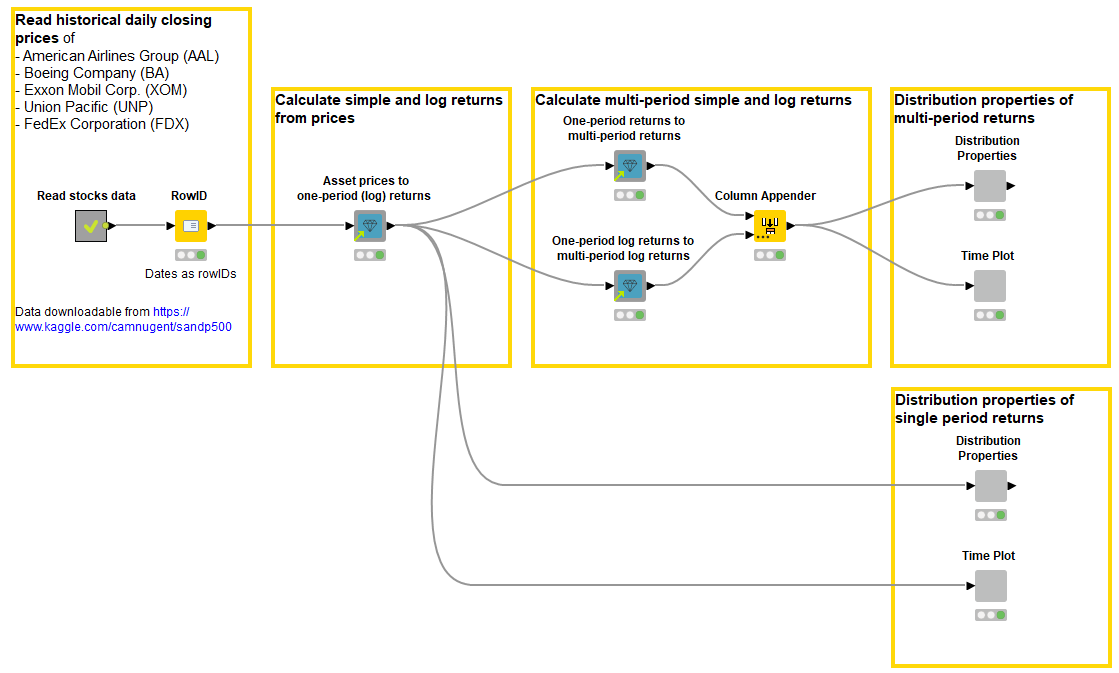
The workflow, Calculate and Analyze Asset Return (Fig. 4) analyzes the statistical properties of the closing stock prices of five S&P 500 companies:
- It calculates single- and multi-period simple and log returns,
- defines the distribution properties of returns,
- and visualizes the returns for the selected company in a histogram and in the time plot.
The blueprint uses the following shared components:
- Asset prices to one-period (log) returns component calculates one-period simple and log asset return series from asset price series.
- One-period returns to multi-period returns calculates k-period simple return series from one-period simple return series.
- One-period log returns to multi-period log returns does the same for log returns.
Advantages of a data science tool for finance analytics at a glance
In this blog post, we have put together the overview of the blueprints for finance analytics that we have implemented in KNIME Analytics Platform. These blueprints cover different finance use cases from different industries and demonstrate the advantages over managing spreadsheets or coding that visual programming can bring to finance teams. Let’s summarize some of them:
- Flexibility: Combining nodes, each performing a special task, allows you to build extremely flexible and customized workflows, performing various data operations including those used in daily financial tasks.
- Reusability: A workflow, once built and configured, can be reused without any adjustments for the up-to-date data.
- There is no need to perform the same operations each time new data arrives. Furthermore, KNIME Server allows scheduling the workflows execution.
- When a workflow is standardized and repetitive, you can encapsulate it in a reusable component, create its configuration dialog, and share it. A component is basically your own node that performs your special task.
- Error control: You can observe the whole process your data goes through from being read into the workflow, through all the pre-processing steps, till reporting, visualization, or deployment. At each step, your data are “backed up” in a node’s output.
- No formula is hidden behind the table values.
- No data are lost in a series of copy-past transformations.
- Errors can easily be traced back and corrected.
- Data and tool blending: You can access data directly from both local and remote file systems, databases, cloud storages, and web. There is no need to download data locally first or copy paste the tables. Likewise, you can write your data directly to remote locations and send it directly to the reporting and visualization tools.
- Data analytics for everyone: Visual workflows are intuitive. A workflow flows from left to right, nodes have self explaining names, fuzzy search simplifies finding the right node.
- Because being a visual programming environment, KNIME doesn’t require you to write code. The time for the learning curve is significantly reduced compared to learning how to write code.
- Web applications running on the KNIME Web Portal allow final users, such as finance teams, to interact with their data in an even simpler manner, without any knowledge of KNIME Analytics Platform.
Access blueprints Finance, Accounting, and Audit space on KNIME Community Hub
Find the blueprint workflows in the Finance, Accounting, and Audit KNIME Hub space, access them by simply dragging them from Hub to your KNIME Analytics Platform, and try them out with our demonstration data. If you want to try them out with your data, make sure that the authentication to your remote file systems (if any) is set up, paths to your files are correct, the data are structured in a similar way as in blueprints, the rules and processes are adjusted for your data and purposes.