
If data is the new oil, then we’re missing pipes.
When investing in data literacy, companies put a lot of effort into two main areas:
- Building up a data science team to answer questions with data, and
- Upskilling line-of-business teams to know what questions to ask
Once significant resources have been poured into both, many leaders are surprised to discover how slowly everything moves. Models rarely get into production, and feedback cycles between the two teams are incredibly lengthy.
As a discipline, data science still faces a final-mile problem.
Transforming data science into data apps and services is non-trivial and typically either requires dependence on IT or deep technical knowledge about deploying client server architectures. Data experts face the uphill battle of not just creating data science, but explaining data science to both technical and business counterparts in order to get even the smallest project out the door.
At KNIME, our aim is to tackle this problem head on and support the data team through every step of the data science lifecycle. A major step in this direction is KNIME data apps. We enable the data team to build completely transparent, flexible data apps – without any HTML, CSS, Javascript, API-wrangling or staging environments.
Tip: Build a UX for your data science, no frontend language required
At the heart of KNIME Analytics Platform is a visual programming environment. This environment is used to ingest, clean, blend, explore, and then ultimately productionize data science. The same environment can be used to build and automatically deploy data apps.
A KNIME user has the flexibility to build a wide variety of data apps, with precise control over:
- Interactivity: how much the end user can explore and control what data shows up on their screen
- Complexity: how sophisticated the underlying data science is
The complexity of data science, in particular, is what distinguishes KNIME data apps from BI solutions like Tableau or Qlik (although they can be used in tandem). While many BI tools make interactive visualizations easier, KNIME allows granular control over how data is transformed and what data science happens behind the scenes.
This level of customization ensures that anyone on the data team can build data apps for both technical and line-of-business end users. In the case of business-line end users, the app can be designed to guide them through understanding, exploring or manipulating their data through an intuitive interface. This approach is known as Guided Analytics.
You might build a data app to:
- Provide your leadership team with a dashboard of business KPIs and automatically-generated forecasts,
- Guide domain experts to access, visualize and explore their data,
- Enable your data science team to explore a complex machine learning algorithm via highly interactive interfaces.
All of this can be done using the same drag-and-drop, intuitive interface.
Any workflow built in KNIME can be deployed as a data app by including the appropriate components, giving the user significant choice and control over the underlying data science and UX.
How to build data apps
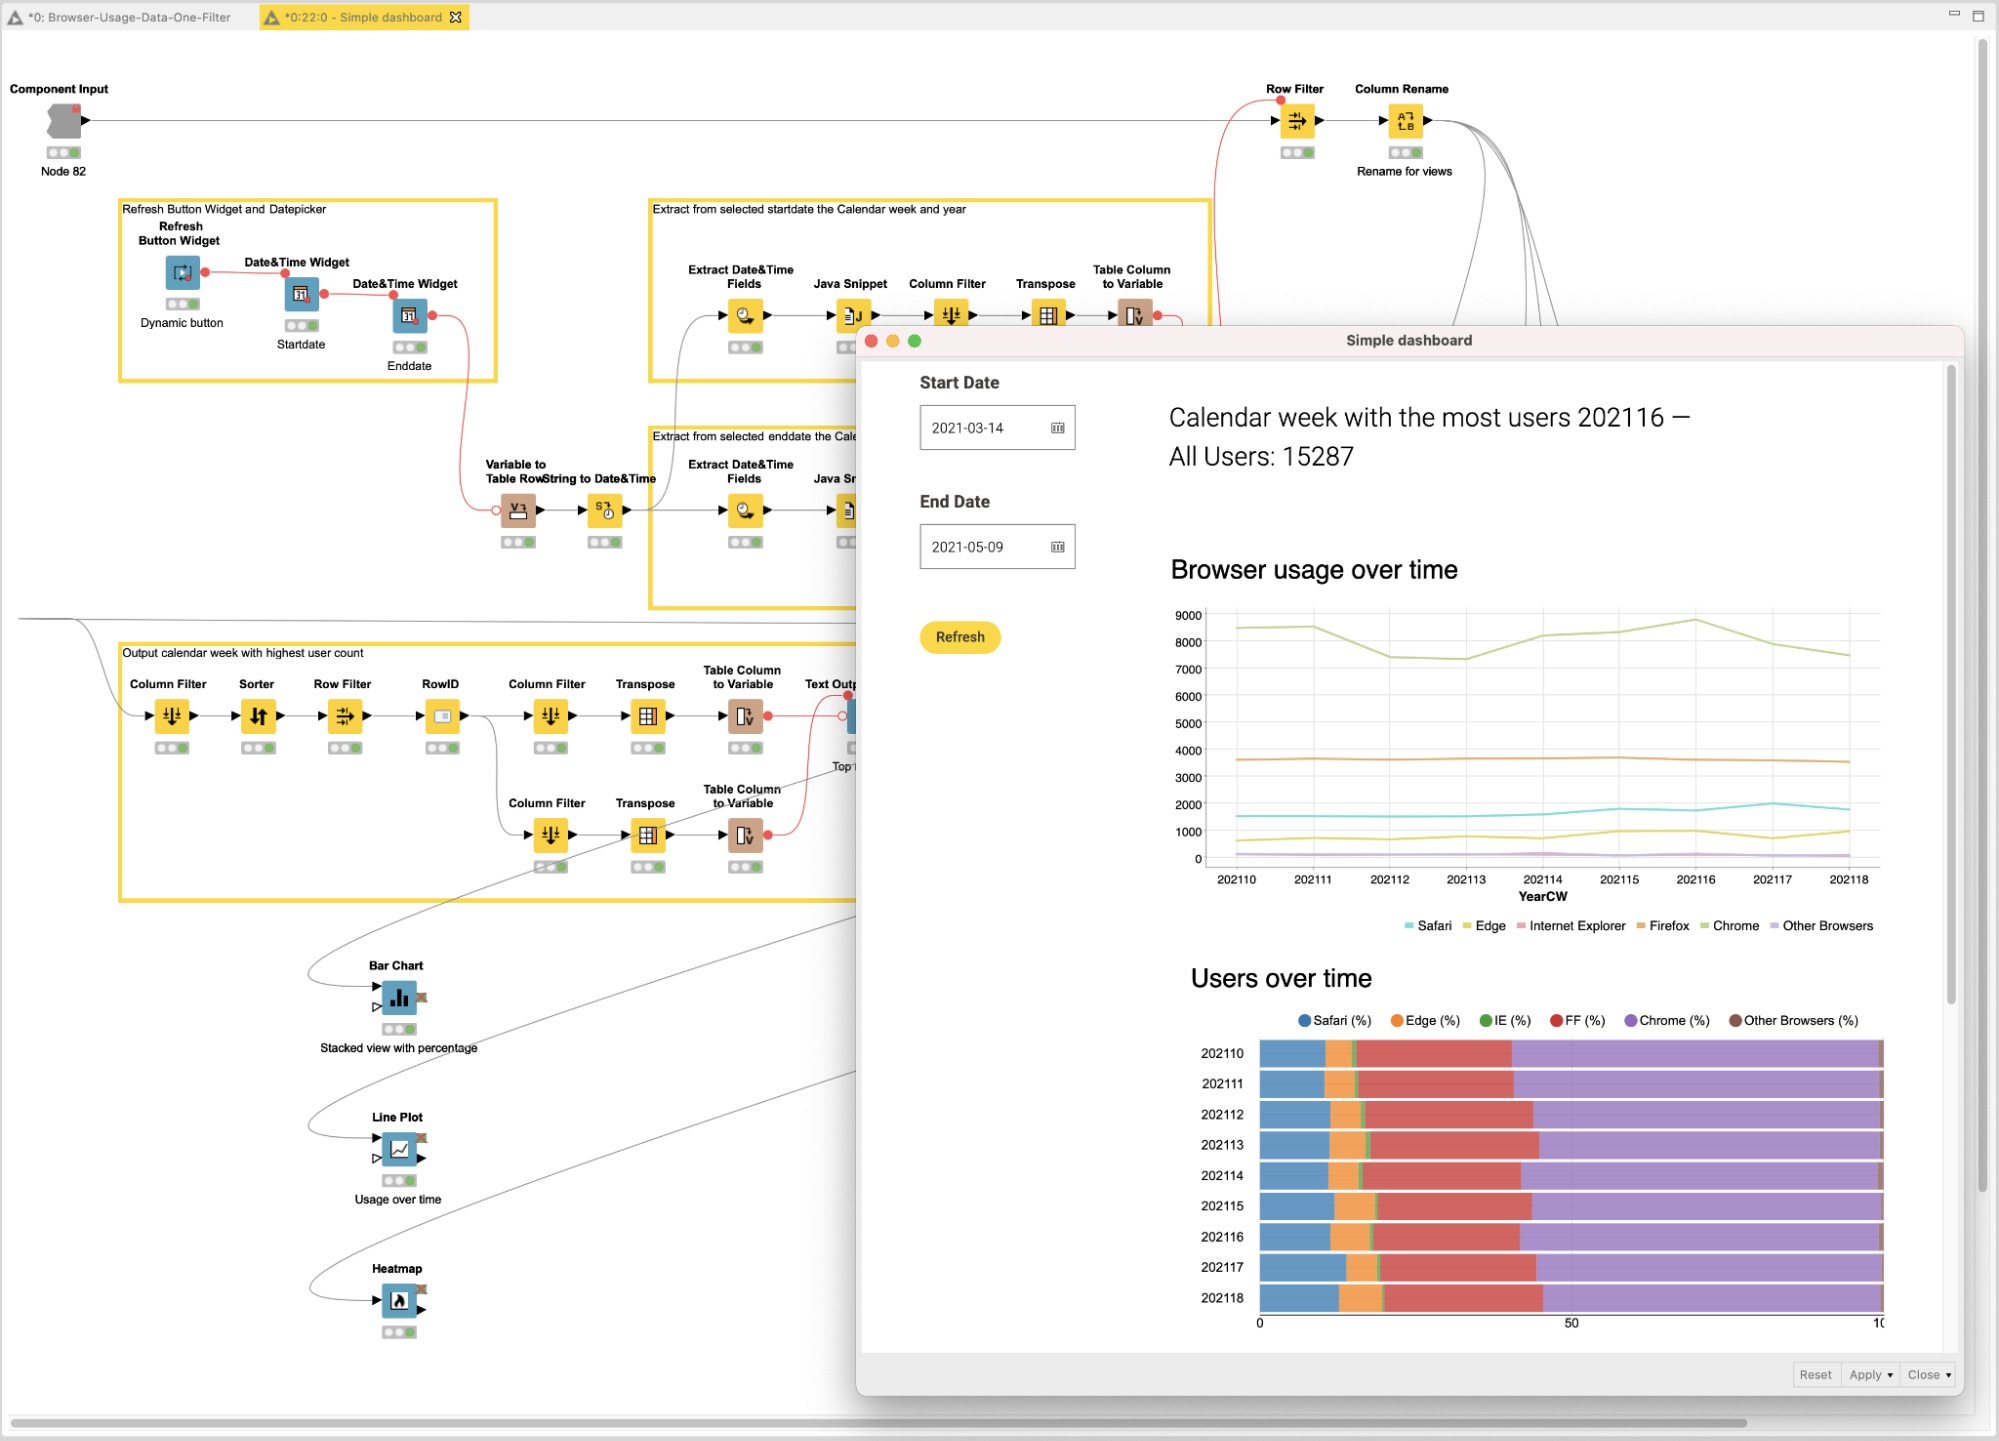
By dragging and dropping nodes, a KNIME workflow can be used for virtually every step of creating and productionizing data science. Data apps are built using special nodes in KNIME Analytics Platform that allow users to tweak the look and feel of each page, build in interaction, and string together multiple pages in the app.
Putting this into context, a typical KNIME data science project, end to end, would look something like this:
- First you might access and blend your data in KNIME’s visual programming environment.
- Then, you’d reach out to one of the many built-in algorithms or access any number of technologies integrated in KNIME’s open ecosystem (scripting languages like Python, machine learning libraries like H2O, etc).
- From there, construct your data apps using the same visual, intuitive environment, by dragging and dropping special nodes onto the KNIME workbench.
- Deploy to KNIME Server & share your data app either via a secure WebPortal or via a shareable, embeddable link.
- Share with 5, 10, or 1000 end users.
- Finally, monitor and easily tweak based on feedback.
This KNIME feature reduces the time to create data apps from months to days. The result brings insights faster to the organization and eliminates frustration and blockers for the data experts. Most importantly, it’s finally lowering the wall between business and data science teams.
The first step toward professionalizing data science
Data scientists have all the tools they need to create data science: to ingest and clean data, to blend, to explore, and to analyze and, in some cases, make predictions based on data. These capabilities, to some degree, have existed for several decades.
The hard part is scaling.
To effectively support a “data driven” business, data scientists must move beyond one-time predictions or analyses. They need a way to package up their findings and share them with humans and machines. To this end, the KNIME platform supports the data expert through every step of the creation and productionization process.