
As global supply chains continue to be unpredictable, companies face a growing need to be ahead of the game, ready to tackle risks and opportunities. A fundamental step in this process is the automation of predictive and analytical tasks.
Consider the following situation: there is a logistics problem that needs to be solved quickly to prevent stockout, and the person who understands it the most is Kate, the supply chain manager. Since she has the most knowledge about the problem, and is also the most keen to apply an automated solution to solve it (and keep solving it), it would be great if she could create a solution on her own, with as much independence as possible.
Easy access to self-service analytics without reliance on IT gives supply chain managers across warehousing, logistics, inventory management, demand management and operations the insight they need to solve supply chain problems faster. The ability to perform and automate complex analyses such as demand forecasting and inventory optimization helps minimize the impact of supply chain disruptions.
But Kate is held back by a perception that she needs coding expertise to do this.
How a Low-Code Analytics Tool is the Perfect Match for Supply Chain Experts
A low-code approach is very well suited for supply chain teams because it removes barriers related to coding. It enables domain experts with different backgrounds to create and test solutions that leverage their specialization effectively. Low-code/no-code tools offer the flexibility practitioners need to change and edit their calculations on-the-fly, and check results on a step-by-step basis. And with minimum dependence on IT for analytical support, the supply chain expert will be able to run complex analyses on demand.
KNIME for Supply Chain Management
KNIME Analytics Platform is a no-code/low-code that not only empowers practitioners with different backgrounds, but also allows them to get a good picture of supply chains by providing access to 300+ data sources, which can include relevant purchase, order, and external supplier datasets, for example. KNIME also facilitates integration with other existing platforms (e.g., Tableau, PowerBI) and programming languages (e.g., Python, R), which comes in handy if you want to re-use what you had already built for your supply chain analytics. To learn more about how KNIME can be used for supply chain, check our list of blog posts on the topic.
Here, we focus on solutions for common supply chain use cases built with KNIME Analytics Platform. They are collected in the Supply Chain space on KNIME Community Hub, and you can download and adapt them as you see fit. In this article we give an overview of the use cases, and describe their corresponding solutions and the insights they bring.
Note. This solution repository has been designed, implemented, and maintained by a mixed team of KNIME users from the KNIME offices in Germany and supply chain experts from the Indian Institute of Management Sambalpur (IIM Sambalpur) in Sambalpur, India.
1. Inventory valuation
Supply chain in a company can be disrupted completely if the inventory valuation is too high or too low. Inventory valuation is an inventory optimization technique used by accounting and supply chain executives to keep track of total value of inventory. It is essentially carried out on unsold inventory, and is imperative for the sound organization of financial statements and better inventory management. Cash flow projections and a company's financial health is largely dependent on inventory valuation as well.
The supply chain manager needs to ensure that the inventory value is adequately balanced with
- Fast moving vs slow moving stock-keeping units (SKUs)
- Critical vs non-critical SKUs
- High value vs low value SKUs
- Long lead time vs short lead time SKUs
This valuation involves all the costs incurred in creating a product and maintaining it in the inventory. In this use case, we designed a dashboard in KNIME which monitors trends in inventory valuation at the end of a given month (see Figure 1). This dashboard lets users change KPI values according to the locations selected. There are two charts included in this dashboard: one is a line chart showing trends in inventory valuation for each year, and the other is a bar chart showing deviations in inventory valuation for a few years on a monthly basis.
Download the Inventory Valuation workflow from KNIME Community Hub
Try out the data app yourself on the community server
Get a walk-through of this workflow in the article, Monitor inventory valuation trends with KNIME
2. Stockout analysis
Stockout happens when you run out of a particular item. Managing them is one of the most stressful activities in the supply chain. If improperly managed, stockouts can cause customers to churn. Understanding the reasons behind stockouts is critical to make sure that they do not happen in the future. RCA (Root Cause Analysis) helps understand and prevent underlying causes for stockouts.
In this use case, we start with the "what has happened?" question. By using interactive charts, users can analyze the trends not only at an overall level but also slide and dice by different types of materials. A data app built with KNIME allows users to visualize these trends with line charts (see Figure 2). Users can also interact with the data app by choosing different warehouse locations for selective observation of trends.
Download the Stockout Analysis workflow from KNIME Community Hub
Try out the data app yourself on the community server
Get a walk-through of this workflow in the article, Avoid empty shelves with stockout analysis in KNIME
3. Cycle time visualization
Cycle times are critical to managing suppliers, deliveries and customer order fulfillment. Cycle time visibility affects multiple supply chain functions, such as demand forecasting, inventory levels, order fill rates, and warehouse capacity management.
This use case shows how to build a data app to manage and track cycle times. We not only look at overall cycle times, but also break them down into subcomponents to understand where the biggest bottleneck is. The data app contains two views: the first one is an interactive chart that lets users make selections for overall cycle time; the second one carries forward the selections from the first view and conveys the breakdown of their cycle times (see Figure 3).
Download the Cycle Time Visualization workflow from KNIME Community Hub
Try out the data app yourself on the community server
Get a walk-through of this workflow in the article, Measure cycle time in KNIME & assess supply chain efficiency
4. ABC Analysis – 1 (Basic + Demand Uncertainty)
ABC Analysis is a numerical technique to enable better decision making regarding inventory. It classifies inventory items into categories A, B, and C, where category A contains items which bring in critical sales going down to category C with the least critical sales in order.
The concept of ABC analysis is built upon Pareto’s 80/20 rule, meaning that 80% of sales come from just 20% of the products. In this use case, ABC analysis is implemented with two approaches:
-
Basic classification of items into categories A, B and C based on thresholds for sales percentages.
-
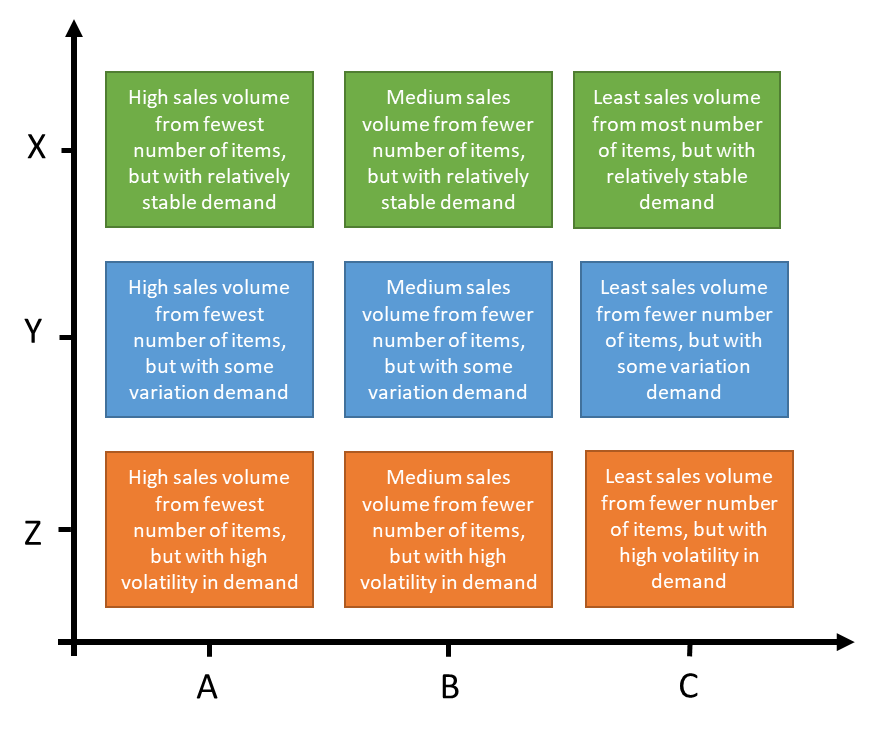
Classification of items based on another criterion along with ABC, called uncertainty in demand (XYZ analysis). This criterion is measured by computing the coefficient of variability on the sales of items, and then assigning classification thresholds for classes X, Y and Z.
Download the workflows described here from the KNIME Community Hub: ABC Analysis with the Naive Approach and ABC Analysis Factoring in Demand Uncertainty.
Read a walk-through of these workflows in the article, How to do ABC analysis in KNIME.
Figure 4 details the relationships between classes A, B, and C and classes X, Y, and Z.
5. ABC Analysis – 2 (Deriving Inventory KPIs from ABC Analysis)
ABC Analysis can be used to calculate critical Inventory KPIs, such as:
- Safety Stock to mitigate the risk of unexpected variations in demand, or supply chain delays;
-
Reorder Point to avoid stockouts – especially for critical items
-
Economic Order Quantity (EOQ) to describes how many units must be ordered every time an order has to be placed.
This workflow does not contain visualizations, but can be used as a foundation for the construction of dashboards that allow users to interact with these KPIs in order to better manage inventory.
Download the workflow to calculate Inventory Management KPIs from KNIME Community Hub.
Low-Code Tool Empowers Supply Chain Experts
A team of KNIME users from industry and academia has developed and is maintaining low code workflows for the use cases discussed in this blog post. These workflows are example solutions to common problems in supply chain, and can be downloaded, adapted and customized by any practitioner in this field depending on the data they have at hand and on their requirements.