
Supply chains are efficient when processes are completed in the minimum time possible. Cycle time is a vital measure to assess supply chain efficiency.
It’s the time it takes for a process to be completed and it describes the different steps of a product within a supply chain. Production cycle time is the time it takes to manufacture a product; order processing cycle time is the time required to process a product order; cash-to-cash cycle time is the time that elapses before receiving the financial gain for a product.
Monitor cycle time from purchase request to delivery
In our example today, a company measures the total time that elapses from Purchase Requisition (PR) to Purchase Order (PO) creation, and submission of the PO through to the delivery made by the supplier. This involves different steps.
PR is the purchase request created by the department listing the products it needs to buy. This step goes through a series of approvals from internal leads and various departments such as administration, financing, security, etc.
After the PR is generated it is sent to the purchasing department to place the order with its listed supplier. This step involves gathering quotations from multiple vendors and the best one is selected. It also includes terms of payment and delivery to be fulfilled by the vendor.
Once a supplier is internally approved to buy from, a purchase order is generated and submitted to the supplier, who sets about fulfilling it, and delivering it to the warehouse (WH).
The head of the supply chain department needs a dashboard to visualize both the trend of cycle time for each process – separately and combined.
These processes are purchase requisition to purchase order generation (PR to PO) and purchase order submission to the supplier until the delivery is made to the warehouse (PO to WH).
The KPI the supply chain manager wants to observe specifically is the average cycle time in days for the selected departments. This average is calculated as follows:

If average cycle time for each process is to be calculated then the numerator in the formula above can be replaced by the time elapsed for that specific process to complete. Average cycle time can be measured in any unit of time based on the model of business. Mainly it is measured in days or hours. In this case, it is measured in days. The optimal KPI therefore should be as low as possible. Hence, the average cycle time between 1 or 2 days or even less is considered optimal.
A dashboard to visualize KPI trends
This company keeps track of the number of POs generated by different departments each month. Time taken in the creation of PO and its fulfillment which is essentially the delivery received against it is recorded. The Cycle Time of each process is grouped along with the number of POs generated for each month and department.
The dashboard below works in a twofold fashion: it shows the aggregated KPI value for both cycle times and average cycle time for separate processes.
Both charts visualize the KPI trends for all available months based on the selection of departments.
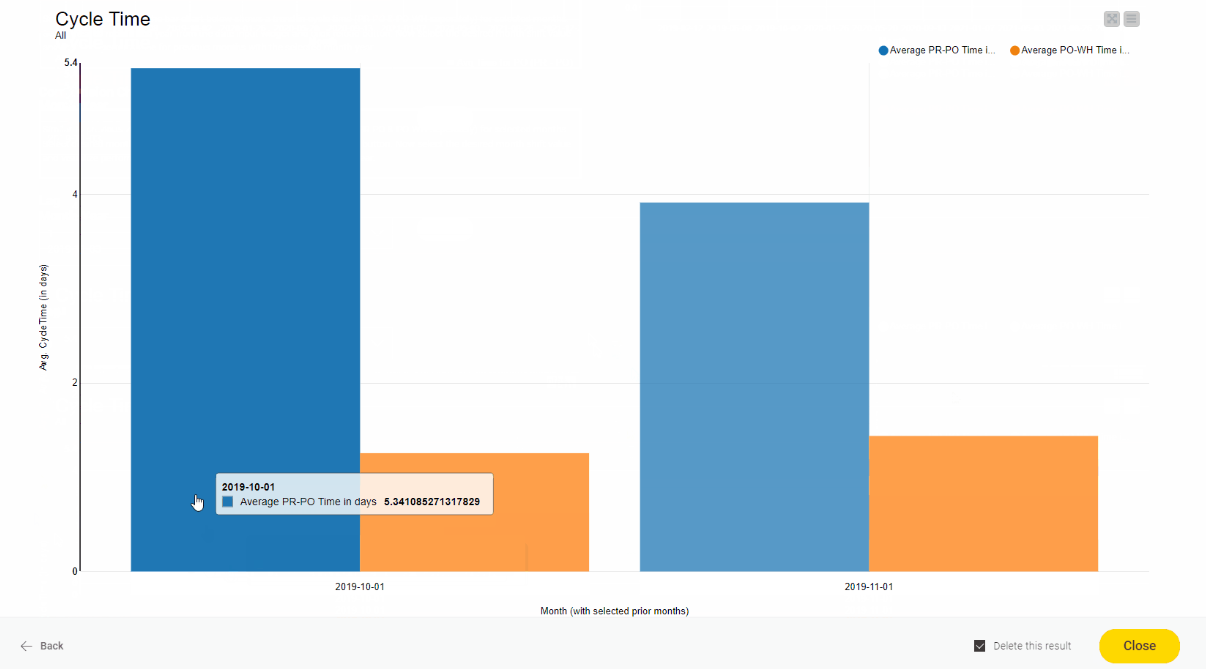
Month-to-month comparisons can also be made with a bar chart based on the selected month and corresponding month shift in the past (Fig.2). The selection of this shift is limited to a maximum number of 10 months. To monitor the volume of POs created, an additional line plot is added which visualizes this trend for selected departments. (Fig. 2).
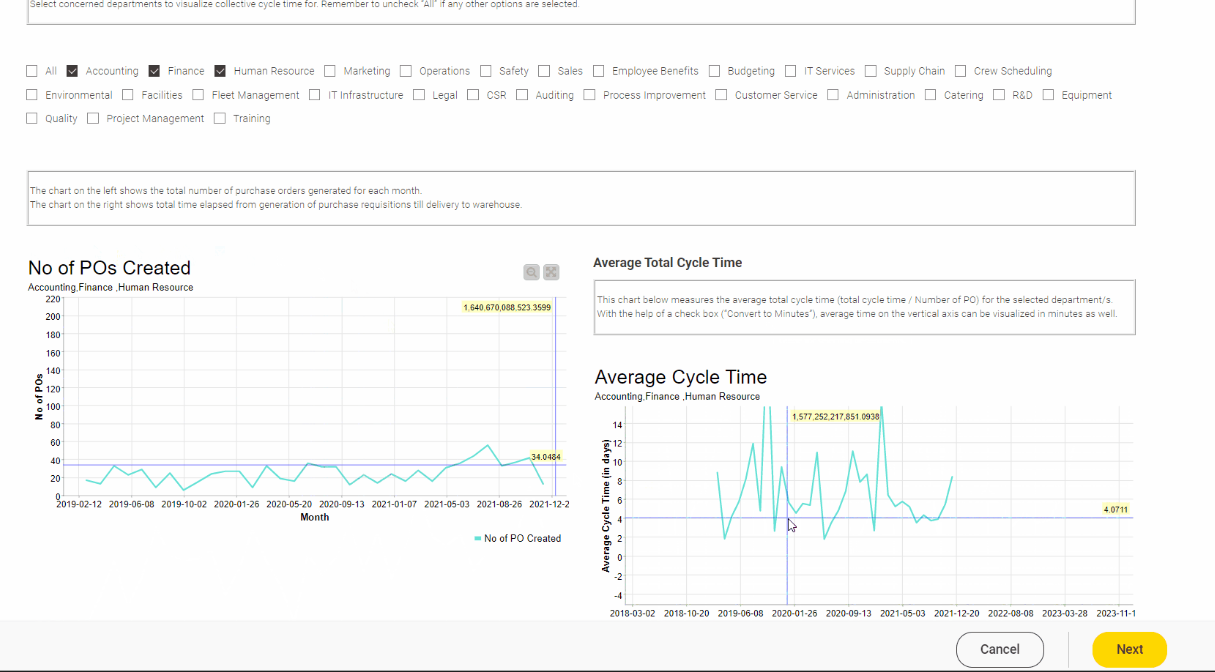
Similarly, the second part of the dashboard shows the average cycle time from PR - PO, and PO - WH in two different line plots (Fig. 3). The month-to-month comparison chart can also be seen in a grouped bar chart for each individual process (Fig. 3). As it can be seen from the bar chart, the length of the bar for PR - PO is bigger than the length of the bar for PO - WH. This tells us that more time is spent on purchase order generation than the fulfillment of purchase orders by the supplier.
Note. Multiple KPIs exist for measuring cycle time, with each one adapted to different supply chain processes. For example,
- Cash-to-cash cycle time = inventory outstanding time + sales outstanding time - payable outstanding time
- Order processing cycle time = delivery time - purchase order (PO) generation time
- Supply chain cycle time = time taken to receive supplies + order fulfillment time (this is basically, the sum of all lead times)
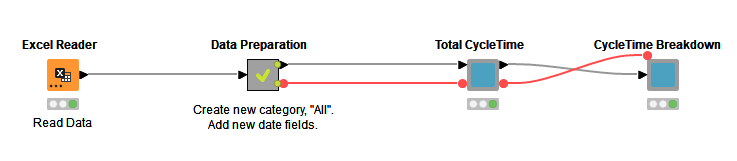
The entire workflow can be encapsulated in one node and three components. The aggregated KPI for total cycle time is enclosed within the “Total Cycle Time” view component and separated KPI can be viewed in the “CycleTime Breakdown” component (Fig.4).
Note. Download this workflow from KNIME Community Hub and browse adjust it to your own use case
Find and share supply chain solutions on KNIME Community Hub
Browse KNIME Community Hub to find more workflows for supply chain use cases uploaded and shared by the community.