In December ‘24, another season of Just KNIME It!, our series of weekly challenges on data analytics and data science, came to a close. Upon evaluation, we are thrilled to announce our third generation of Just KNIME It! (or JKI) KNinjas: incredible members of our community who have solved all of season 3’s challenges.
What is Just KNIME It!?
In case you are wondering what Just KNIME It! is, let’s quickly clarify it first.
Just KNIME It! is a program of weekly data challenges that started in 2022. Its main goal is educational: the puzzles help our community members improve their analytics, data science, and AI skills. Every season, we release one challenge per week, with difficulties ranging from easy to hard, touching on a variety of topics. By the end of each season, we evaluate the solutions from the users at the top of the JKI leaderboard, and then identify and award a group of JKI KNinjas.
You can read more about previous cohorts of KNinjas here (season 1) and here (season 2).
Just KNIME It! – Season 3 on AI, data apps, and dashboards
In our third season, we covered many topics in analytics, data science, and artificial intelligence, often focusing on the creation of data apps and dashboards to communicate insights. Like in season 2, we published 30 challenges following the same structure: one new problem each week, followed by one week for our community to solve it before we published our own solution. Solutions were uploaded onto the public KNIME Community Hub spaces with the tag JKISeason3-xx, where xx was the number of the challenge.
By the end of the season, we counted the challenges’ tags and ranked users on our leaderboard to reveal ten participants at the top who solved all the challenges!
The Just KNIME It! Season Three KNinjas Are...
- Anil Kumar Sharma: Investigating Pokémon types with API interactions and customized visualizations
- Bertold Balázs: Finding patterns in pizza toppings with GenAI
- Kazuya Osumi: Explaining cancer predictions with AutoML
- Martin Dieste: Testing different techniques to visualize historical soccer data
- Naoyoshi Yamamoto: Combining API interaction, PDF parsing, and statistics skills to identify fraudulent contracts
- Reinhold Breckner: The use of offensive language towards the LGBTQIA+ community in different countries
- Ryushi Seo: Creating a customized dashboard for CO₂ emissions
- Takanobu Araki: Uncovering rare pizza toppings with association rule mining
- Toshiyuki Ohfusa: Pushing for maximum efficiency while removing redundant folder references
- Yasue Katsutaka: Solving a Formula 1 challenge with the help of K-AI
- Yuki Mizukami: Forecasting and visualizing trends in stock prices
Anil Kumar Sharma: Investigating Pokémon types with API interactions and customized visualizations
(KNIME Forum: AnilKS, X: anilsharma2910)
Anil is our first user to be nominated a top KNinja three times! That is, he’s been a KNinja since our first season. Anil is the deputy general manager of purchasing at Dabur India Limited, where he usually deals with large amounts of structured and unstructured data. He’s also responsible for the execution and assessment supply management processes. Anil’s workflows have consistently been efficient and concise, and his contributions to our community have even made him a Contributor of the Month (COTM) in 2023.
Featured Just KNIME It! Challenge
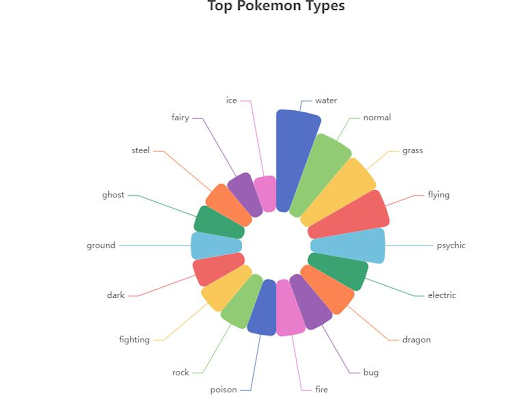
Anil’s solutions receive a lot of positive feedback in the KNIME Forum, where he posts his workflows and often provides feedback to other participants. Challenge 21 was a data puzzle on Pokémon types, involving REST APIs and data visualization, and Anil’s solution was particularly insightful. He cleverly uses a recursive loop to make sure that his GET request to a Pokémon API returns all the necessary information for him to determine what Pokémon types are the most common. Next, with some data wrangling, he isolates the Pokémons’ names and types, and finishes his solution with a customized, very good-looking pie chart!
Bertold Balázs: Finding patterns in pizza toppings with GenAI
(KNIME Forum: berti093, LinkedIn: Bertold Balázs)
Bertold, who works as a management consultant in Hungary, is not new to JKI. In fact, he’s been participating in our weekly challenges for quite some time, and was nominated as a KNinja at the end of season 2 as well. Despite being a seasoned participant, he keeps learning new concepts with the Just KNIME It! challenges, such as how to incorporate GenAI techniques to tackle a larger pool of problems efficiently. Long live this KNinja!
Featured Just KNIME It! Challenge
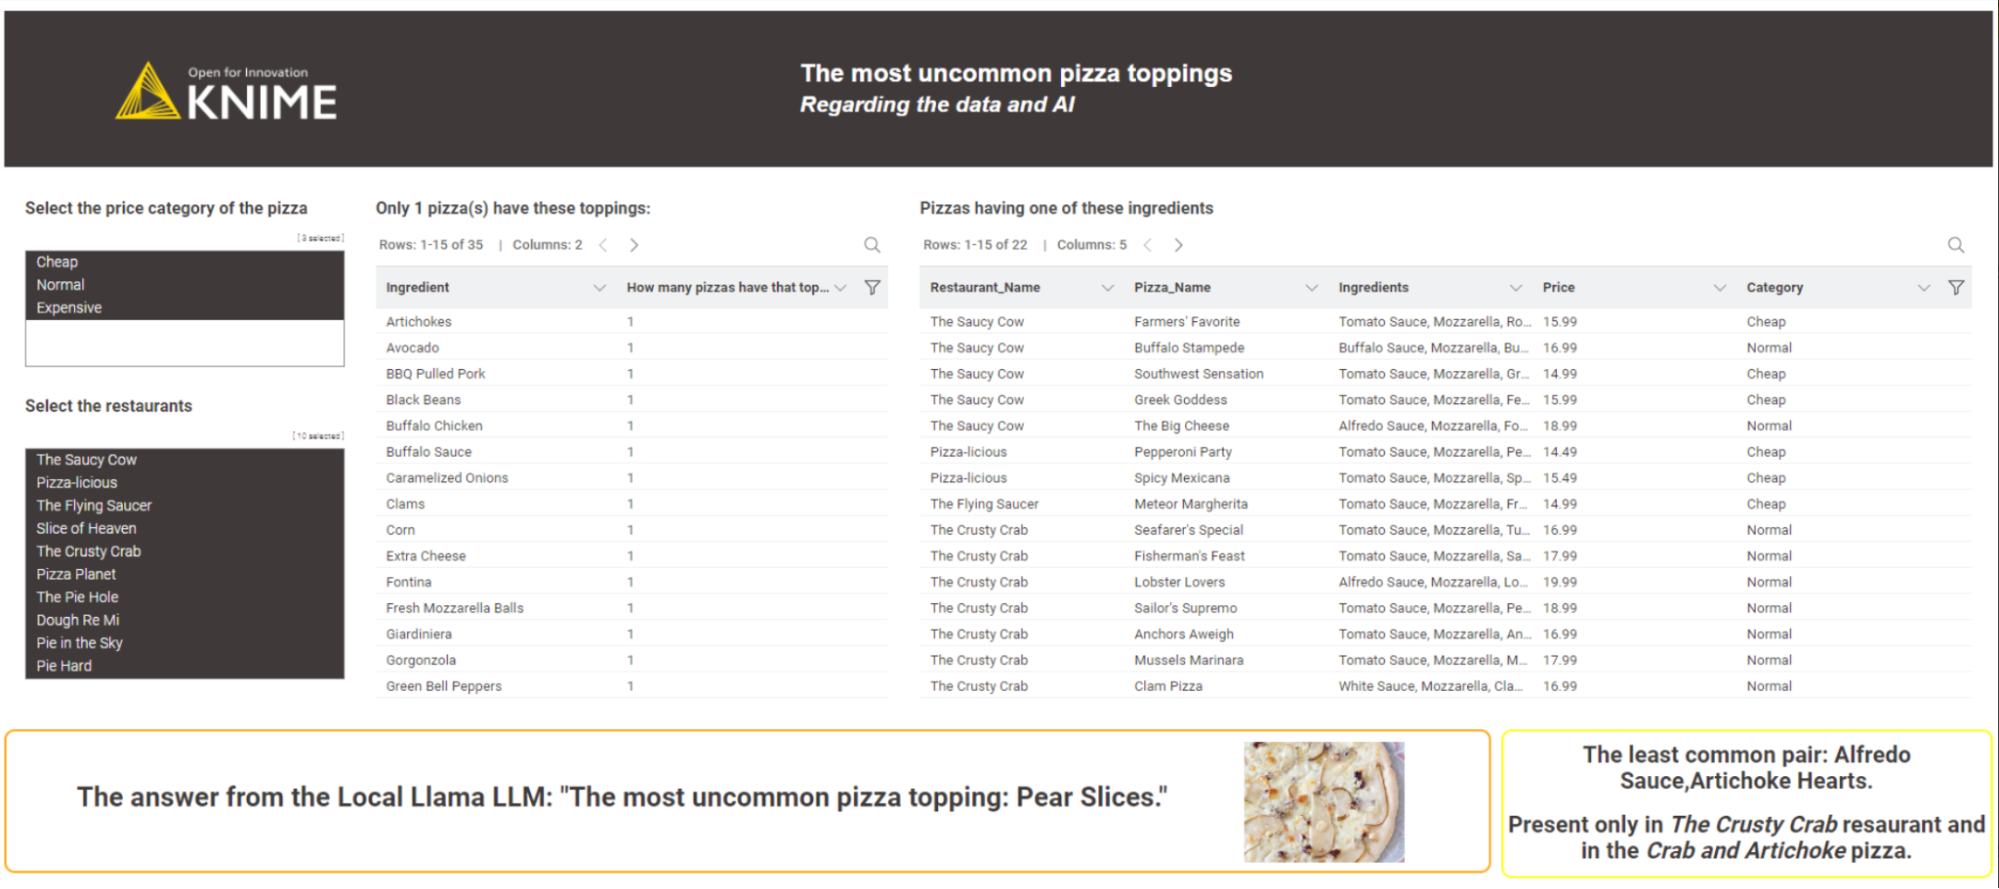
There are so many great challenge solutions by Bertold in KNIME Community Hub that it was hard to pick one to showcase his work. Luckily, he suggested his favorite one to us: Challenge 26 – the one on pizza toppings. Instead of relying on association rule learning, which is a more classic way of tackling this type of problem, this KNinja integrated GenAI into his workflow to get the most uncommon combinations of toppings present in the dataset. Next, he created a very well-formatted dashboard (a mark of many of Bertold’s solutions!) to showcase his findings.
The mix of creativity and technical problem-solving made this challenge especially rewarding for Bertold.
Kazuya Osumi: Explaining cancer predictions with AutoML
(KNIME Forum: Sykz)
Kazuya works as a medicinal chemist doing research on drug discovery in Japan. What a stellar cohort of data masters in pharmacy do we have! Besides conducting research as a laboratory chemist, this KNinja focuses on promoting data utilization and improving research efficiency through the application of AI.
Before Just KNIME It!’s latest season, Kazuya was not very proficient in machine learning: this totally changed over time, challenge after challenge, and he can now proudly say that the knowledge he gained in this field directly applies to his work.
Kazuya also learned how to create KNIME dashboards and components over time, submitting solutions that were increasingly more polished throughout the season.
Featured Just KNIME It! Challenge
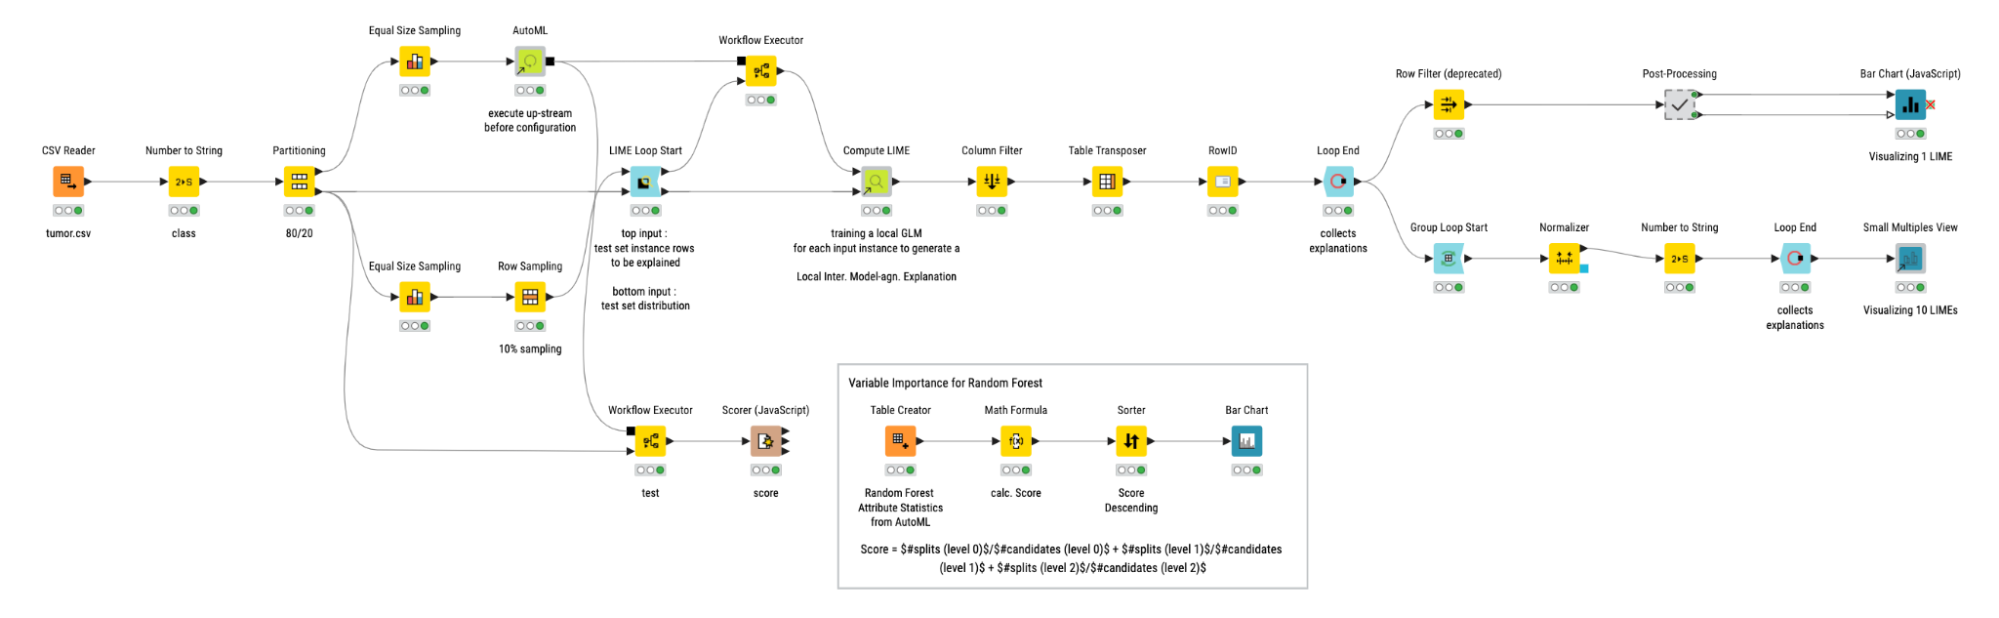
One of the top skills that Kazuya acquired with Just KNIME It! has to do with explainable AI. Challenge 18, which addressed explainable cancer predictions, was his favorite, and the first time he dove into the universe of LIME.
This challenge also marked his first take on AutoML: he used it to identify the best model, with the best parameter values, for cancer predictions.
Martin Dieste: Testing different techniques to visualize historical soccer data
(KNIME Forum: MartinDDDD, LinkedIn: Martin Dieste)
Martin, who was also awarded as COTM in November 2024, runs a consultancy firm where he provides no-code / low-code solutions to his clients with KNIME. His contributions to our community are thorough and varied, including an AI extension, an ongoing Youtube video series, and Medium journal articles.
Martin is very generous with his knowledge and is always helping users in the KNIME Forum – not only in threads related to Just KNIME It!, by the way. We are beyond thankful for the effort he puts in upskilling our entire community!
Featured Just KNIME It! Challenge
Week after week in our last season, you could count on Martin to post an interesting solution to our challenges in the KNIME Forum. He told us that he upgraded his UI and UX skills through our data puzzles, building insightful dashboards that were also helpful in his day-to-day work.
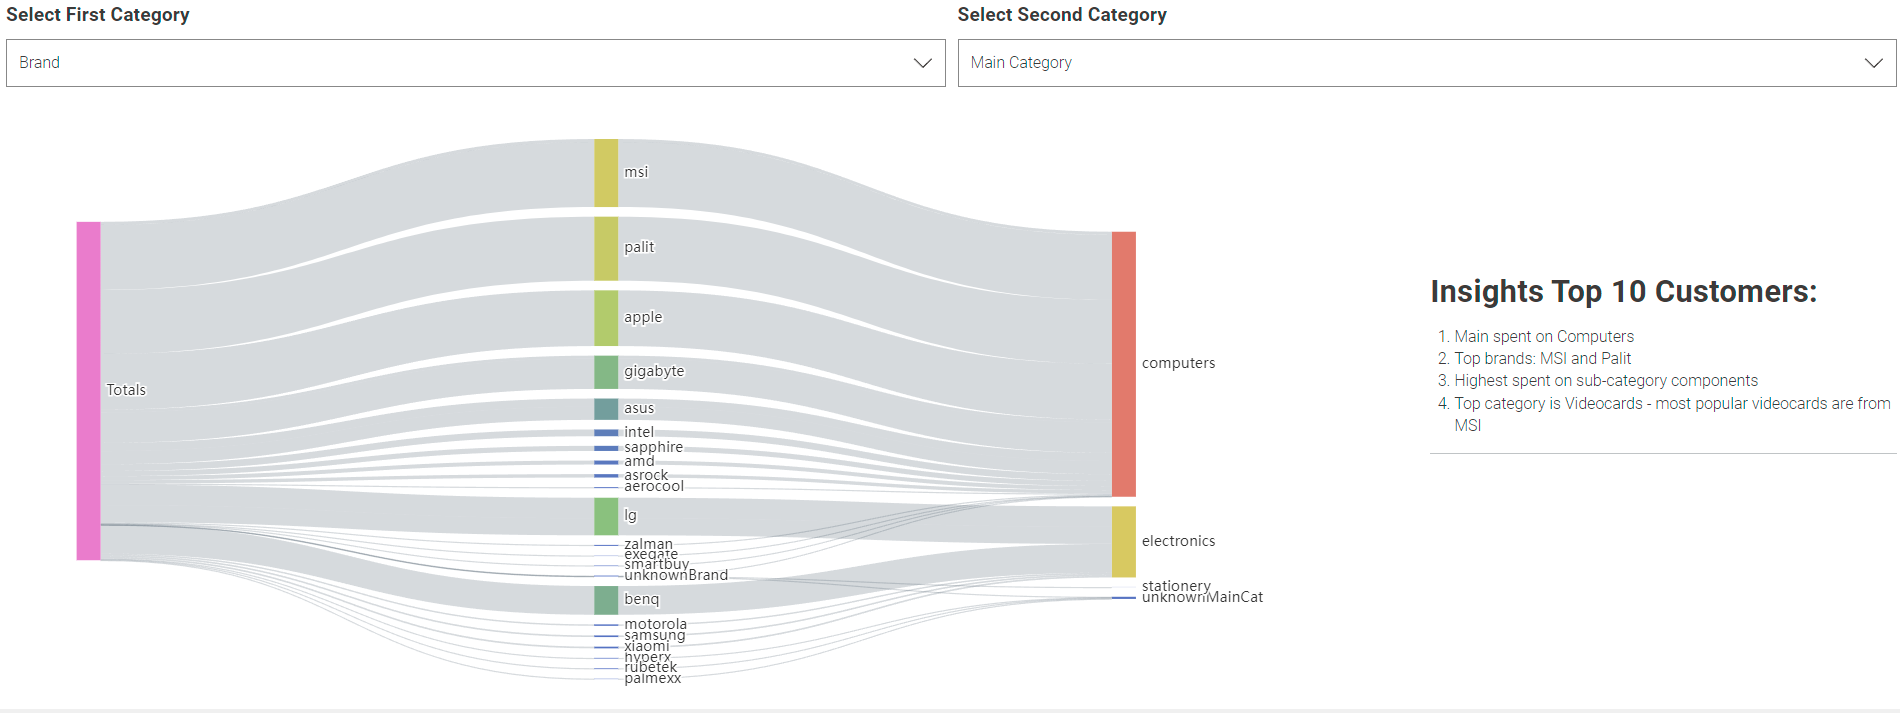
To showcase his contributions, we chose his solution to Challenge 22, in which we asked the participants to create analytics dashboards for e-commerce.
With the help of the Generic ECharts View node, Martin created:
- A funnel chart representing the different steps in consumers’ journeys
- A Sankey Diagram to uncover the expenditure of top customers.
Martin is a fan of building visualizations, and of the Sankey Diagram in particular – he thinks this graph is underused in business contexts.
We are happy that, with KNIME, this KNinja can build his favorite graphs the low-code way!
Naoyoshi Yamamoto: Combining API interaction, PDF parsing, and statistics skills to identify fraudulent contracts
(KNIME Forum: tyousuke, X: obito_od)
Naoyoshi, who also works in drug discovery research, is one of the three KNinjas in our latest cohort who had already been nominated KNinja in the past. We really appreciate it when great participants come back to our challenges season after season, sharpening different data skills every time!
Naoyoshi told us that he definitely learned new concepts in Just KNIME It! season 3: for example, he mastered the retrieval of data from web sources using REST endpoints.
This KNinja is very committed to spreading knowledge around data, teaching beginners how to use KNIME and sharing his own techniques and experiences along the way. He feels inspired and motivated by their enthusiasm, which really shows in the quality of his solutions.
Featured Just KNIME It! Challenge
Naoyoshi told us that Challenge 21 was one of his favorites in season 3 because it was themed around Pokémon – a topic that deeply resonates with Japanese culture.
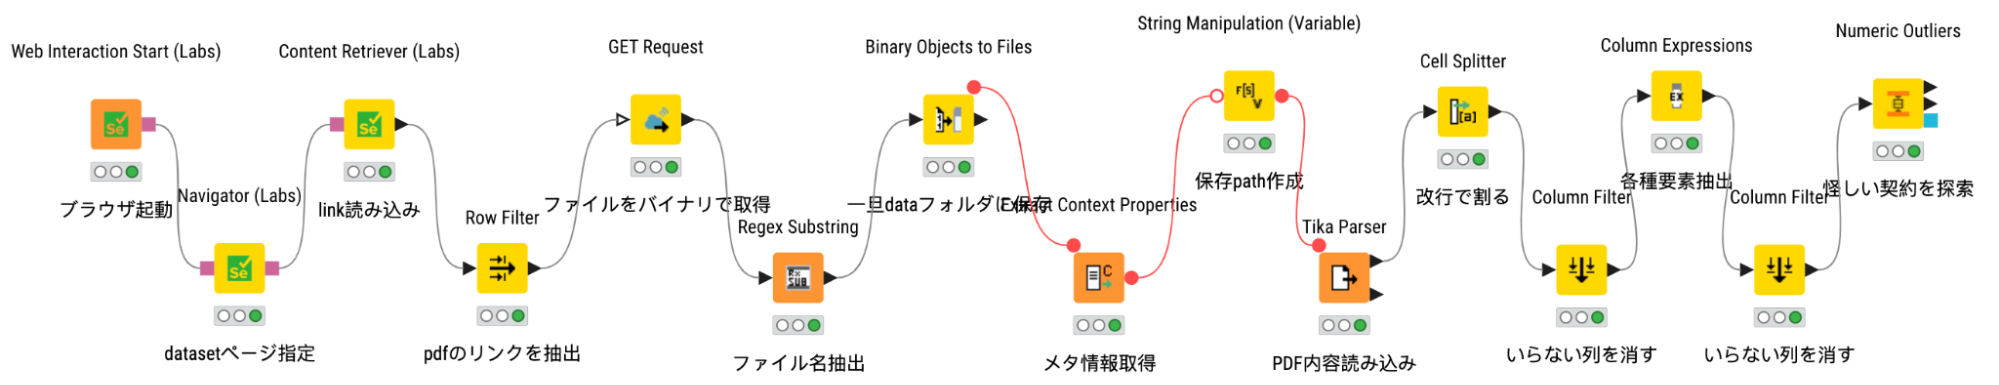
However, the challenge that best highlights his newly acquired skills is probably Challenge 13: not only did he sharpen his REST API knowledge, but he also had to parse PDF files, something he usually does not have the chance to do.
Reinhold Breckner: The use of offensive language towards the LGBTQIA+ community in different countries
(KNIME Forum: RBre)
Reinhold, a process engineer working in R&D in Germany, made a mark in the KNIME Forum in 2024 with his solutions to Just KNIME It! Challenges. This was his first season as a participant, and it is impressive to see how he rose to the top and became a KNinja in only a matter of months.
This data master uses KNIME for data and database processing, and also for other tasks related to engineering and polynomial regression.
He’s not only new to Just KNIME It!, but to data science in general: he started to focus on it professionally only two years ago, migrating from VBA and Excel to KNIME once he started to work with larger amounts of data.
It is really impressive to see how far his dedication to acquiring new data skills took him: our challenges cover many topics, and Reinhold did not shy away from any of the puzzles!
Featured Just KNIME It! Challenge
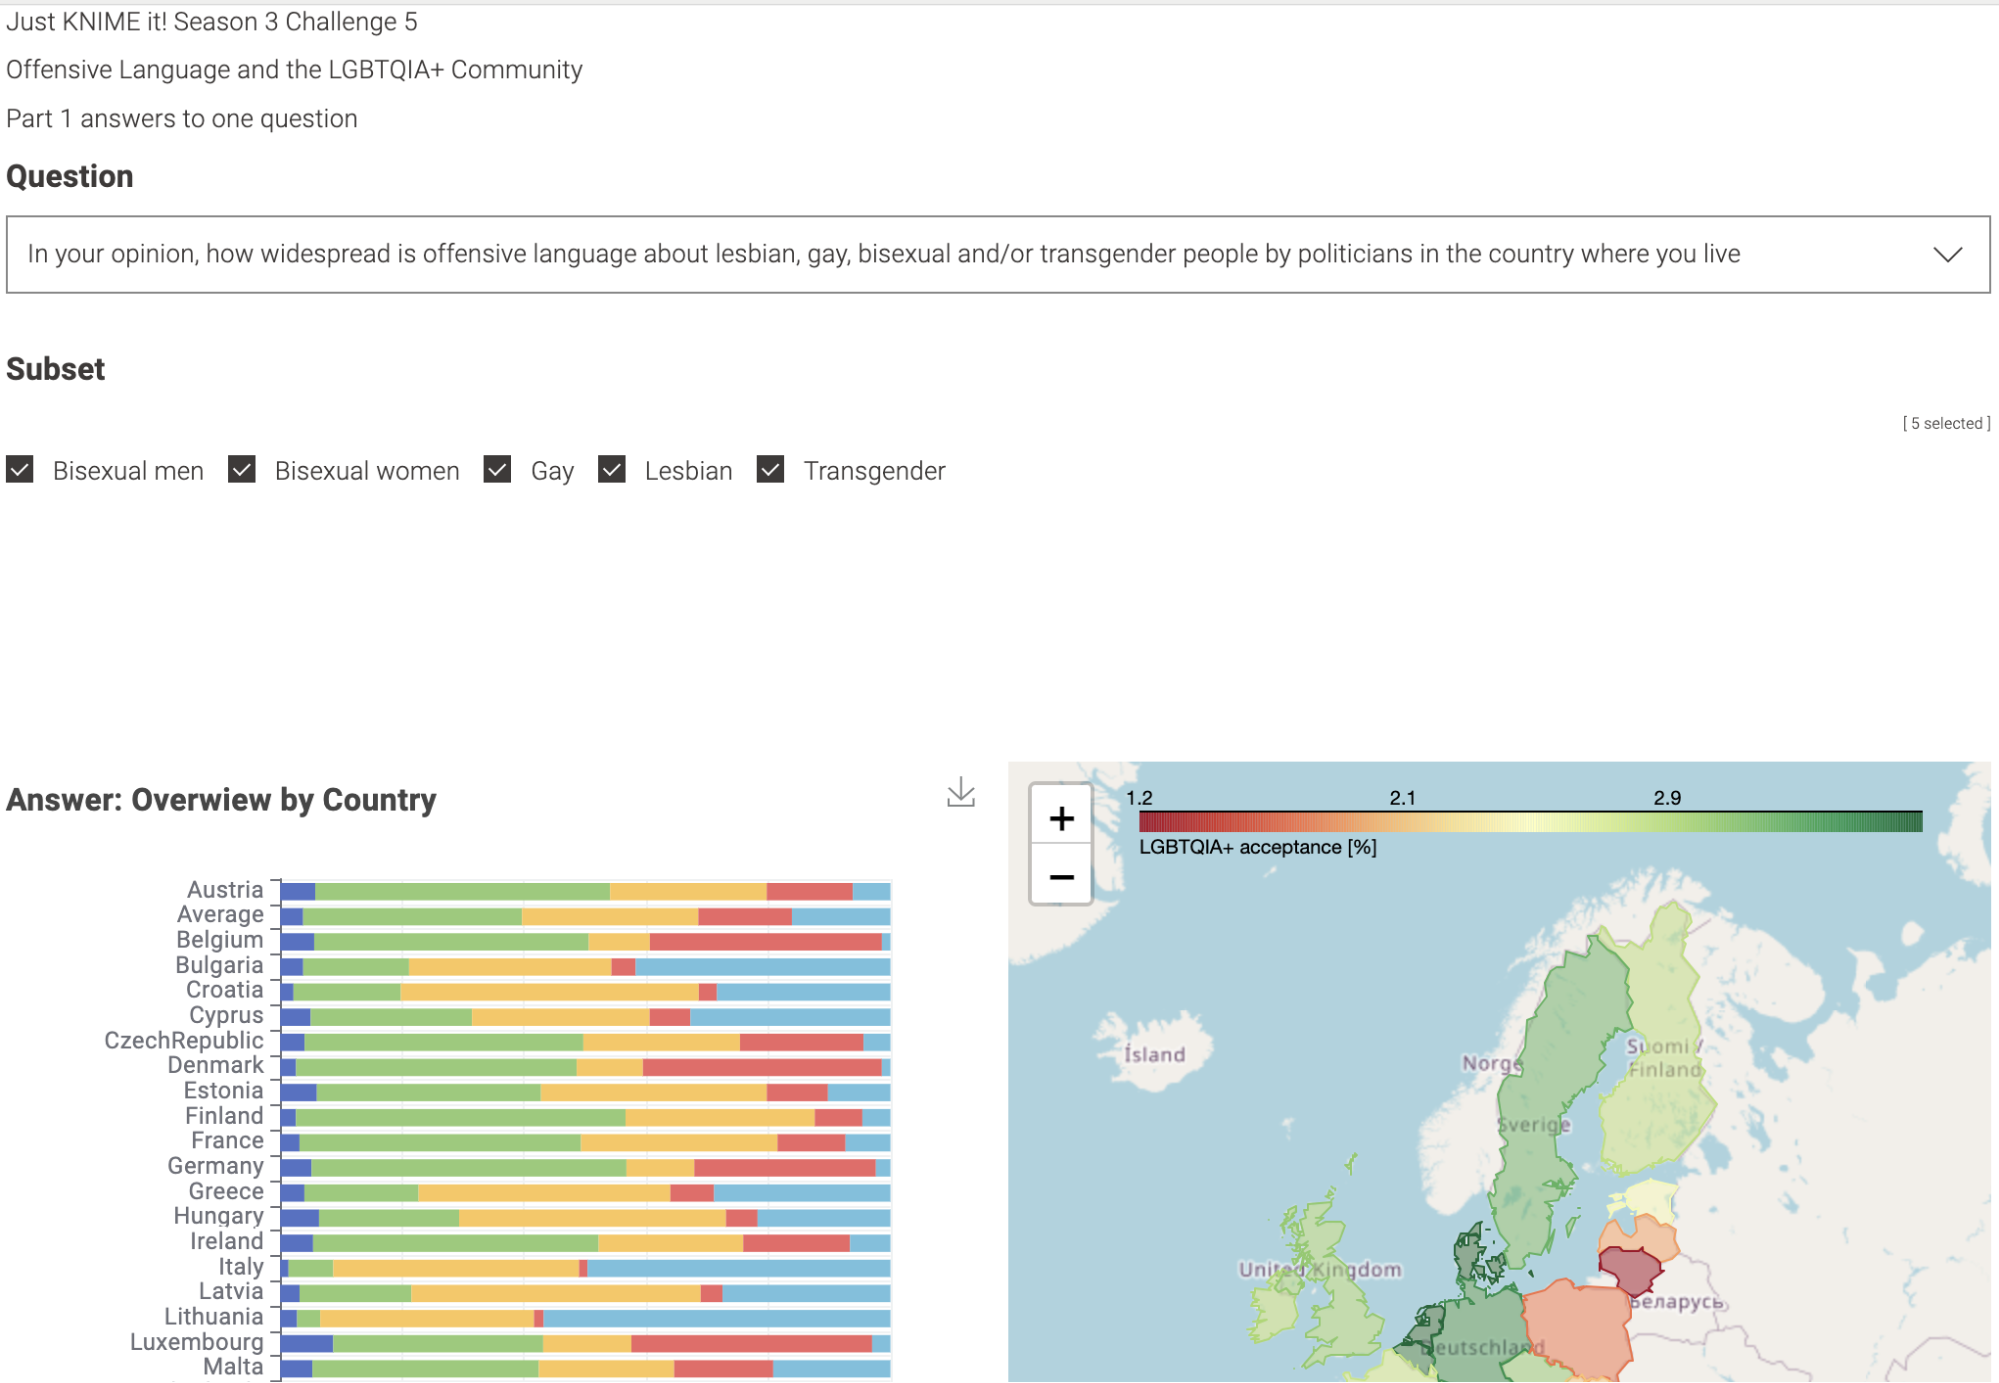
To showcase Reinhold’s work, we chose his solution to Challenge 5. This KNinja built a complete data app that allows people to investigate the use of offensive language against LGBTQIA+ people in many different European countries, separated by different segments of this population.
Mapping answers to the question "In your opinion, how widespread is offensive language towards lesbian, gay, bisexual, and/or transgender people by politicians in the country where you live?” into numbers from 1 to 10, and also exploring geospatial maps, Reinhold uncovered important sociopolitical insights visually.
This challenge is a perfect example of how mighty data science with KNIME is, as you can visualize data to get deep into a totally new topic really fast.
Reinhold Breckner
Ryushi Seo: Creating a customized dashboard for CO₂ emissions
(KNIME Forum: sryu, LinkedIn: Ryushi Seo)
For the second time in a row, Ryushi completed all Just KNIME It! challenges in a season and got nominated as a KNinja.
This product engineering manager, who also works on drug discovery, was also part of Team AST: the brilliant trio that won the first season of Game of Nodes in 2024.
This KNinja is famous for his very polished data apps. If you speak Japanese, do not miss out on Ryushi’s video talking about Game of Nodes and his experience in a KNIME Data Talks event.
Featured Just KNIME It! Challenge
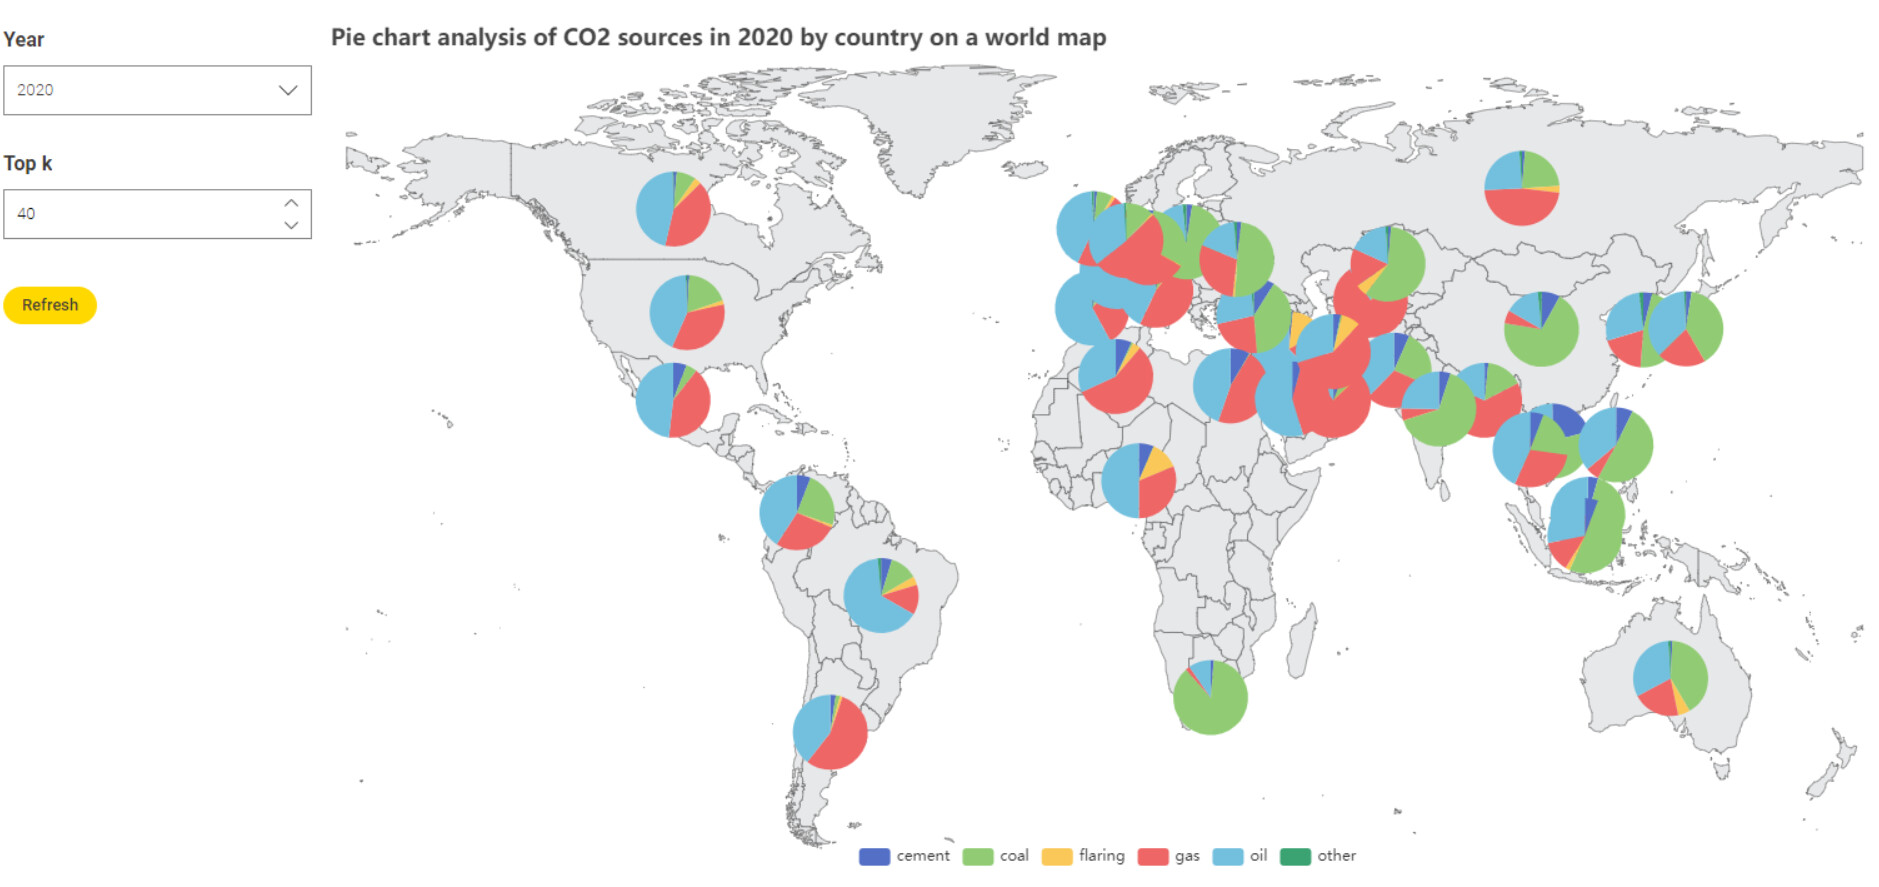
Ryushi is a fan of the Generic ECharts View node, and used it a lot this season to customize his data apps, making them even shinier.
An example can be seen in his solution to Challenge 2: he created an elaborate graph by superposing pie charts over a world map, detailing how the distribution of CO₂ emissions varies per region and per source (e.g., coal). The visualization is clean, interactive, and informative.
Takanobu Araki: Uncovering rare pizza toppings with association rule mining
(KNIME Forum: tark, LinkedIn: Takanobu Araki)
Takanobu works with medicinal chemistry, creating KNIME-based systems to support drug discovery. Besides using KNIME for data processing and integration, as well as cheminformatics, this KNinja provides support to KNIME users in his company.
Takanobu is active in the KNIME Forum, often discussing strategies for challenges and answering questions that other participants have. This KNinja was also part of Team AST, which took the gold in our first Game of Nodes season: an incredible feat and uncontestable proof of his KNIME skills.
Featured Just KNIME It! Challenge
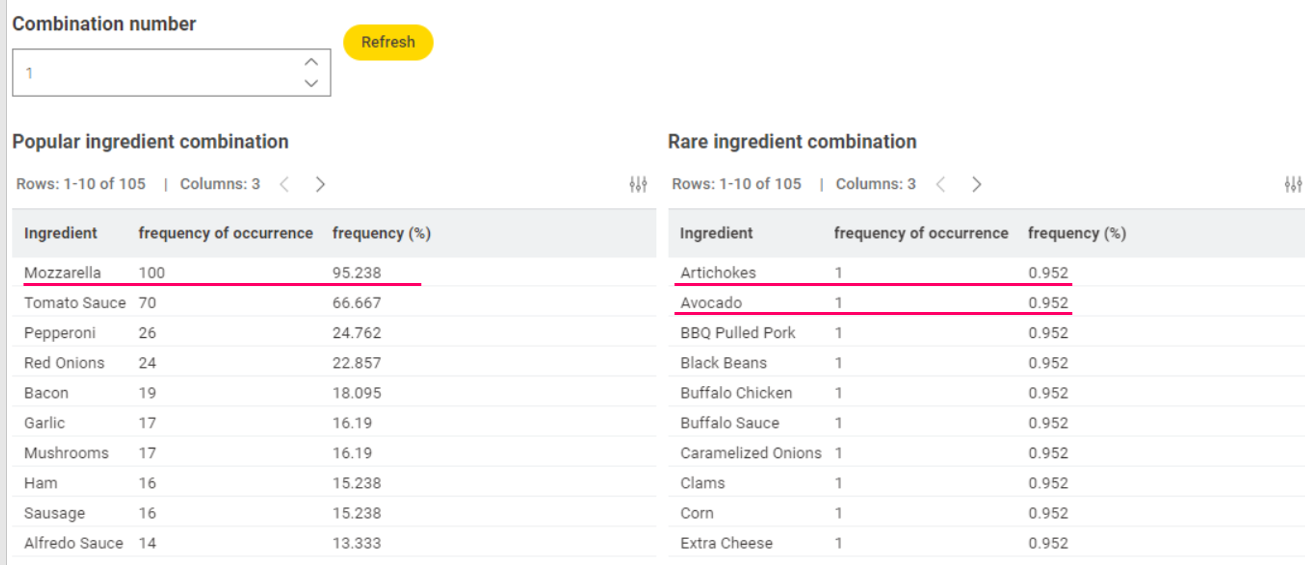
Takanobu had the most fun with a puzzle on pizza toppings (Challenge 26): he created a workflow to output popular and rare topping combinations for a variety of combination numbers, with association rule learning at its core.
One of his most baffling finds? A topping combination involving honey, pear, and walnuts!
Toshiyuki Ohfusa: Pushing for maximum efficiency while removing redundant folder references
(KNIME Forum: Tofusa, LinkedIn: Toshiyuki Ohfusa)
Toshiyuki is a KNIME expert: he started submitting a few solutions to Just KNIME It! during our second season, then won our first round of Game of Nodes as part of Team AST, and climbed up to Just KNIME It! KNinja after completing all of our challenges in season 3.
Toshiyuki works as a data scientist for a pharmaceutical company, focusing on how to discover new drugs faster with research data. After a year of intense KNIME use, this KNinja told us that, while learning more about individual nodes was great, the most important thing for him was to get into the habit of working with data on a daily basis.
His super efficient and clever workflows are proof that his consistency has paid off.
Featured Just KNIME It! Challenge
Toshiyuki’s solutions stand out for their efficiency and conciseness, often comprising a small number of nodes and components, compactly documented.
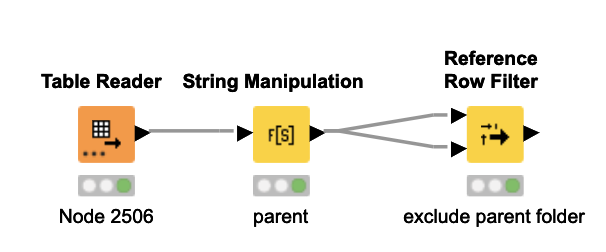
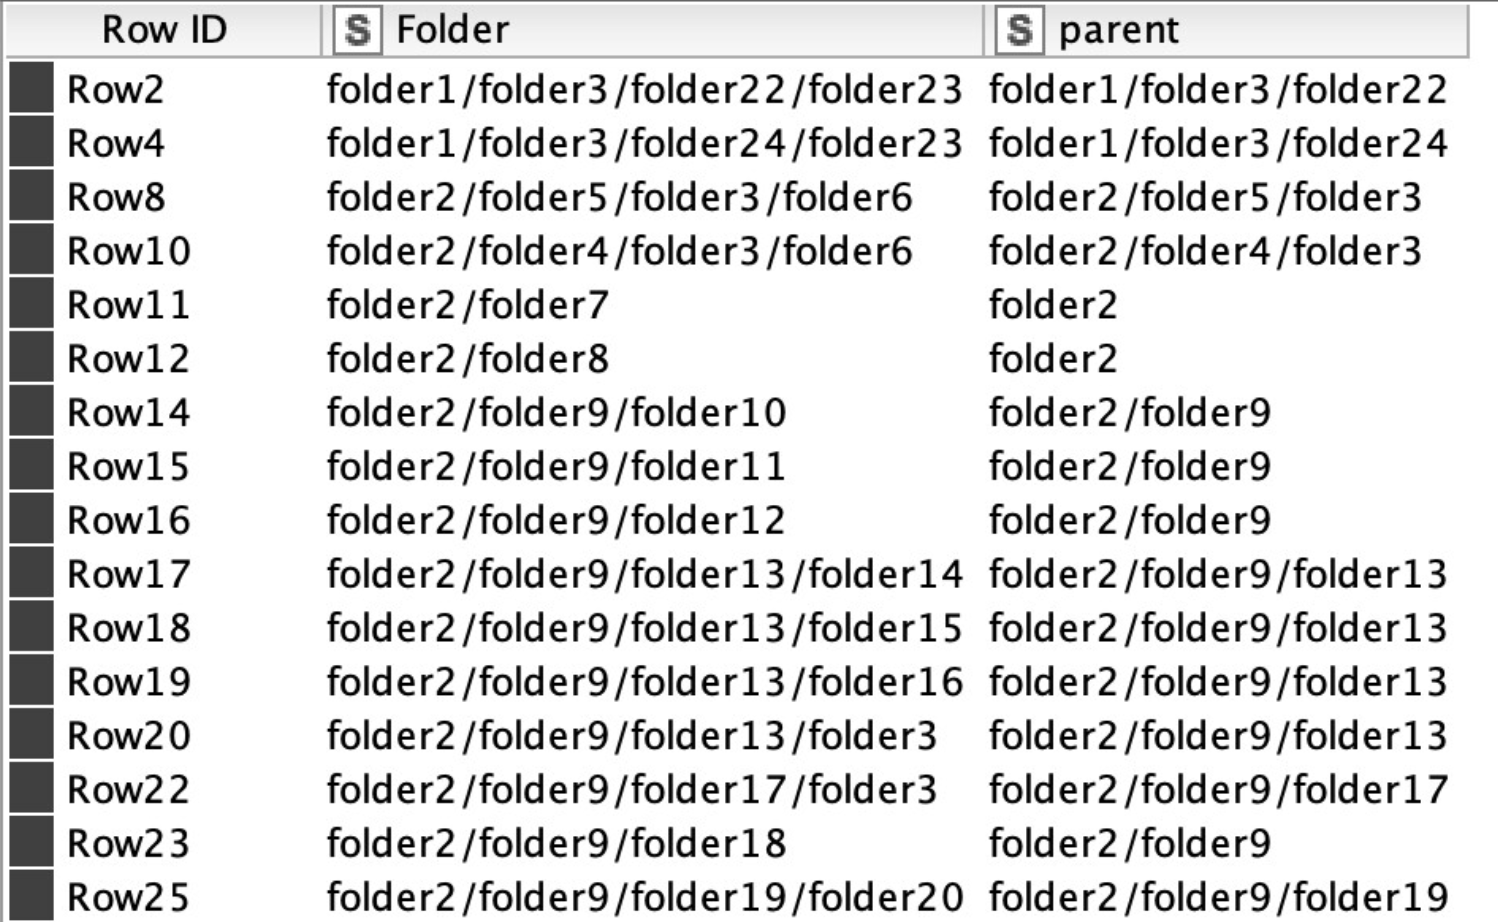
Together, we decided to showcase his stylish work with his solution to Challenge 8: the goal here was to remove certain redundancies from a list of folder references, in the context of a data warehouse.
Most solutions had about ten nodes, but Toshiyuki decided to push for maximum efficiency: he came up with a workflow with only three nodes that perfectly solved the challenge. Everybody was impressed!
Yasue Katsutaka: Solving a Formula 1 challenge with the help of K-AI
(KNIME Forum: zassou_syk, X: Zassou_Syk, Website)
Yasue has been a Just KNIME It! KNinja since the end of our first season, when he completed all of its 40 challenges. During seasons 1 and 2, Yasue submitted elaborate solutions to our challenges under the username KNIMEST, and is now using the handle zassou_syk because it is a reference to a private study group that he organizes, focusing on informatics in life sciences and AI-driven drug discovery.
With over 20 years of experience as a medicinal chemist, Yasue currently manages the database system used by a life science team for drug discovery research.
Yasue, who has been nominated Contributor of the Month (COTM) in the past, is currently part of the KD Study Group, a compact group that focuses on enhancing data analysis skills, particularly with KNIME, and also includes other COTMs.
The KD Study Group met frequently during our last Just KNIME It! season, discussing insights and strategies related to the data challenges.
The story of the group, a testament to the value of collaboration, is documented here.
Featured Just KNIME It! Challenge
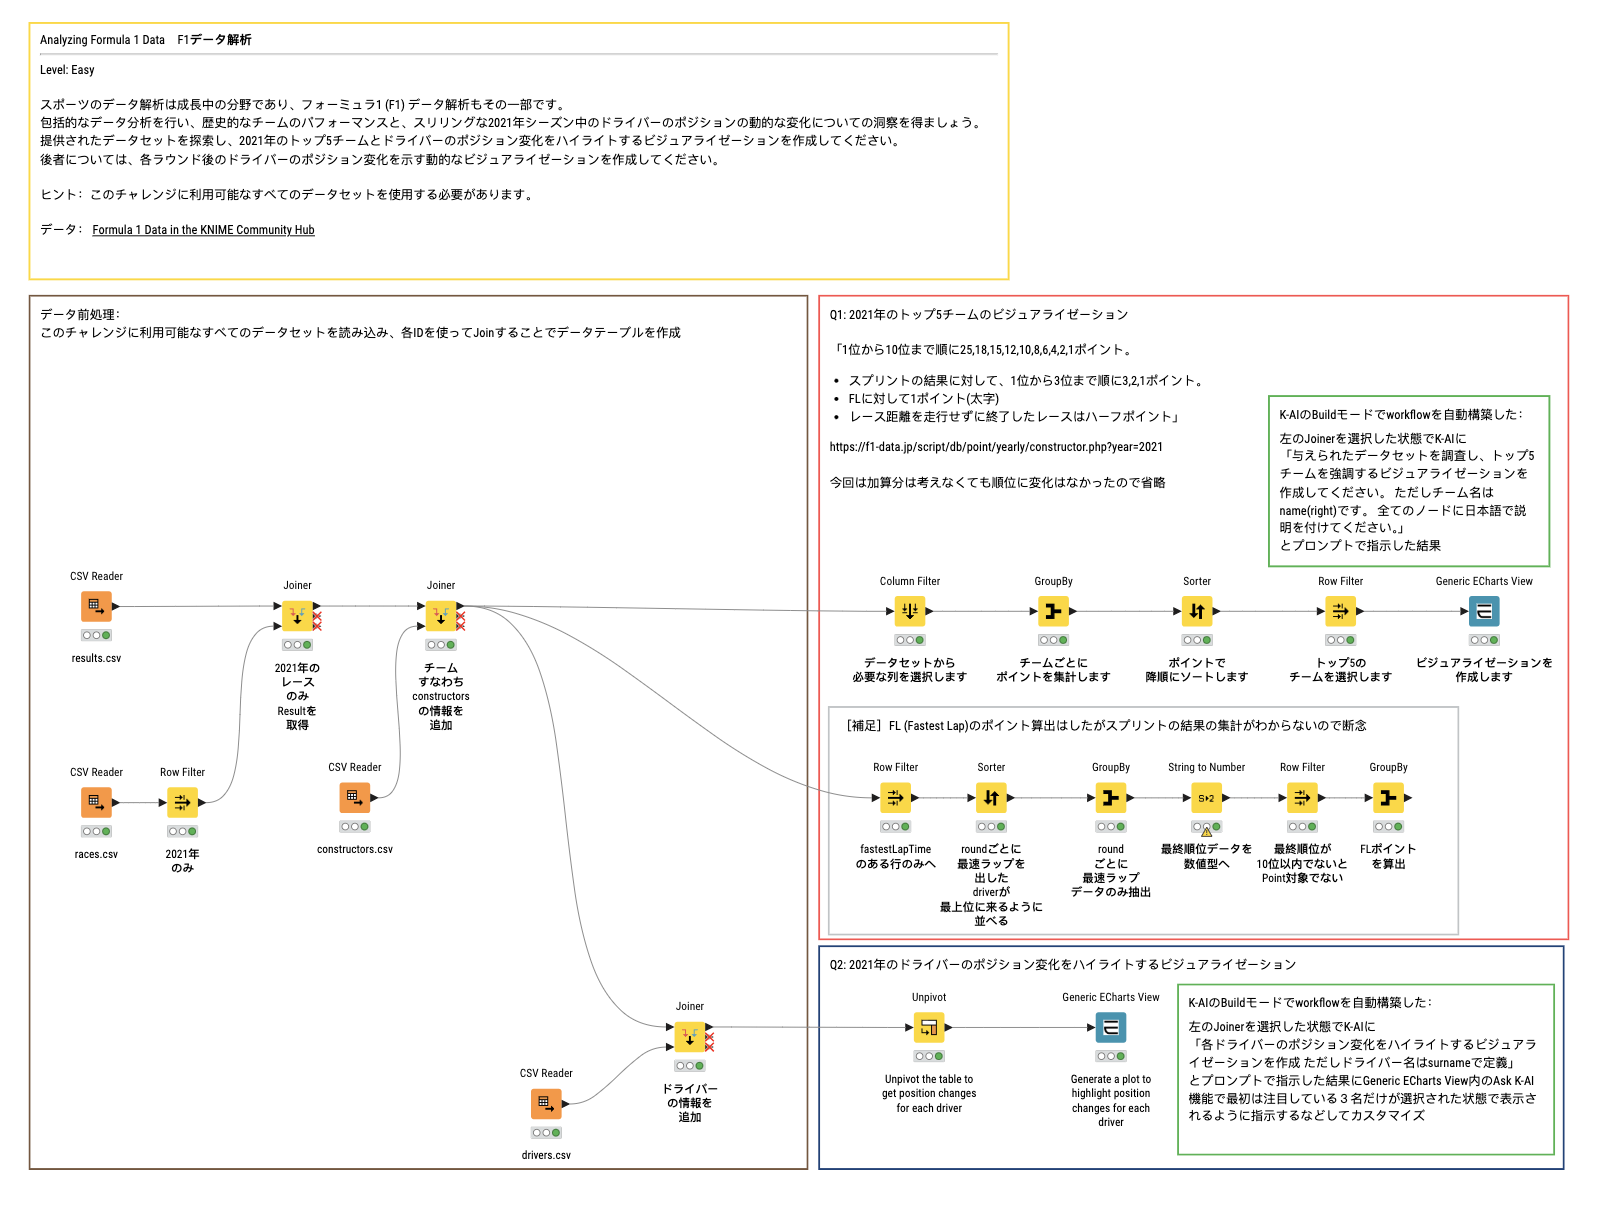
Since our first season, Yasue’s solutions have taken the spotlight for how well documented and didactic they are. This KNinja always adds clear descriptions to nodes and components, and often adds extra bits of information on different parts of his workflow.
Here we highlight his solution to Challenge 19, on Formula 1 data, because Yasue found it particularly engaging. In the process of devising a solution, he made extensive use of K-AI and even wrote a few blog posts about it!
Yuki Mizukami: Forecasting and visualizing trends in stock prices
(KNIME Forum: jm1950sjr, LinkedIn: Yuki Mizukami)
Yuki works as a medicinal chemist in Japan, focusing on drug discovery research. He acquired his KNIME and data science skills while tackling cheminformatics problems.
Recently, he built a digital platform with KNIME Business Hub to assist in the drug design and analysis of medicinal chemicals – and even presented it in a KNIME Data Talks event last year!
Featured Just KNIME It! Challenge
When a challenge involved data visualization skills, Yuki’s solutions would be particularly sharp. He told us that, in fact, his data visualization skills improved markedly with Just KNIME It!. He deepened his knowledge on our standard View nodes, and also mastered the Python View and the Generic ECharts View nodes.
Yuki mentioned that the assistance of K-AI in the latter was particularly useful, offering a significant advantage in the construction of effective and flexible visualizations.
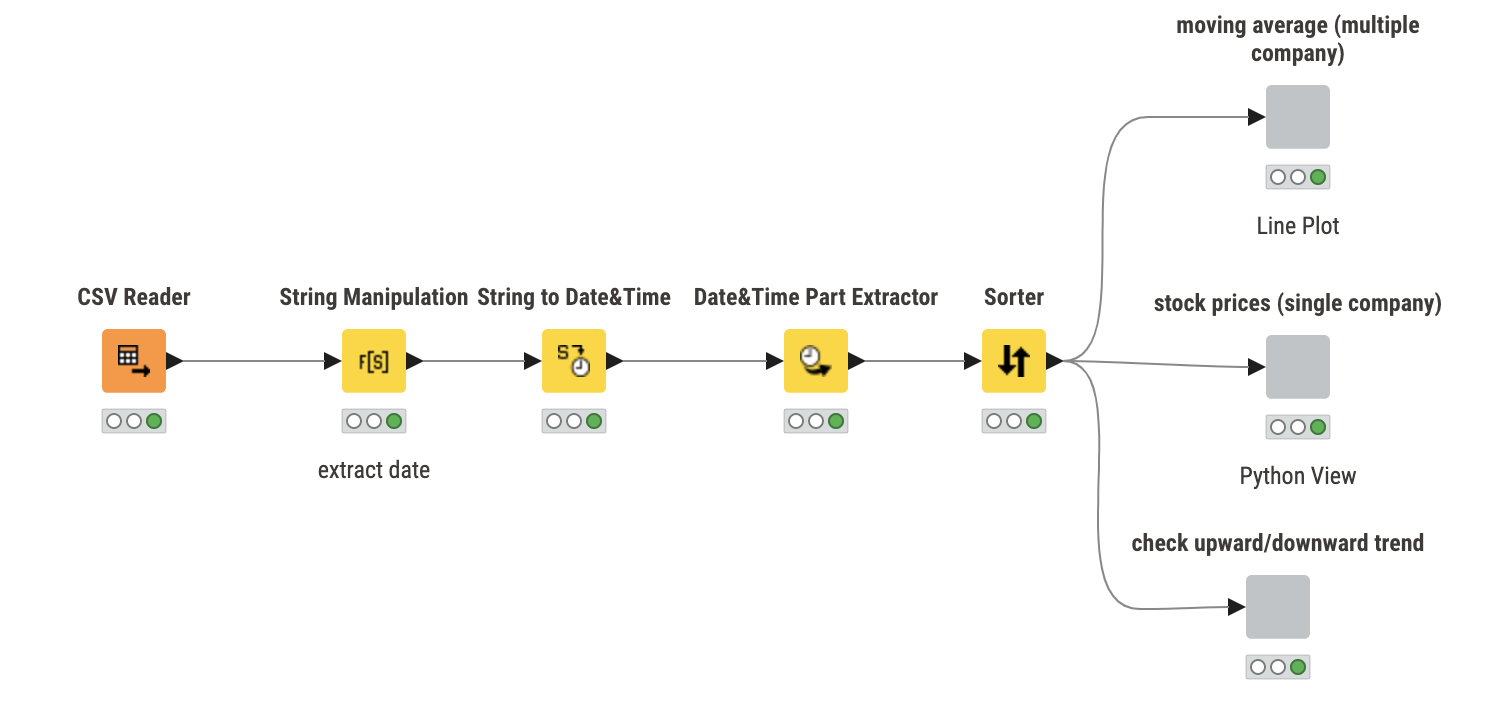
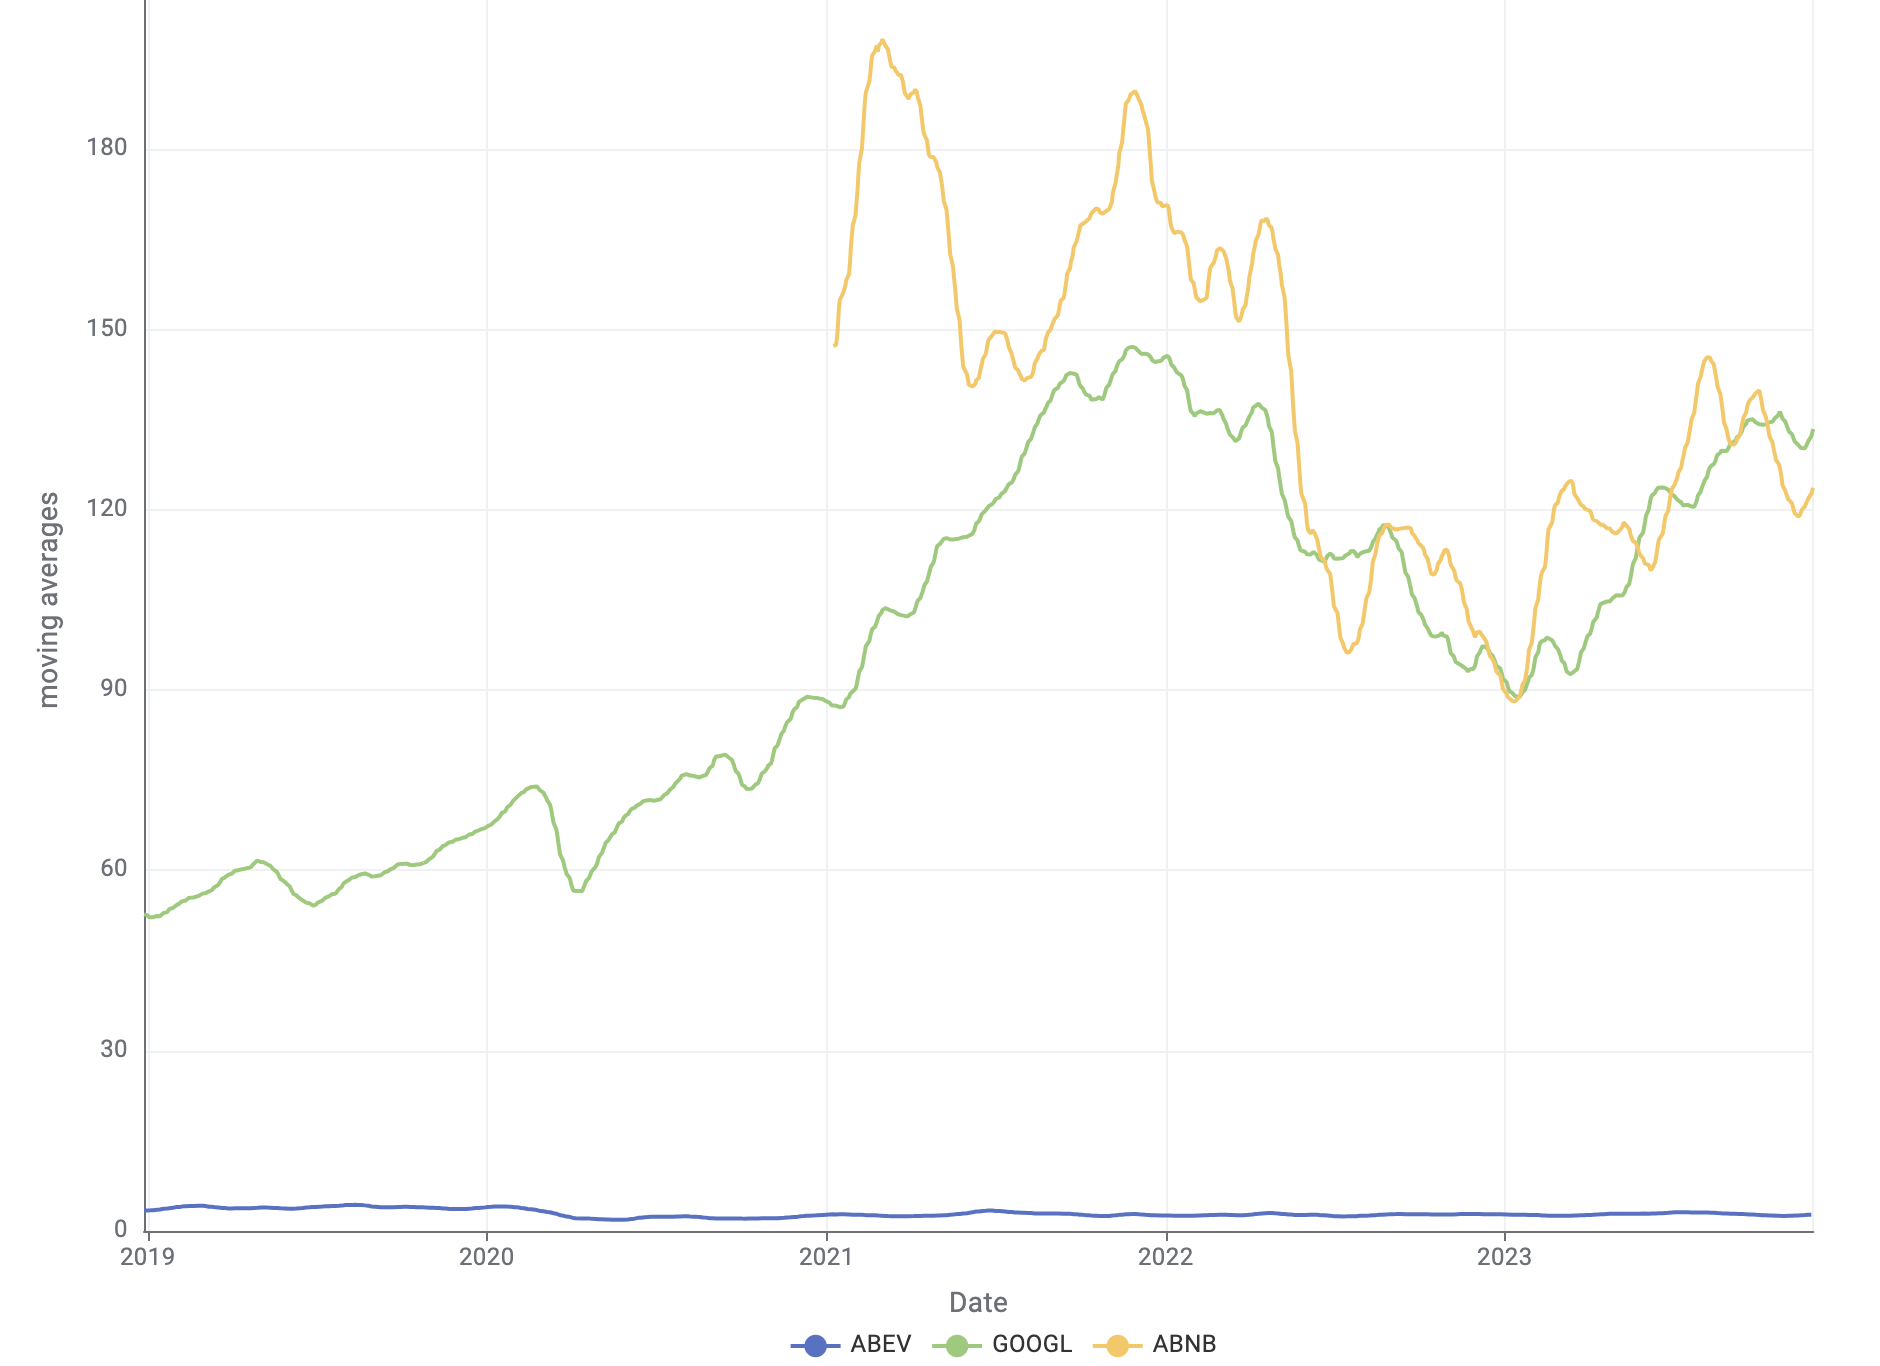
We would like to feature Challenge 1 as a representation of his work. This puzzle focused on identifying trends in stock prices.
Yuki came up with a workflow that allowed users to identify trends for different groups of companies employing a variety of time series analysis techniques.
Innovative solutions to diverse challenges with KNIME
Congratulations to our newest generation of KNIME KNinjas! Your solutions to our challenges highlight different functionalities of KNIME Analytics Platform, and are great examples of how much data science and data analytics can be effectively implemented with low-code.
Your enthusiasm and collaboration in the KNIME Forum gets us excited about hosting Just KNIME It! season 4, which will be announced on Just KNIME It!. We hope to see all of you there, along with newer KNinjas!