
One of the great advantages of KNIME data analytics platform is its ability to analyze diverse types of data. Today we want to move to the outer edge of the alphabet and look into data from the Zika virus. Our analysis is inspired by the Microreact project1 “Zika virus in the Americas”2 and is a nice use case for the exploration of epidemiological data with KNIME Analytics Platform. Epidemiology is the study of the distribution and determinants of health-related states or events3. In this post, therefore, we will answer the question: What routes did the Zika virus take as it spread across the globe, and how did its genetic makeup change the way it did? To this end, we will investigate and visualize both geolocational and phylogenetic data from the Zika virus. Using generic JavaScript nodes, we will create our own dynamic views and wrap them into a composite interactive view.
Even if you deal with very different data on a day-to-day basis, this blog post is still of high value, as we show how to increase the flexibility of your analysis using interactive generic JavaScript views.
Zika Virus
Zika virus (ZIKV) is an RNA virus with a 10.7 kb (kilo base pairs) genome encoding a single polyprotein; it is transmitted among humans by mosquitoes. It is named after the Zika forest in Uganda, where the virus was first isolated in 1947 from a sentinel rhesus monkey4. In humans, ZIKV infection typically causes Zika fever accompanied by maculopapular rash, headache, conjunctivitis and myalgia.
In early 2015, a widespread epidemic of Zika fever spread from Brazil to other parts of South and North America. In February 2016, the World Health Organization declared the outbreak a Public Health Emergency of International Concern as evidence grew that Zika can cause birth defects as well as neurological problems5.
In order to contain and control the spread of Zika, epidemiologists need to know the paths through which the virus spreads, as well as the ways its genetic makeup changes in different locations. The visual analytics capabilities available in KNIME Analytics Platform offer a great resource to investigate these questions.
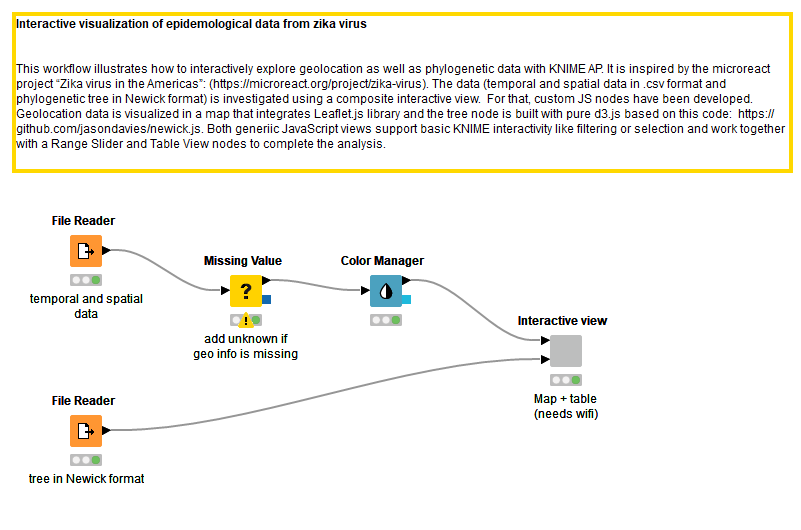
Figure 1: Workflow to analyze epidemiological data about the Zika virus. Temporal/spatial data as well as a phylogenetic information are used as inputs for a wrapped metanode that contains an interactive view.
Composite Interactive View for Epidemiological Data
We created a workflow (Fig. 1) to interactively investigate and visualize geolocational and phylogenetic data in KNIME Analytics Platform. In order to do this, we downloaded two files from the microreact project:
- microreact-project-zika-virus-data.csv containing temporal (day, year month) as well as spatial (country, latitude, longitude) information of the reported Zika virus cases in csv format
- microreact-project-zika-virus-tree.nwk containing the phylogenetic tree in Newick format
A phylogenetic tree is a diagram that depicts evolutionary relationships among organisms. One way of obtaining those evolutionary relationships is by comparing genomic sequences based on differences in the DNA that naturally accumulate over time. A common representation of the resulting tree structure is the Newick format6.
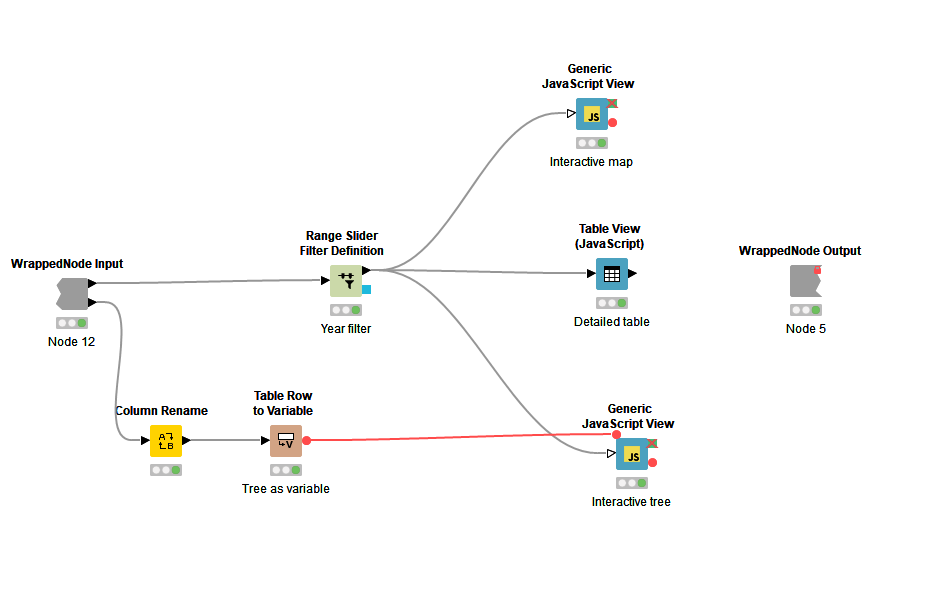
Figure 2: Inside the wrapped metanode, “Interactive view”: The view is composed of a range slider to filter by year, a detailed JavaScript table, and two generic JavaScript views: a map and a phylogenetic tree.
As Figure 1 demonstrates, the two downloaded files are used as input for a wrapped metanode named “Interactive view”. We used the Color Manager node to color-code according to the attribute, “regional”, which contains the categories Pacific Islands, Brazil, Brazil Microcephaly, Other American and Unknown. The view includes an interactive map based on the geolocation data, a range slider to let you filter by year, and an interactive table with additional information from the input csv file (see Fig. 2). In addition, it contains an interactive visualization of the phylogenetic tree. Figure 3 shows the complete composite view generated in the wrapped metanode, “interactive view”. The user can, for example, filter by year or select a specific Zika strain in the tree view which then gets selected in the map as well as in the table.
Investigation of Zika Virus Data
Looking at the phylogenetic tree in Figure 3, we find that the strain most diverse from the others is found in Asia, whereas strains collected in South America are most closely related7. This is also in line with the time the samples were collected, which we can easily explore using the range slider to filter by year (see view in Fig. 3). The first data point in our map is from Malaysia in 1966 followed by Micronesia in 1968. In 2010 and 2013, we find three occurrences in Cambodia, French Polynesia, and Canada (imported from Thailand). From there, the virus spread further south to Haiti. In 2015, ZIKV was reported in Brazil and subsequently in several countries of Central and South America such as Suriname, Guatemala, and Colombia.
The detailed table in the lower part of the view enables the extraction of additional information. This information includes the Zika strain, if the complete CDS (coding sequence) was extracted as well as the size of the sequence in base pairs (bp) that was available for the phylogenetic analysis. If we select a data point in the table it is selected automatically in the map, too, and the tree, and vice versa. We can also check for detailed information about a data point by selecting it in the map (see Fig 3).
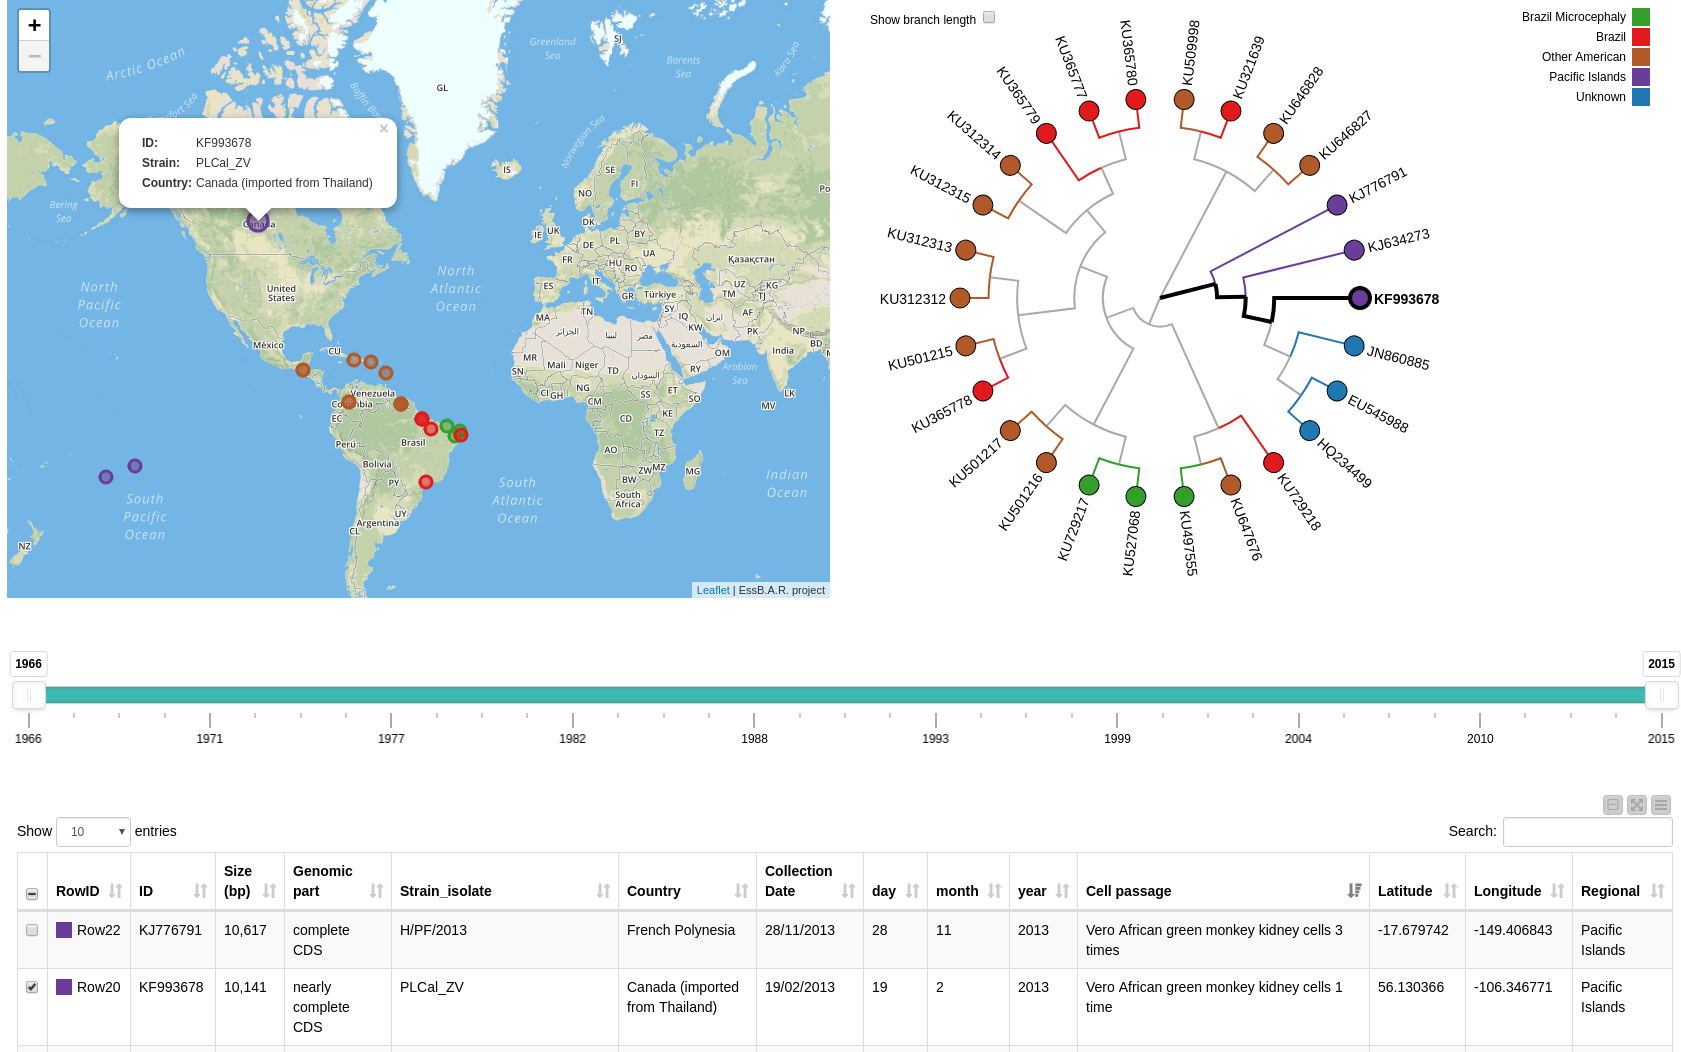
Figure 3: Composite view containing the interactive map, a phylogenetic tree, a range slider, and an interactive table with additional information.
The interactivity allows us to easily investigate how the virus spread and explore the data in detail. For the dedicated KNIME JavaScript plots and tables, this interactivity is easily achieved by combining views that operate on the same table in a wrapped metanode. For the custom JavaScript views (in our case the map and the phylogenetic tree) it is worth diving a bit further into the details to see how this can be done.
Interactive Generic JavaScript Views
Figure 4 shows the configuration of the generic Interactive tree JavaScript node. The code uses Jason Davies’ Newick format parser from 2011 (https://github.com/jasondavies/newick.js).
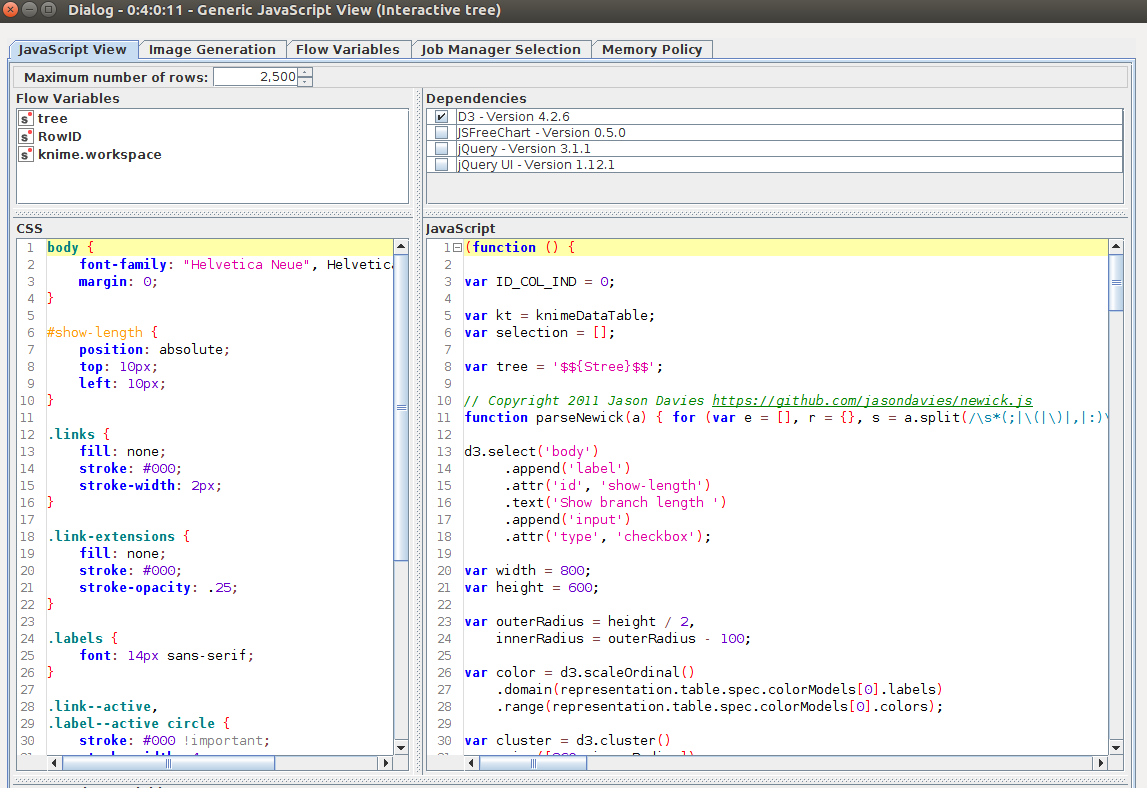
Figure 4: Configuration of the generic Interactive tree JS view. The CSS style can be included on the left the JavaScript code as well as the Dependencies - on the right.
In the configuration you can see the block of code that enables access to the input table and use a set of predefined libraries to generate the view. The dependencies can be found in the upper part of the window. Our tree node is built with d3.js, more information about that can be found in the following blog post "From d3 example to interactive KNIME view in 10 minutes"
For the map node we integrate the leaflet.js library via this link: https://unpkg.com/leaflet@1.3.1/dist/leaflet. Hence, to be able to display the map you need an internet connection.
Interactive Generic JavaScript Views - Functionality
Here, we briefly describe the functionality that helped us to create our interactive generic JavaScript views where the user was able to filter and select the data (for details, please have a look into the full source code in the example workflow). Note that you can use this information and apply it to many different scenarios - to retrieve, select, and filter data.
-Do you have data available at the input port? How can the data be accessed and retrieved?
- knimeDataTable.getColumnNames() - accesses the data and retrieves the column names in a string array, with knimeDataTable being a global JavaScript object that is created and populated automatically
- knimeDataTable.getColumn(columnID) - accesses and retrieves an array of all values contained in the column with the given ID (see node description for the details and methods).
-How can you select and filter data?
- knimeService is a second global object that enables you to i.e. support selection and filtering in your view
-To register a subscriber to the selection events, call the following method:
- knimeService.subscribeToSelection(tableId, callback)
-You can also subscribe to a filter event through:
- knimeService.subscribeToFilter(tableId, callback)
-A callback is the function to be called when a selection or filter event occurs, i.e.
- filterChanged = function(data) { […] } where “data” is an object that contains information about the currently applied filter
-To unsubscribe from a filter or selection, call:
- knimeService.unsubscribeFilter/Selection(tableId, callback).
-To change the selection use any of these three convenient methods:
- knimeService.addRowsToSelection(tableId, rows, callback)
- knimeService.removeRowsFromSelection(tableId, rows, callback)
- knimeService.setSelectedRows(tableId, selectedRows, callback)
These functions helped us to achieve the interactivity in our generic JavaScript views which in turn allowed us to create a view where the user can investigate epidemiological data from the Zika virus.
Summary
Generating an interactive composite view allowed us to interactively explore how the Zika virus spread over time and to relate that to sequence similarities in the genome of the virus. This workflow is a nice example of how it is possible to handle epidemiological data with KNIME Analytics Platform and how to generate custom JavaScript views.
You can investigate the results using the Analytics Platform or deploy the workflow to KNIME Server and enjoy the view on the WebPortal. The latter gives e.g. a Zika virus expert the chance to interact with the data without having to know how to use KNIME Analytics Platform.
Thank you to Oleg Yasnev for contributing to this article.
References
1. "Microbiology Society Journals | Microreact: visualizing and sharing ...."
Accessed 1/31/2019
2. "Zika virus in the Americas: Early epidemiological and genetic findings ...."
Accessed 1/31/2019
3. "WHO | Epidemiology - World Health Organization."
Accessed 1/31/2019
4. "Zika virus. I. Isolations and serological specificity. - NCBI."
Accessed 1/31/2019
5. "The Emergence of Zika Virus as a Global Health Security ... - NCBI - NIH."
Accessed 1/31/2019
6. "Newick format - Wikipedia."
Accessed 1/31/2019
7. "Zika virus in the Americas: Early epidemiological and ... - Science."
Accessed 1/31/2019