Interactive visualizations on the web have become very popular recently. The JavaScript framework D3 has developed into one of the most used libraries by many websites and publishers for rich graphics and visualizations.
In this blog post I’d like to show you how easy it is to harness D3’s capabilities and bring them into KNIME. To do so I am taking an existing example from the D3 website and will create an interactive view using the Generic JavaScript view in just 10 minutes.
So let’s get started.
If you have a basic version of KNIME Analytics Platform, you first need to install the JavaScript views extension. To do so, go to the ‘File’ menu and ‘Install KNIME Extensions’. Select the ‘KNIME Labs Extensions’ category and from that category, select and install the ‘KNIME JavaScript Views’. After successful installation you will need to restart your application.
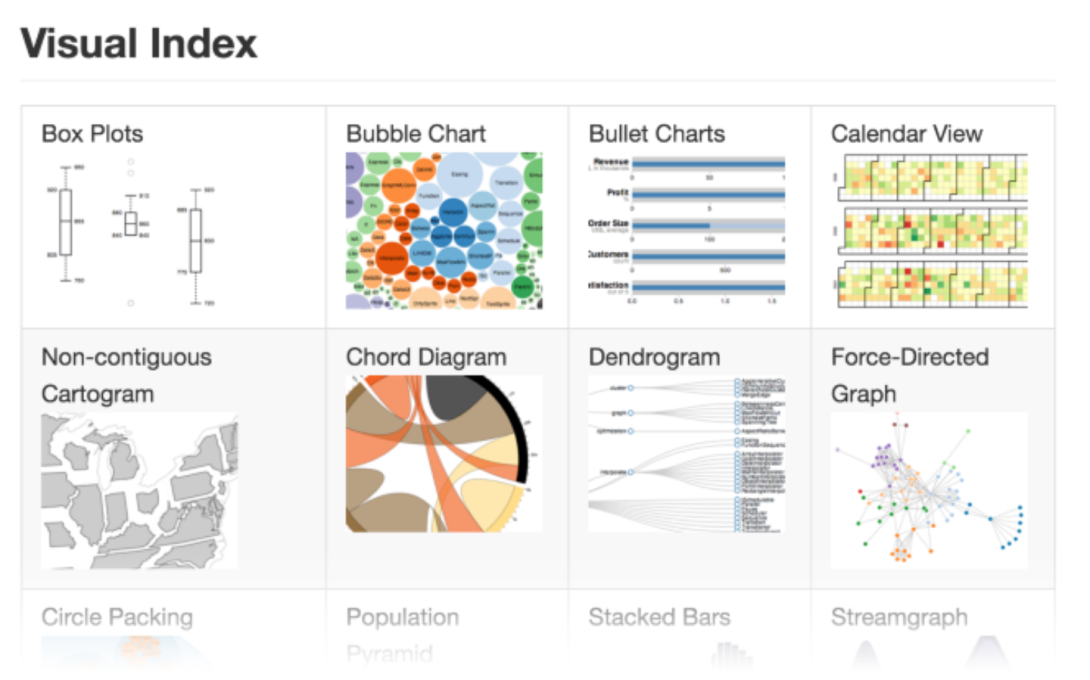
In the second step let’s pick the example we want to work with. I picked the one for this blog post by browsing through the D3 Gallery.

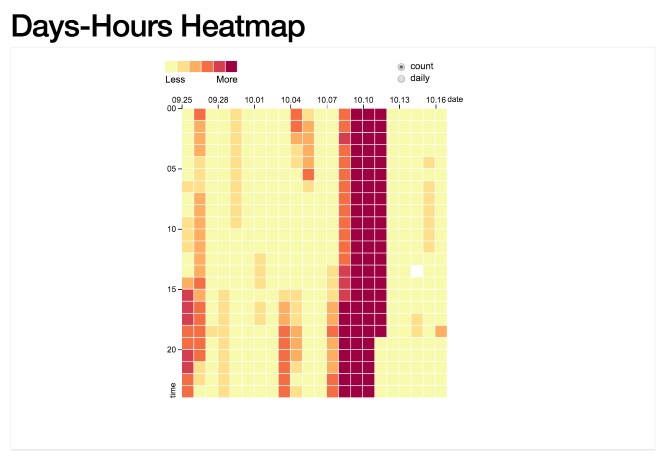
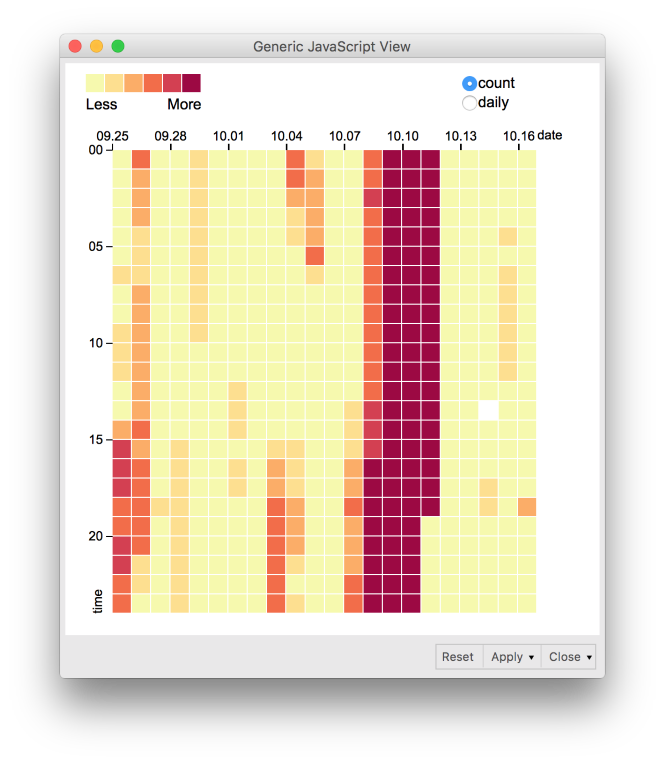
After scrolling down for a bit, you will see this nice implementation of a heat map, which also offers a little bit of interactivity.
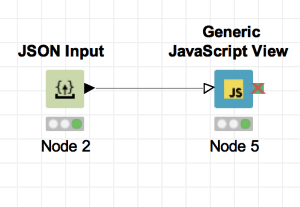
The great thing about most of the examples in this gallery is that all of the different parts that go into the visualization are given and explained. We will see how this comes in handy when setting up the view node, but first, let’s take a look at the workflow we are going to set up. It is very simple and involves only two nodes: the JSON Input node to feed in the data and the Generic JavaScript view to display the visualization.
JSON Data
Looking at how the data are read into the view in the example, we notice that an external JSON file is read in.
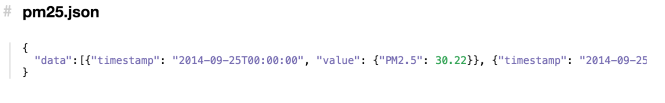
Since we are going to be porting this view into KNIME it would be nice to be able to exchange and modify this data in a workflow. For simplicity we will use the JSON Input node and simply copy and paste the whole JSON string from the website straight into the configuration of the node.
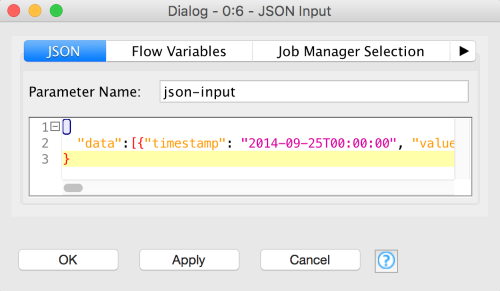
After executing the node KNIME creates a table with one JSON column in which one cell including all the pasted data is present. Now we already have the data in the workflow and can work with it.
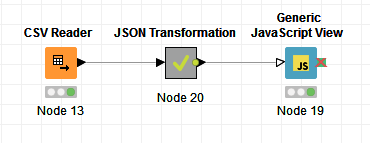
Please note, that this setup is quite unusual, with the JSON Input node as data source of the Generic JavaScript View. Here the JSON Input node is used to be able to easily copy and paste the json data from file pm25.json on the website. Usually data would be provided by e.g. reading a csv file, as shown in the following image.
View Configuration
Let’s move on to the visualization. Open up the configuration dialog of the Generic JavaScript view node. Here you will find two large input fields, one for CSS and one for JavaScript. We can also use flow variables in our script and pull in a few standard libraries, one of them being D3. Since we are working on a D3 example select D3 as a dependency on the top right.
CSS
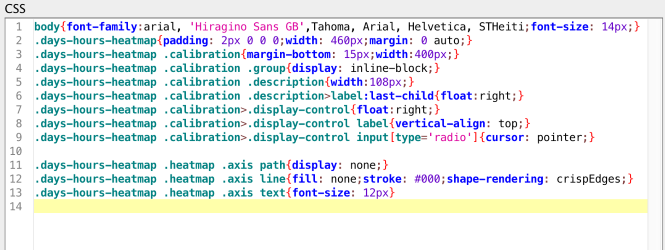
The next easy part is the CSS. We do not have to change anything here and can also just simply copy and paste it from the website.
HTML
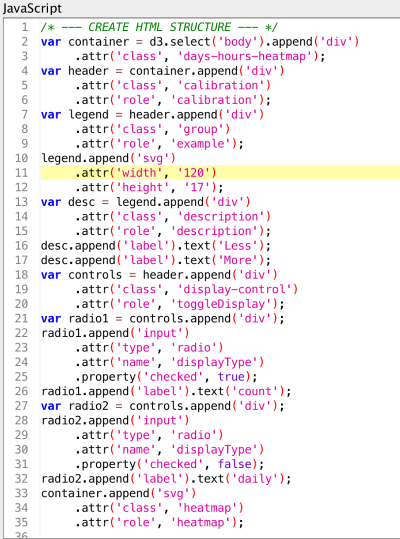
There is two more parts on the website. One of them is a basic HTML stub that the JavaScript later on uses. At the moment it is not possible to enter HTML in the node configuration, so we will have to create it as the first thing in our JavaScript. There are different ways to do this, but since we have D3 as a dependency already, it would be natural to use D3 also for the element creation. The following code snippet creates the same HTML structure as given in the example.
JavaScript
Now onto the last part, the actual JavaScript implementation. Since all the pieces are already in place, we can copy and paste the code from the website again into our JavaScript editor on the right hand side.
There is however one thing we need to change, and that is how the data is accessed in the code. As I said before, in the example it is pulled in as a file. This is done with the d3.json() function, as you can see here:
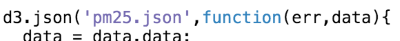
We have the data in the workflow already and fed a table into the view node. A KNIME table, when connected, is always automatically converted into a JavaScript table construct and made available as a ‘knimeDataTable’ variable. We know, that the table coming in only has one column and one row, so in our access call, we only need to address this one cell in the table:

After we pulled out the data, we obtained the JSON string, which we only need to parse now, to be able to use it just as the example does. Getting all these pieces together, we can now execute the node and open the view, which should look exactly like the example on the website:
From here on, you can modify the view to fit your current need or generalize it, for a broader use case. Download the workflow Example of Visualization with Custom JavaScript D3.js Code from the KNIME Hub.
Requirements:
- KNIME Analytics Platform >= 3.1
- KNIME JavaScript Views extension
- KNIME JSON-Processing extension