How we implemented a weather station with KNIME - Part 1
The manufacturing industry suffered some severe blows in 2020 with shutdowns impacting supply chains and production levels. Manufacturers are looking to future proof their businesses and agility could be key. Those companies who are adopting digital technologies are better able to react swiftly to changes in the market. IoT initiatives for example, can help manufacturers improve their supply chain management or enable predictive part maintenance.
IoT applications are, however, complex, normally involving multiple tools and technologies to connect to sensors, set up a data storage and collect the data, and optionally integrate some form of analysis - time series analysis - to predict the future. An open software platform that is able to integrate with different tools and blend different types of data makes this easier. We therefore challenged ourselves to build a solution that would forecast temperature, using the open KNIME software.
The data generated by an IoT device needs to be collected and managed before it can be used. This article describes how we used a web service to collect and transfer the data from a sensor board to a data storage.
A second article will demonstrate how we tackled data forecasting based on a sARIMA model.
You can find all applications used to build this weather station on the KNIME Hub in KNIME Weather Station.
Data Collection from an Arduino Sensor Board
Around mid of May 2021, we installed the Arduino MKR IoT Carrier sensor board out of our office window.
This sensor board is embedded with different sensors, relays, LEDs, sound Buzzers, etc. For this project, we focused only on the sensors for temperature, humidity, and pressure. The sensor board has been extended by mounting a Wi-Fi module and powered using a micro USB 2.0 cable. This Wi-Fi extension was needed to connect to the REST service that collects the data.
For instructions on how to set the Arduino sensor board as a weather forecast station we got inspiration from this post Making an Arduino Oplà IoT Weather Station with Cloud Dashboard in the DIY Life blog. This post also teaches how to use the Arduino IoT Cloud to configure the sensors’ variables and the Arduino’s web IDE to write sketch code. A sketch is essentially a piece of code where you tell the Arduino board what to do, upon start-up and during execution, like for example attempting to connect to the internet upon startup, configuring display screen on board, etc. The sketch code, in this case resides on the Arduino IoT Cloud and it is written in a variation of C++.
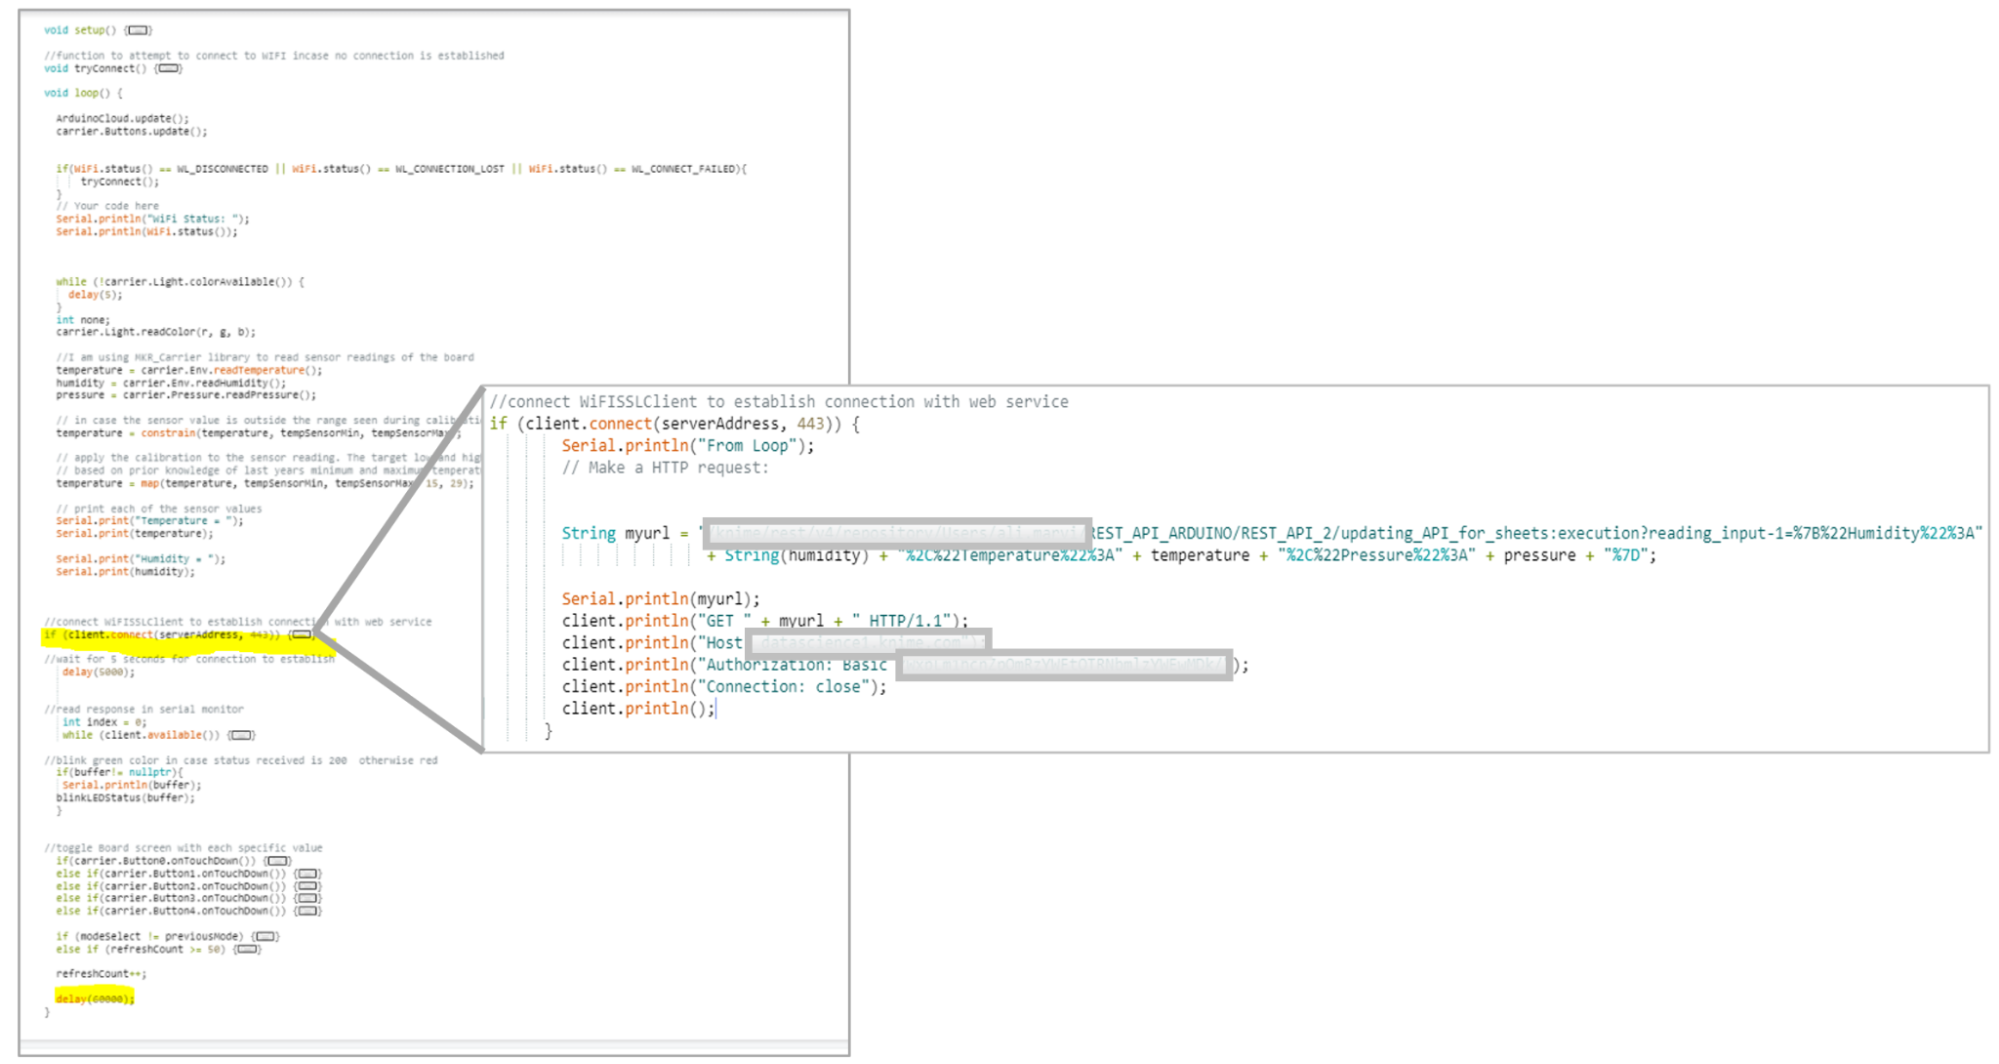
Below, in figure 2, you can see the piece of the sketch code used to get the board started. It calls two functions -
and
.
is called when the board starts. It will only run once after power is switched on or a reset event occurs.
, on the other hand, does what the name suggests, i.e. loops continuously to control the Arduino board.
This Arduino MKR board is capable of recording values every 0.1 second, but a sample value every minute was judged sufficient and sampling frequency was set to one sample every minute through the delay() function (highlighted in Fig. 2) in the C++ sketch.
Data Storage
Now what good is it to sample a signal, if the readings are not stored anywhere? As a data repository, we chose a Snowflake database.
Notice that KNIME Analytics Platform has connectors to many data repositories. You can see a subset of those in the last published cheat sheet on KNIME Connectors. We could have used a big data platform or a local installation of a classic SQL database. We chose to use a Snowflake database as a remote repository solution. We also used a Google Sheet as a backup storage.
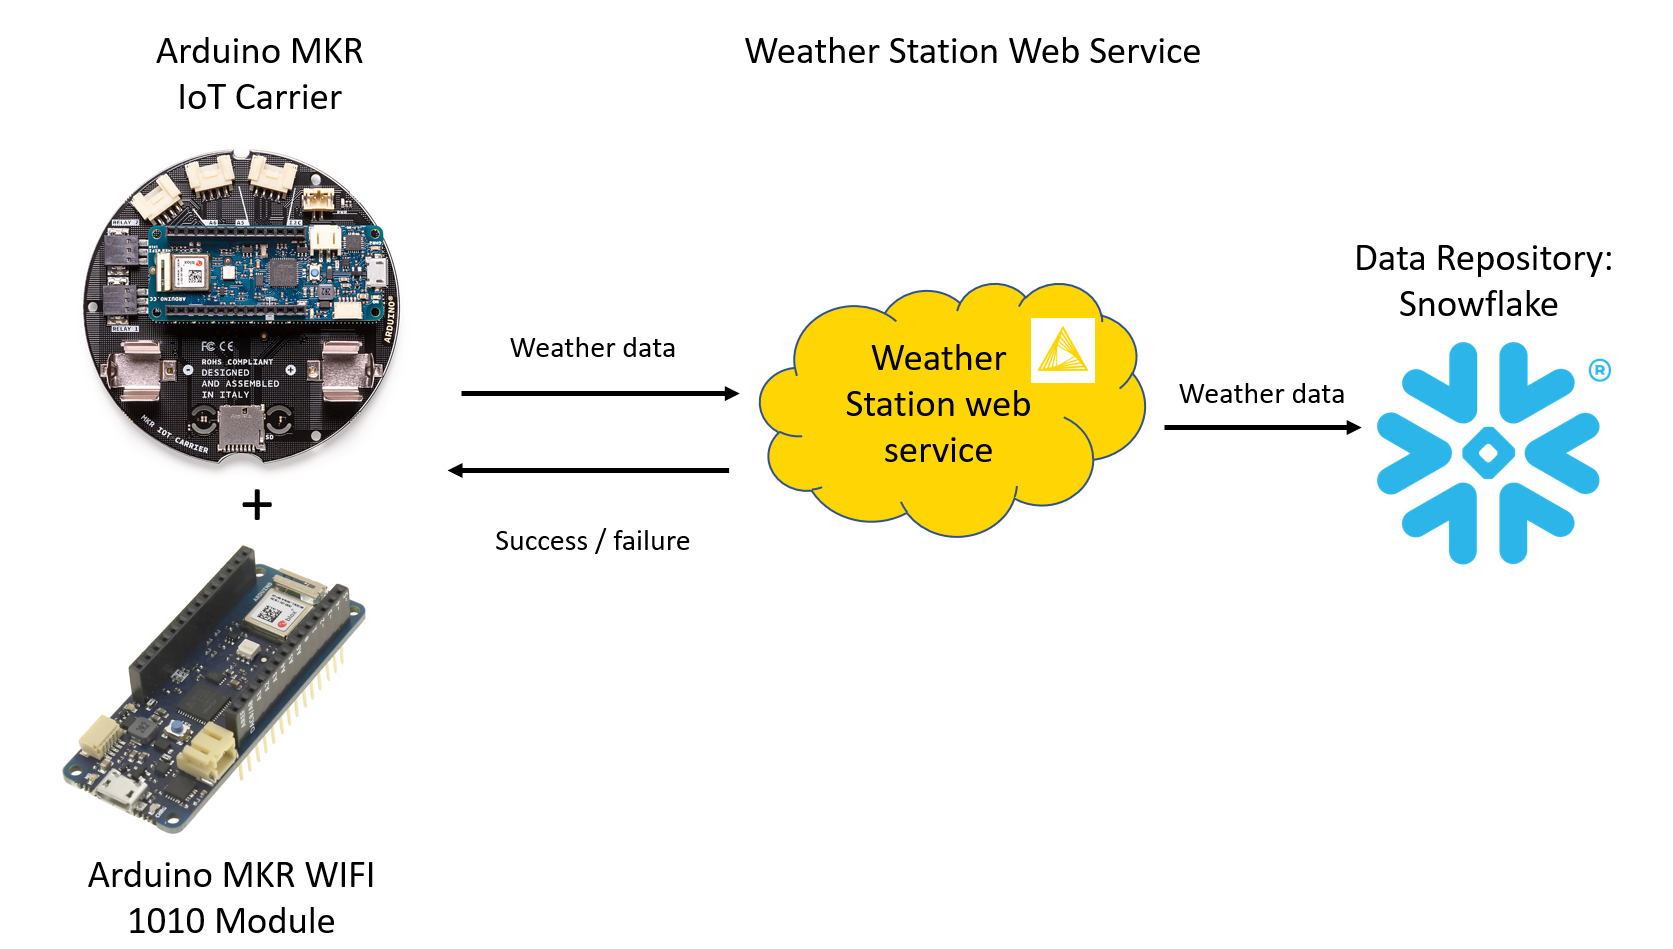
In order to get the data from the sensor board into the data repository, the board script calls a web service, named Weather Station and residing on the KNIME server, every time that new data is available.
Data Transfer from Sensors via Web Service to Snowflake
The Wi-Fi module that we installed together with the sensor board can connect to an external Wi-Fi and therefore can consume any web service. The data is transferred first from the sensors in the Arduino board onto the Wi-Fi module via an https connection; then from the Wi-Fi module to the Snowflake database via the Weather Station web service.
A call to the Weather Station web service on the KNIME Server has been embedded in the sketch code (Fig. 2). In the image (you might need to zoom in), there is an IF block that incorporates a call to the data collection web service. The call to the web service is a GET request, requiring a path to the web service and a header with host name and basic authorization token.
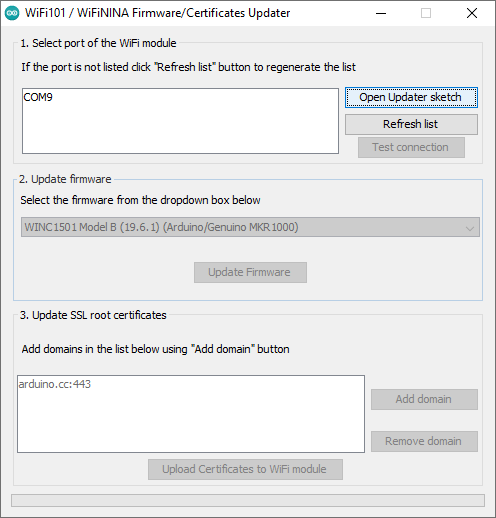
**Just a tip, add the hostname of your server when updating the SSL certificates in the Wi-Fi module (Fig. 3). This task requires a Desktop version of Arduino IDE which can be downloaded from Arduino’s website. One advantage of using Arduino Desktop is that it comes loaded with examples and library manager along with other features like managing firmware in the Wi-Fi module. Also please remember to update Wi-Fi firmware before updating the sketch script.
The Weather Station Web Service - REST API
We have reached the heart of the data collection part: the web service that transfers the data from the sensor board to the data repository. For that, we built our own Weather Station web service, a REST API, without programming but using KNIME software instead. No hassle of CROS, tokens or anything else; just basic oAuth authorization, JSON data structure, development on KNIME Analytics Platform, and deployment on a KNIME Server.
KNIME Server lets you easily deploy applications as web services, reach workflow REST endpoints, schedule executions, create web applications, and collaborate with other users. Among the many things the KNIME Server can do, let’s focus here on deploying applications as REST API services.
Let’s move step by step in the creation of this web service.
1. Transform a KNIME workflow into a web service on the KNIME server
That is easy! Any KNIME workflow on a KNIME Server can be called as a REST service. More details on that, can be found in this blog article, The KNIME Server REST API.
2. Pass the sensor data to the REST service
To complete our Weather Station web service though, we need it to accept Requests and produce Responses, for example with JSON formatted data. In the workflow on the KNIME server we added a Container Input (JSON) node to define the JSON structure of the Request and a Container Output (JSON) node to shape the structure of the data in the Response (Fig. 5). The workflow implementing the REST web service then accepts Request data through the Container Input (JSON) node.
3. Add a timestamp
Every data operation must be documented at the very least with a timestamp documenting the time of execution. We generate the timestamp via a Create Date&Time Range node. The timestamp is then joined with the incoming data.
4. Write to the Snowflake database
To write in the Snowflake database we just need two nodes: The Snowflake Connector and the DB Insert node. The Snowflake Connector node connects to the Snowflake database, throughout credentials if required. The DB Insert node exploits the connection to the database at its input port and implements an INSERT SQL instruction on the database with the data at its other input port. In order to access the database, credentials are required and provided by the Credentials Configuration node. This node accepts credentials, encrypts them, passes them on in the form of a flow variable, and offers some options to store them.
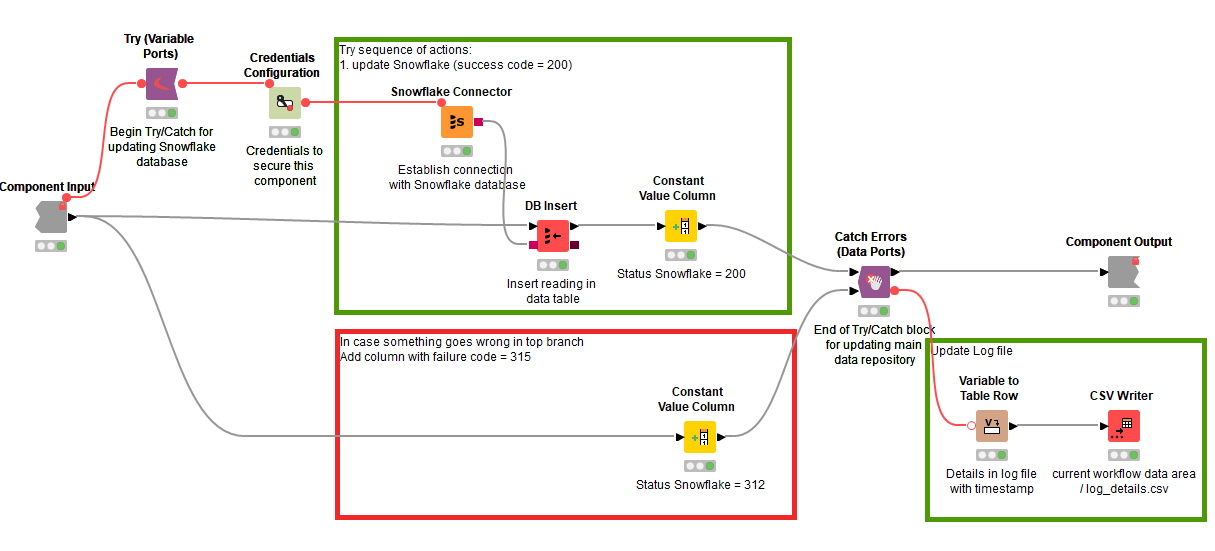
5. Provide a graceful exit in case of failure
Databases are databases and sometimes they might not be available. They are down, credentials have changed, maybe unreachable, and so on. You know it. We need some kind of construct for a graceful exit in case the database is not available. We encased the database operation within a Try/Catch block (Fig. 4). The upper part of the Try/Catch block, i.e. the Try part, covers the database operation and adds an execution code 200 for success. The lower part, i.e. the Catch part, provides the graceful exit. In case the database operation did not succeed, a status code 312 for failure is provided. The component execution thus is always successful, only that in one case produces a success code (200) and in the other case a failure code (312).
6. Log failure or success of web service
The result of this operation is also reported in a log file updated each time by the CSV Writer node.
7. Write to the Google Sheet
A similar construct is used to write the input data on the backup Google Sheet. Here a Google Authentication node, a Google Sheet Connector node, and a Google Sheet Updater node are encased within a Try/Catch block outputting a 200 (success) or a 315 (failure) code. Notice that the Google Authentication node provides the Google authentication service on the Google side and not locally in the workflow. The final Response, including incoming data and Status Code, is sent out at client end and can be viewed back on the Arduino Serial Monitor.
8. Call to the REST API
The final workflow implementing the Weather Station web service is shown in Fig. 5 and is available on the KNIME Hub (KNIME Weather Station). Let’s see how we can call it from the Arduino board.
Creating a JSON body for REST calls is a lot of work, if done on the Arduino device. To avoid this extra work, we include the data into the HTTP GET request. The REST Endpoint - in a percent-encoded format - is reported below and was obtained via the Swagger interface available on the KNIME Server.
All we have to do now is to incorporate it in the Arduino sketch script (Fig. 2).
9. Send GET Request
In summary, the sensor board sends a GET Request to the Weather Station web service. Thus, the Weather Station web service, that is waiting on the KNIME Server, accepts the data in the Request, adds the time stamp, inserts data in data repositories, and produces a Response back to the sensor board describing the success or failure of the execution.
Summary of Our IoT System - Without Coding
We have implemented an IoT system with KNIME Analytics Platform and an Arduino board. Most of the project was carried on without coding, except for the Arduino scripts. This office weather station is a complete IoT system in the sense that it went from collecting the weather data from a sensor board to storing and analyzing the same data for next day predictions.
The architecture of our IoT system consists of: a sensor board to collect the data, a repository system to store the data, a backup repository system, a web service to transfer the data, and a sARIMA model to perform the predictions for the next day.
We collected the temperature values from the sampled signal via the sensor board “MKR IoT Carrier” by Arduino along with a Wi-Fi MKR 1010 module. The sensor board was installed right out of our office window and calibrated as suggested by the Arduino in its example document of Calibration. Please note that this is one of the techniques for calibration, there are more techniques posted by the Arduino community in the project hub.
We adopted an installation of the Snowflake database to store the data. We also used a Google sheet as a backup system in case a recovery was ever needed. Then, we developed a REST service to transfer data from the board onto the data repository: the REST service resides on the KNIME server and waits to be called by the sensor board to transfer the data.
The complicated part was actually to set the Arduino board properly and to set a reasonable calibration of the sensors on it. Thanks to the open nature of KNIME software and the ability to connect and blend with other technologies, the next phase of building a REST service to import the data into Snowflake, aggregating them, training and deploying the sARIMA model, and building a dashboard was easy and - all codeless.
In our next article we will explain how we used the collected data and trained a sARIMA model to forecast the average temperature for the next hour given the average temperature values for the past 24 hours. The trained model was then deployed to produce a dashboard for us to consume the maximum and minimum temperatures of the upcoming day along with hourly forecasts for the next 24 hour from current time.