
In this blog series we experiment with the most interesting blends of data and tools. Whether it’s mixing traditional sources with modern data lakes, open-source devops on the cloud with protected internal legacy tools, SQL with noSQL, web-wisdom-of-the-crowd with in-house handwritten notes, or IoT sensor data with idle chatting, we’re curious to find out: will they blend? Want to find out what happens when IBM Watson meets Google News, Hadoop Hive meets Excel, R meets Python, or MS Word meets MongoDB?
Follow us here and send us your ideas for the next data blending challenge you’d like to see at willtheyblend@knime.com.
Snowflake meets Tableau
The Challenge
It’s Friday morning, your boss comes to your desk and has grand data plans! They’ve promised the Board of Directors a flashy new dashboard to report sales figures and you’re the person to do the job. Oh and they need it by the end of the day!
Traditionally, this would have been a mammoth undertaking. Carefully planning your data structure, spending months gathering requirements and purchasing hardware.
Nothing kills any data project quicker than if;
- It doesn’t contain the data they need
- End users find it slow
- New data source can’t be added easily
- Data are incorrect and dirty
It is important to plan our future state to prevent that from happening. Luckily, the in-cloud data and analytics space is moving quickly, vendors are coming out with new, easy to use, easy to integrate solutions all the time. Rather than building our database from scratch, custom coding our ETL processes or fighting with archaic report writing solutions we go Agile and straight to the web and find a Software as a Service solution that fits the bill.
Well, seeing as it’s Friday and you want to get this done in time to head for the mountains for some skiing at the weekend because the snow is so great at the moment… speaking of which…
One application that is getting a huge amount of traction in the marketing place is Snowflake. Snowflake is a Software as a Service (SaaS) cloud data platform that can be deployed on Azure, AWS, or GCP globally. Snowflake takes a fresh approach with scaling, both performance and cost. Automatically switching off (and therefore the cost) when users aren’t using the database or automatically scaling to respond to a sudden increase in user load ensuring performance.
By connecting KNIME Analytics Platform to Snowflake, we can quickly create and populate an in-cloud data warehouse that’s enterprise ready, high performing and works with the market leading reporting and business intelligence tools.
As many organizations already have established BI tools, such as Tableau, we will use Tableau as the reporting tool that will connect to our Snowflake data. Tableau Desktop is a reporting tool that requires a commercial license.
Trials are available for both Tableau and Snowflake. KNIME Analytics Platform supports Tableau with its Tableau Writer extension that allows you to save data to Tableau’s in-memory formats .TDE and .Hyper also publish data directly to Tableau Server.
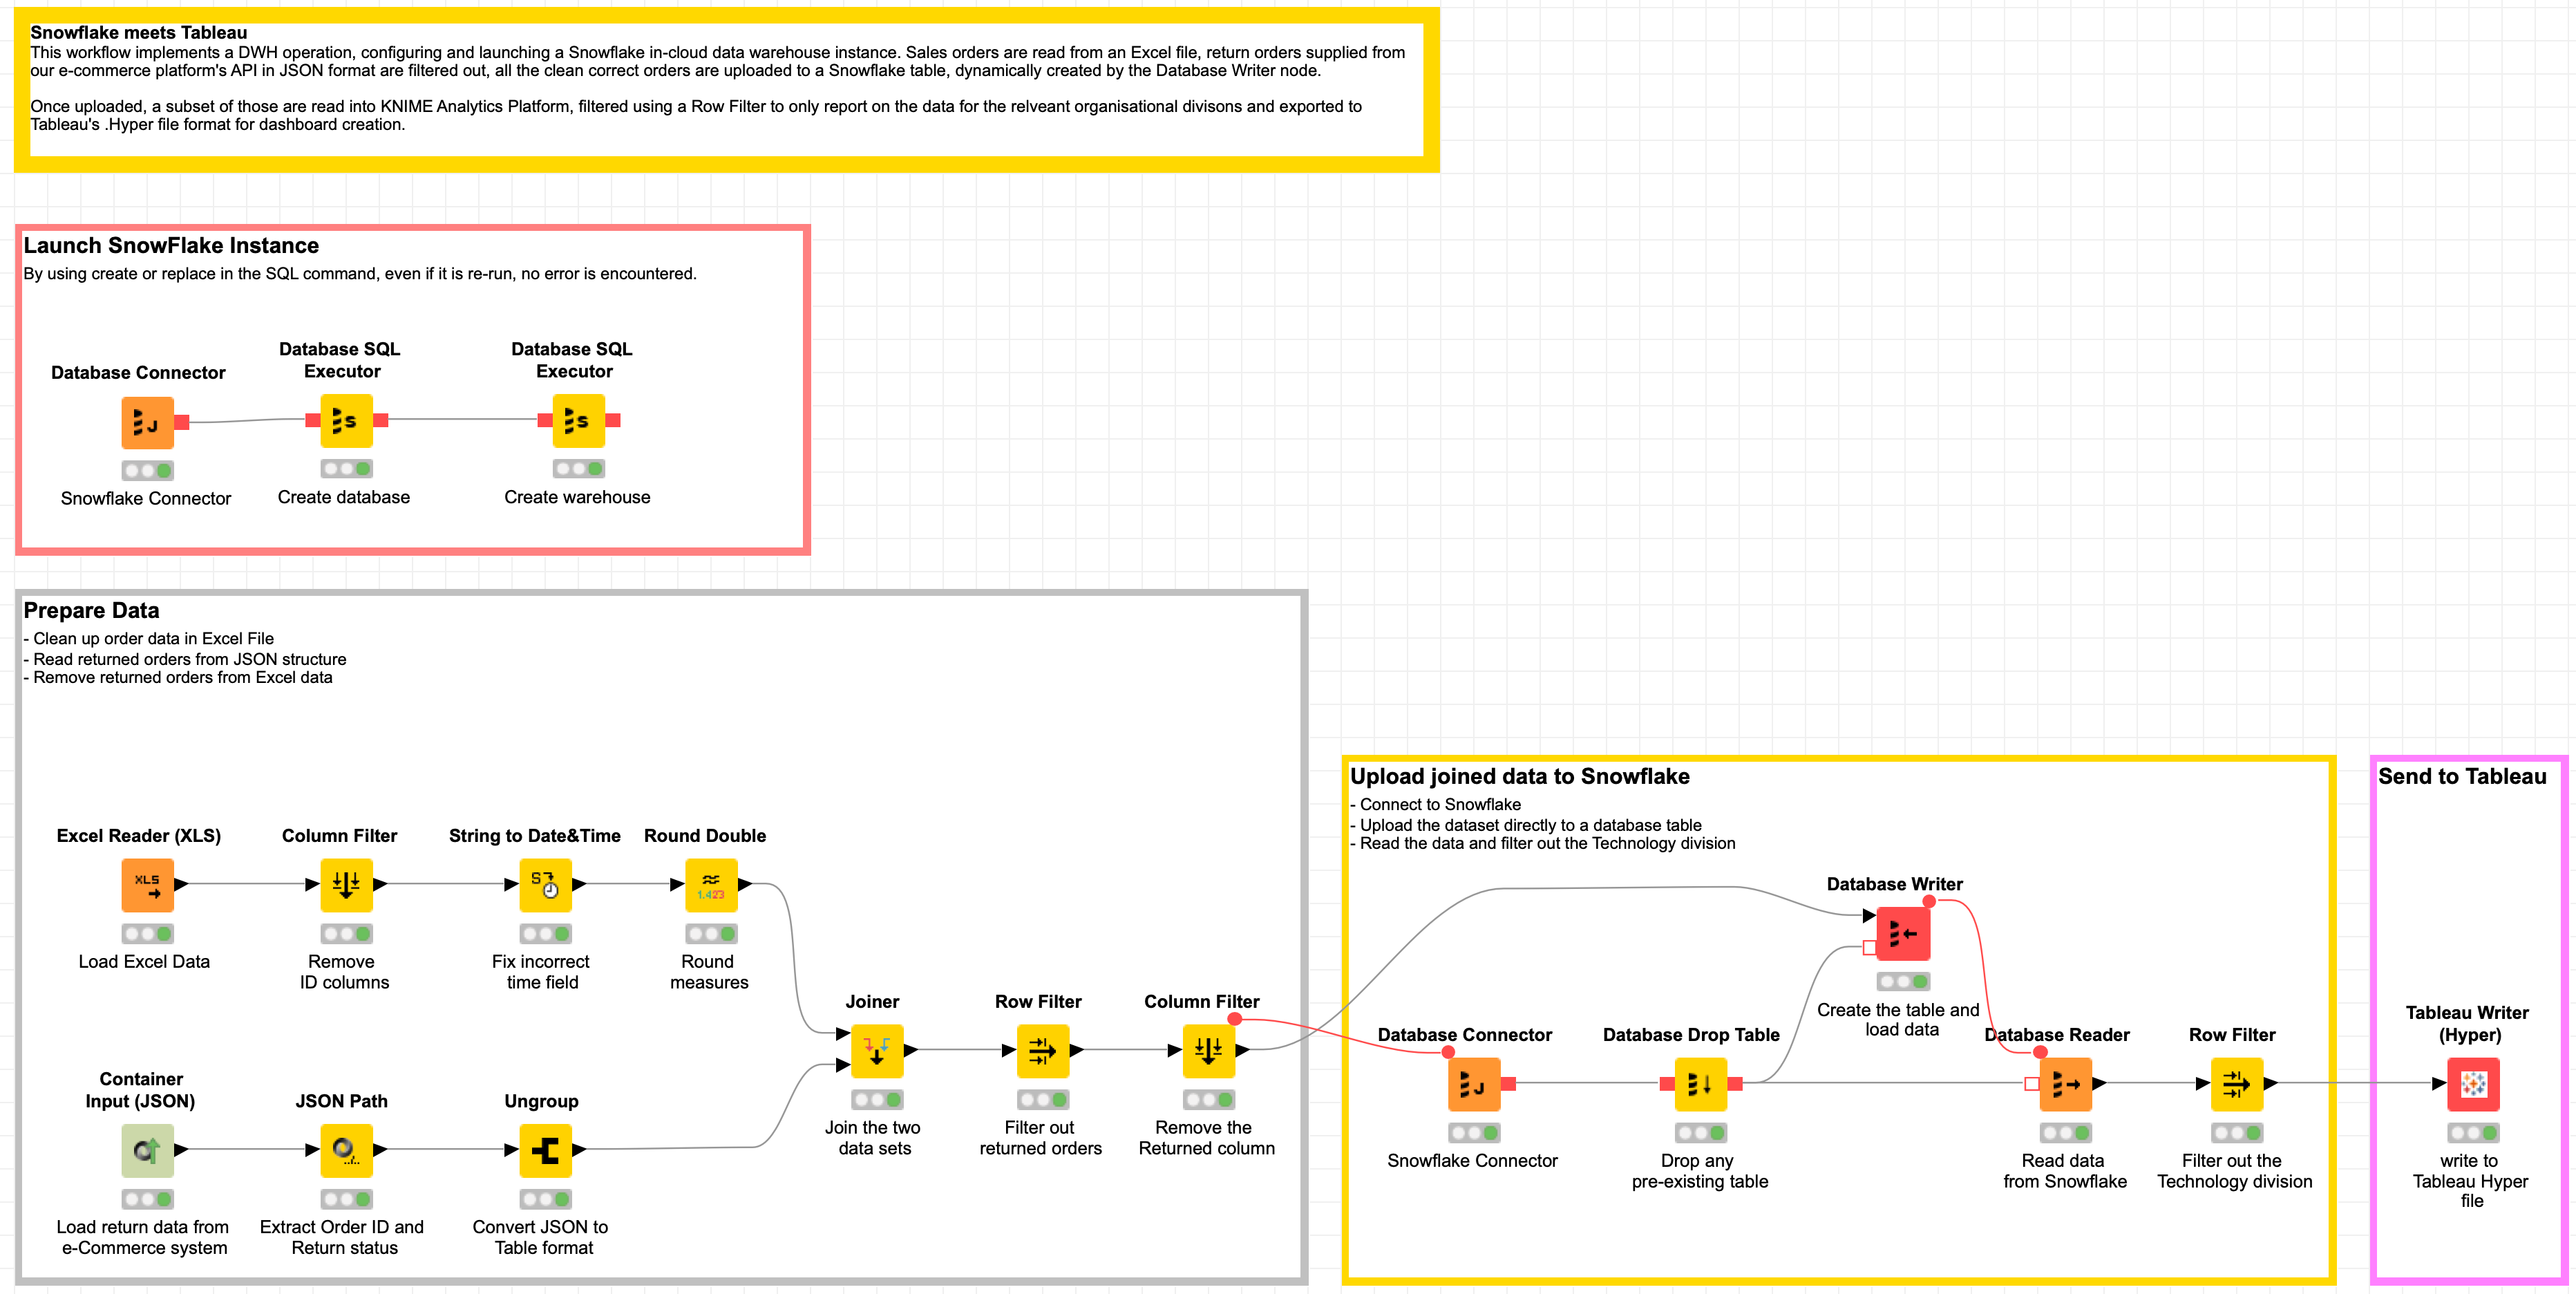
With flexibility of KNIME, you can choose whatever in-cloud data warehouse or Business Intelligence package that best aligns with your business. We will describe a DWH workflow, populating a Snowflake instance daily with sales data from Excel and filtering out all returned products provided to us from our online e-commerce platform in JSON format, downloaded via a REST API. A subset of the daily data is then exported to a .Hyper Tableau file to produce the final report.
Will Snowflake and Tableau blend?
Topic. Create an in-cloud Data Warehouse (DWH).
Challenge. Create a DWH workflow to import sales data to Snowflake, blend this data with return information from our e-commerce platform in JSON format from the REST API, and produce a report in Tableau. Will they blend?
Access Mode / Integrated Tools. Snowflake & Tableau.
The Experiment
For this experiment we will need;
- A trial or licensed installation of Tableau.
- A trial or licensed Snowflake instance.
- Snowflake’s JDBC driver.
Installing and Configuring Snowflake’s JDBC driver
Before we can do anything in KNIME Analytics Platform with Snowflake, we first need to download and install Snowflake’s JDBC driver.
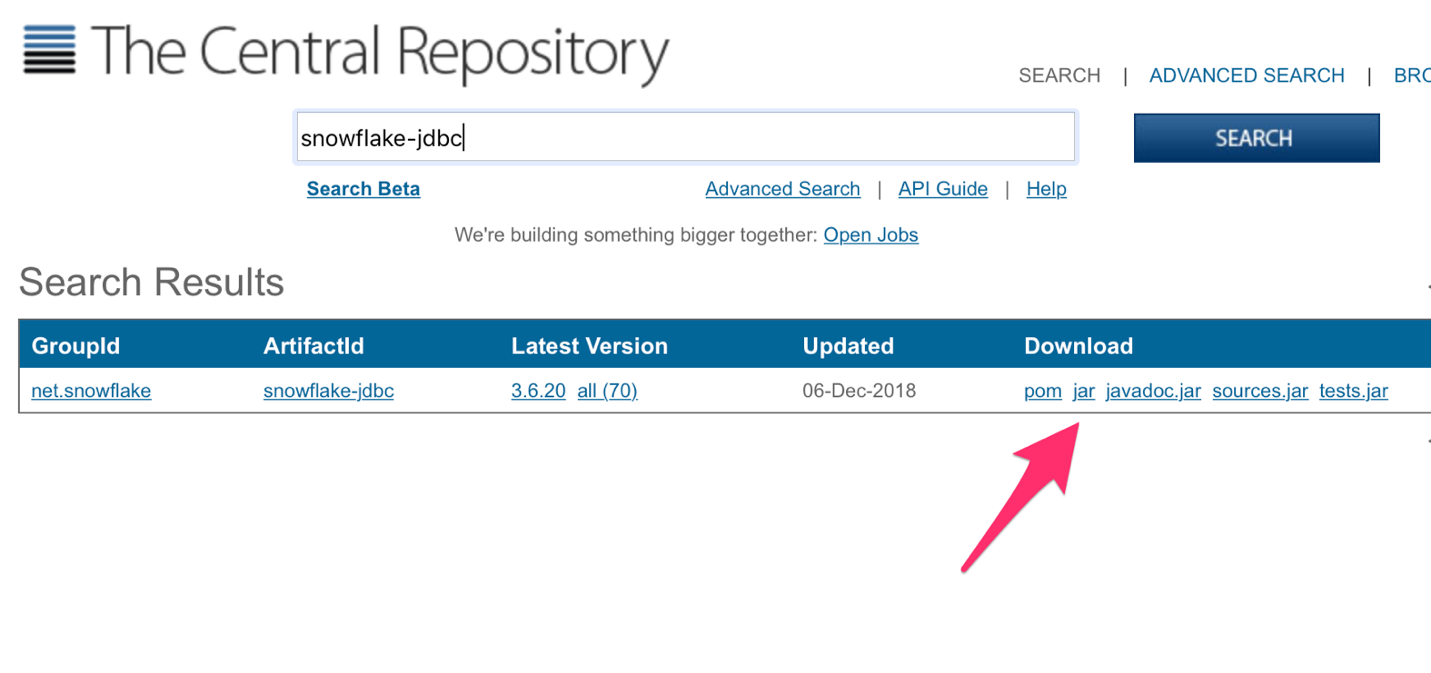
1.Download the JDBC driver from the Snowflake website via Maven and save this in a permanent directory that you’re not going to delete. You’ll want the jar file, not the javadoc.jar.
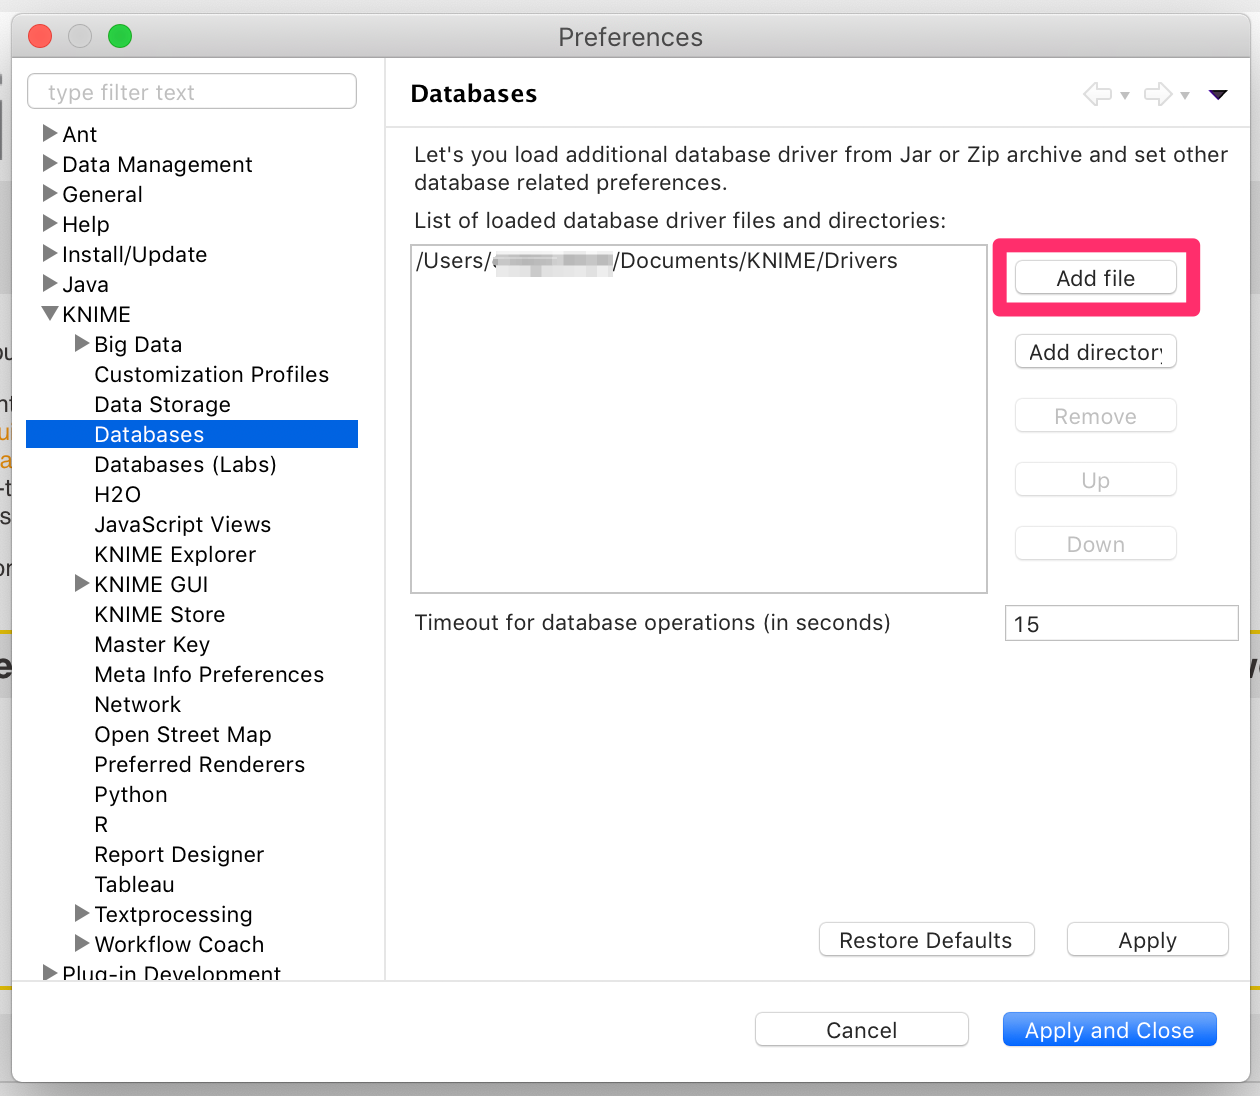
2.Open KNIME Analytics Platform and navigate to your preferences. I’m using an Apple Mac so your screen may vary slightly.
3.Expand the KNIME section and select Databases. Then select Add file and select the .jar file you downloaded in Step 1.
4.Once you’ve hit Apply and Close, validate that the JDBC Driver is correctly installed by adding a KNIME Database Connector node to a KNIME workflow.
5.Configure the Database Connector node by selecting the newly installed net.snowflake.client.jdbc.SnowflakeDriver Database driver in the dropdown.
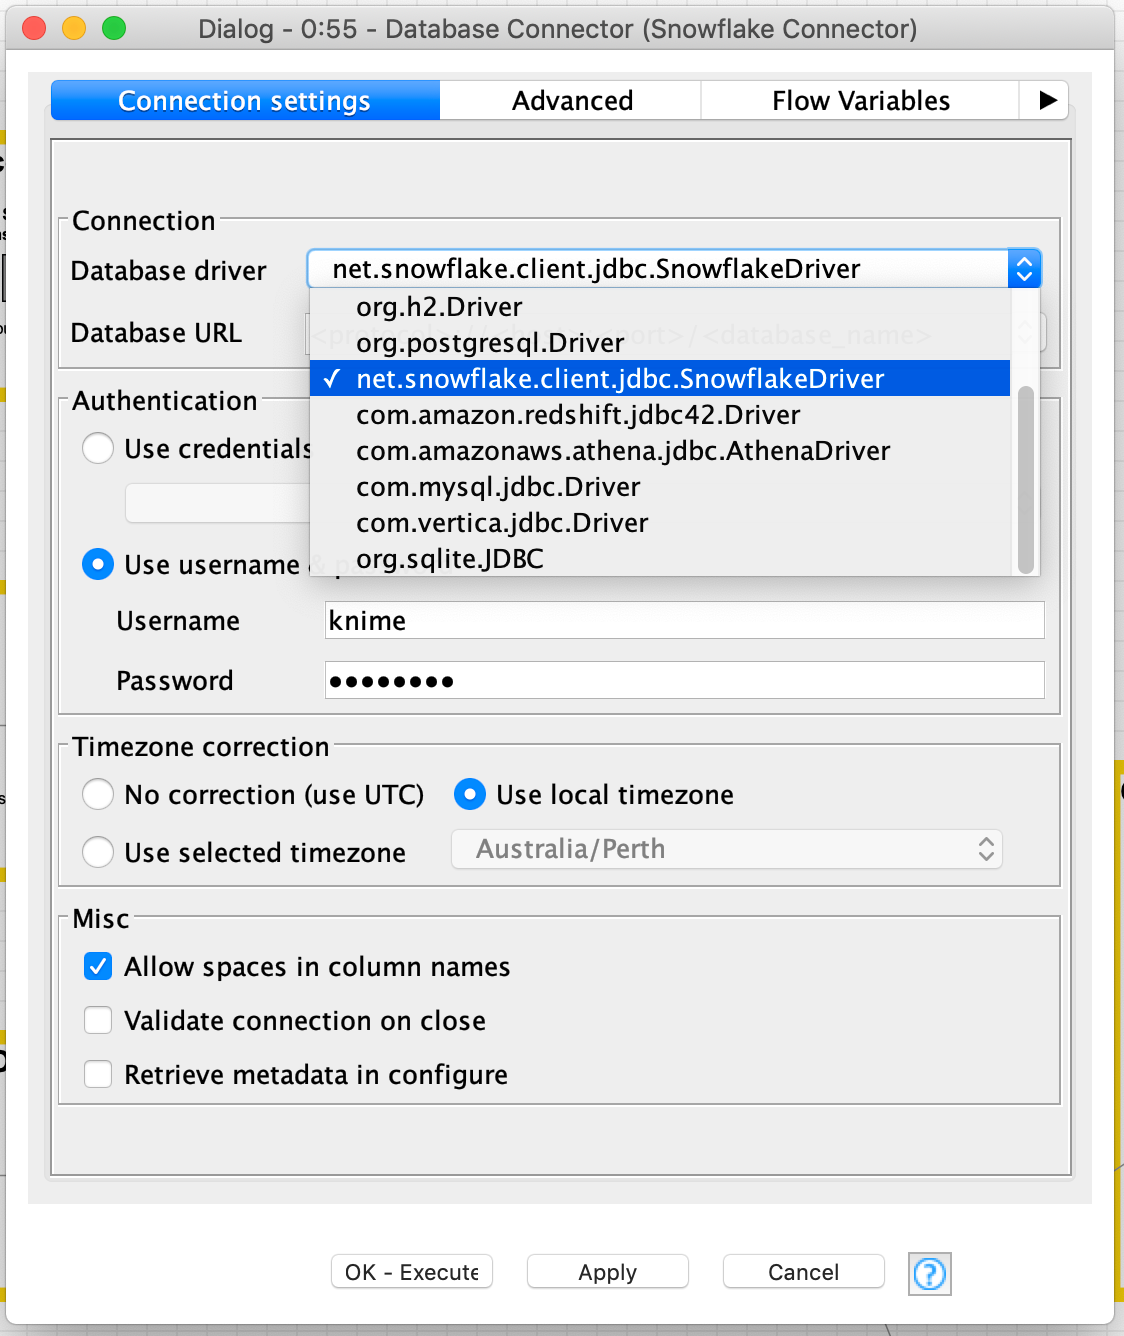
Replace the Database URL with your Snowflake instance details for example:
You can add the name of the warehouse or database to this connection string, for example;
One thing I would recommend you add to your connection URL is;
For example, a complete JDBC connection string would be;
Finally enter your username and password, hit Apply and run the node. If successful, you’ll get a green indicator light.
Launching a Snowflake Warehouse and Database
One of the great benefits of KNIME Analytics Platform is being able to create a workflow that dynamically adjusts your cloud data warehouse to optimise for ETL/ELT or Data Science processes. By leveraging the Database SQL Executor node, we can create a workflow that creates and launches a Snowflake warehouse and database before uploading and processing data.
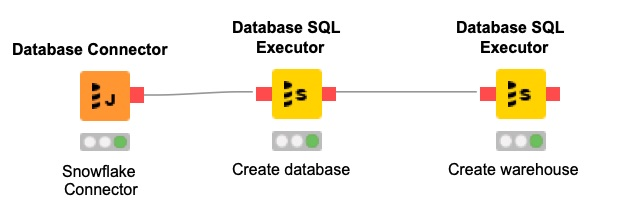
By using a string of Database SQL Executor nodes, we can create a database and data warehouse. We will directly write data to the database table from KNIME Analytics Platform but if you’re loading a large amount of data you may want to do a bulk data load.
Snowflake requires the creation of a database and a warehouse within Snowflake before we can populate the database with information. Following the same process as their ‘Snowflake in 20 Minutes’ guide we will first create the database by using the simple query;
The next Database SQL Executor node creates the warehouse;
Once executed in KNIME Analytics Platform, the objects are created and ready for us to populate with a table and data dynamically. By using create or replace in our SQL command, even if it is re-run, if they already exist no error is encountered.
The Experiment: Uploading the Data to Snowflake
Preparing the Data
We have 10,000 orders provided to us from the sales team in Excel format. We will be using the Excel file Sample – APAC Superstore.xls provided by Tableau as a sample data source. You can find this within the My Tableau Repository/Datasources folder on your local computer after you’ve downloaded and installed Tableau Desktop.
The issue we have with this data is that they also include returned orders, so we will need to filter returned orders out of the dataset if we are to get an accurate figure for Sales and Profit.
We will use the Excel Reader (XLS) node to read the Excel file and perform some simple transformations to filter out Customer and Product ID’s from the data set, convert a string to Date&Time and round our values to two decimal places.
Our returns data is imported in JSON format from our online e-commerce platform’s REST API, we will read this data into KNIME, convert it to a tabular format and blend this data with our order data to get an accurate dataset.
Joining the Datasets
We use the JSON Path node to output Order ID and Returned columns and then use Ungroup to return the dataset to a traditional looking data table for joining to the Excel data. Converting semi-structured to structured data.
Let’s join the two datasets together with a Joiner node. Because not all orders have a value for Returned we want to select Left Outer Join as the Join mode and our Top Input and Bottom Input should both be set to Order ID.
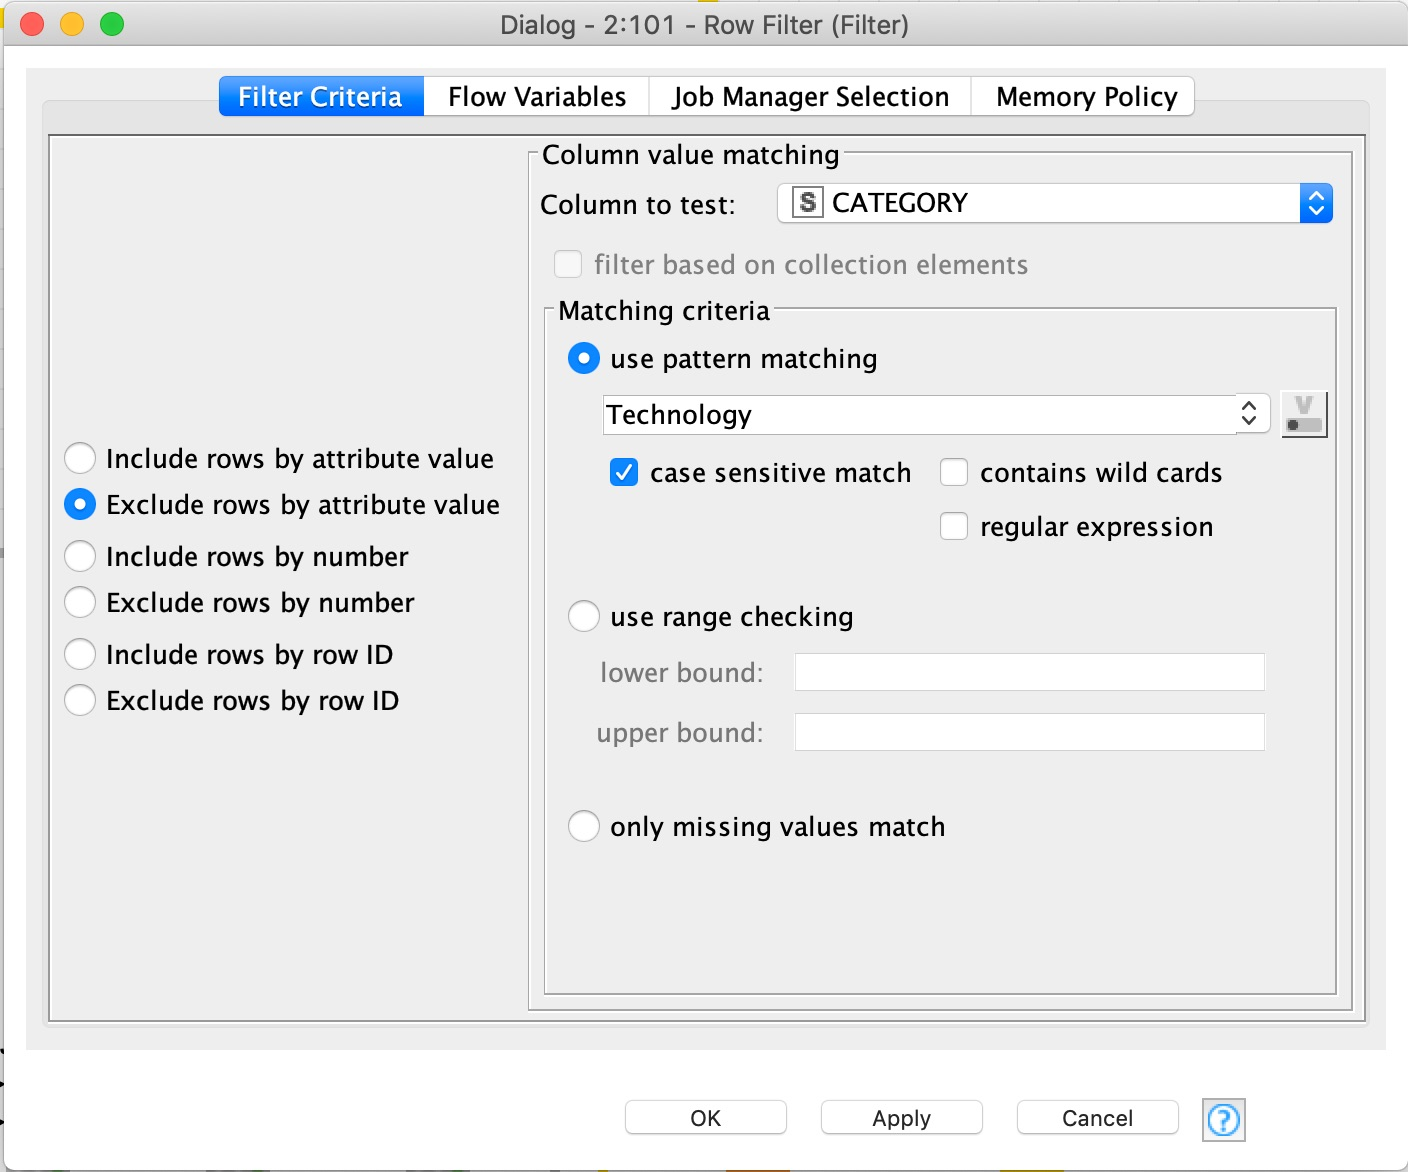
We then leverage a Row Filter node and Exclude rows by attribute value, testing the Returned column and matching using pattern matching “Yes”.
Uploading the Data to Snowflake
Dynamically creating tables based on input data is extremely powerful within KNIME Analytics Platform. This removes the headache of having to constantly edit SQL code to create tables as your dataset changes and new columns are added.
We can copy and paste the Database Connector node we used earlier. Add a Database Drop Table, dropping the table tableaudemo to drop any pre-existing table that may have been created. To prevent any failures during your workflow, configure your Database Drop Table node and uncheck “Fail if table does not exist”.
The table name I’m using in this tutorial is: tableaudemo
The Database Write node takes input from our Column Filter node to dynamically create the table based on the input. Enter the Table name used above, ensure our SQL Types are correct. You want to make sure the “Order Date” and “Ship Date” fields are set to date and increase the Batch Size under Advanced to a higher number, I’m using 1,000.
Batch Size controls the amount of records uploaded in that batch, you can play around with this number and find the size that matches your upload bandwidth.
Once you run these nodes, your table will be created and the data uploaded to your cloud data warehouse ready for Tableau reporting.
Using a Database Reader node, I can bring this data back into KNIME for validation. As I’m not interested in the Technology division, I can use a Row Filter node to filter the data set to only include the Furniture and Office Supplies division prior to exporting to Tableau in Tableau’s .Hyper format to distribute amongst my executive team.
The latest version of KNIME Analytics Platform includes nodes to write Tableau files in .Hyper format.
The Results
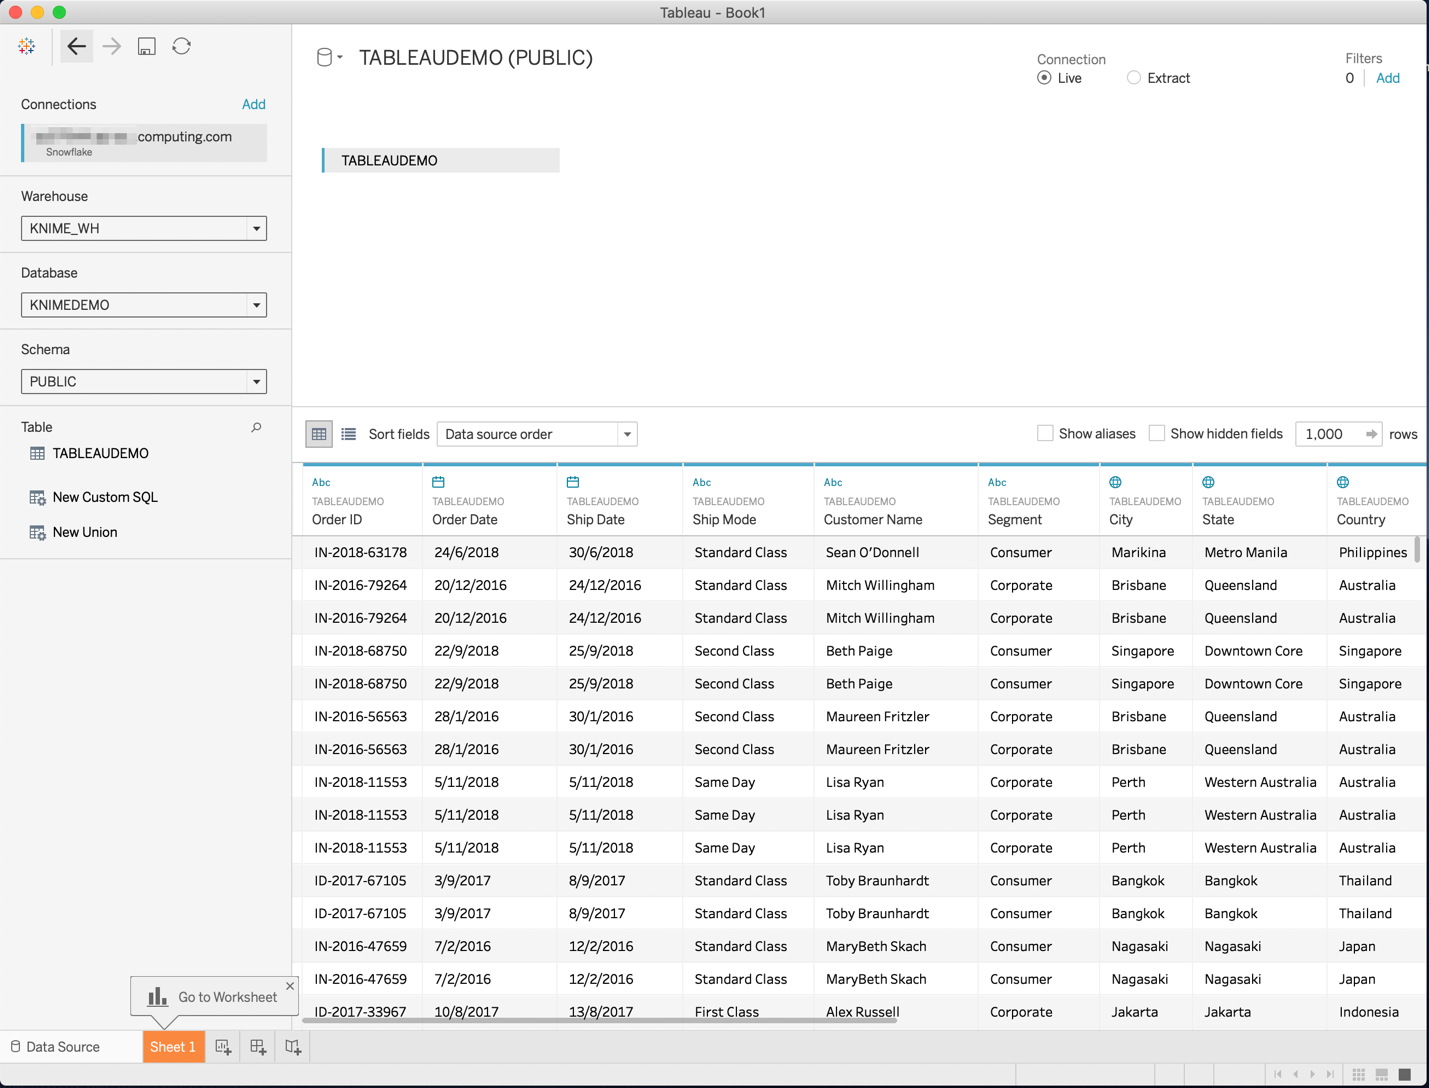
I can open Tableau Desktop and open the data directly via the exported .Hyper file contained my filtered clear data ready for my presentation.
As my requirements change and the use of data matures in my organisation, I can expand my KNIME workflows to include additional datasets, calculations or predictive modelling.
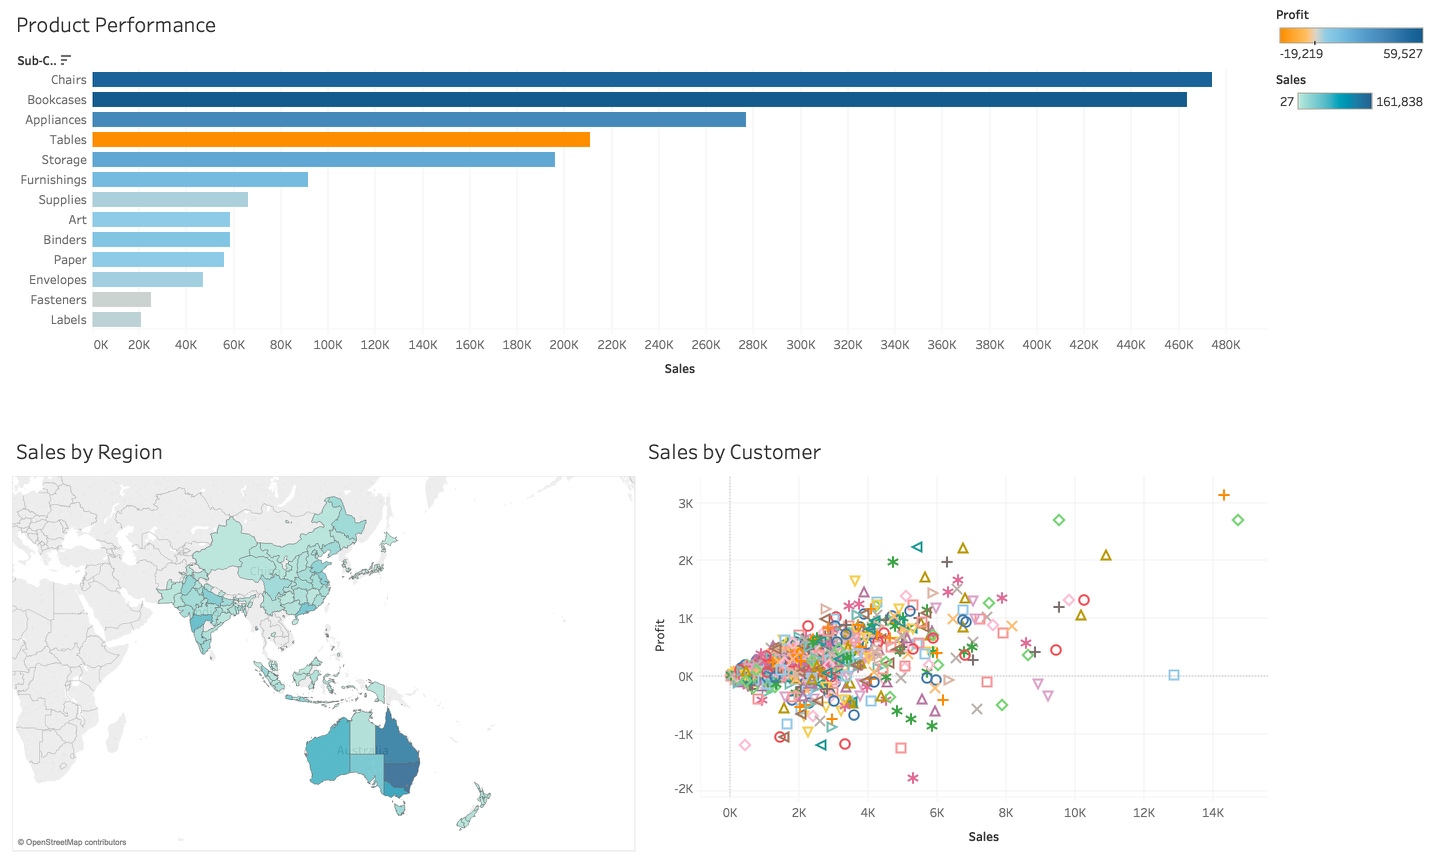
The results show that although I have a healthy amount of sales of Tables, by colour coding each bar with profit, from orange to blue, we can see that we are in fact losing money on tables.
The map highlights the concentration of sales geographically, assisting the organisation with decisions around warehousing, shipping and other logistics. We may choose for example to create a warehouse on the east coast of Australia as our sales are concentrate in this region.
Finally, our scatter plot shows customers plotted against profit and sales, this visualisation allows an organisation to pinpoint our most and least valuable customers.
Armed with this dashboard, I can share this amongst the senior leadership team, not only showing current sales but, by providing additional context, improve our insight and decision making capabilities.
References:
The workflow is available on the KNIME Public EXAMPLES SERVER here: 01_Data_Access/02_Databases/11_Snowflake_meets_Tableau
Coming Next …
If you enjoyed this, please share this generously and let us know your ideas for future blends.