
This article is a follow-up to our introductory article on the topic, “How to automate machine learning.” In this second post, we describe in more detail the techniques and algorithms happening behind the scenes during the execution of the web browser application, proposing a blueprint solution for the automation of the machine learning lifecycle.
The price to pay for automated machine learning (aka AutoML) is the loss of control to a black box kind of model. While such a price might be acceptable for circumscribed data science problems on well-defined domains, it might prove a limitation for more complex problems on a wider variety of domains. In these cases, a certain amount of interaction with the end users is actually desirable. This softer approach to machine learning automation — the approach we take at KNIME — is obtained via guided automation, a special instance of guided analytics.
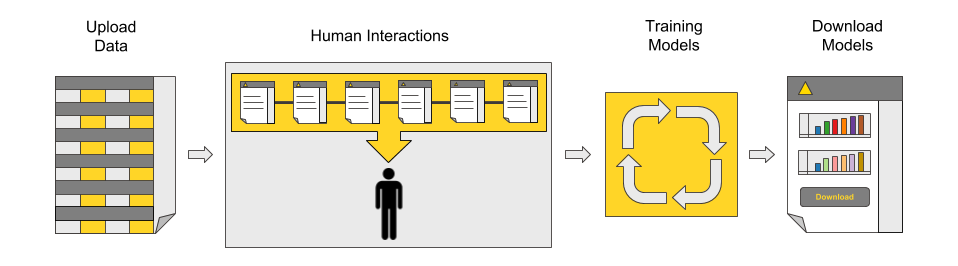
Figure 1: The main process behind the blueprint for guided automation: data upload, application settings, automated model training and optimization, dashboard for performance comparison, and model download.
As easy as the final application might look to the end user, the system running in the background can be quite complex and therefore not easy to create completely from scratch. To help you with this process, we created a blueprint of an interactive application for the automatic creation and training of machine learning classification models.
The blueprint was developed with KNIME Analytics Platform, and it is available on the KNIME Community Workflow Hub.
Guided Automation from a Web Browser
Let’s see what the guided automation blueprint looks like from a web browser via KNIME Server.
At the start, we are presented with a sequence of interaction points to:
- Upload the data
- Select the target variable
- Remove unnecessary features
- Select one or more machine learning algorithms to train
- Optionally customize parameter optimization and feature engineering settings
- Select the execution platform.
These steps are all summarized in Figure 2 below.
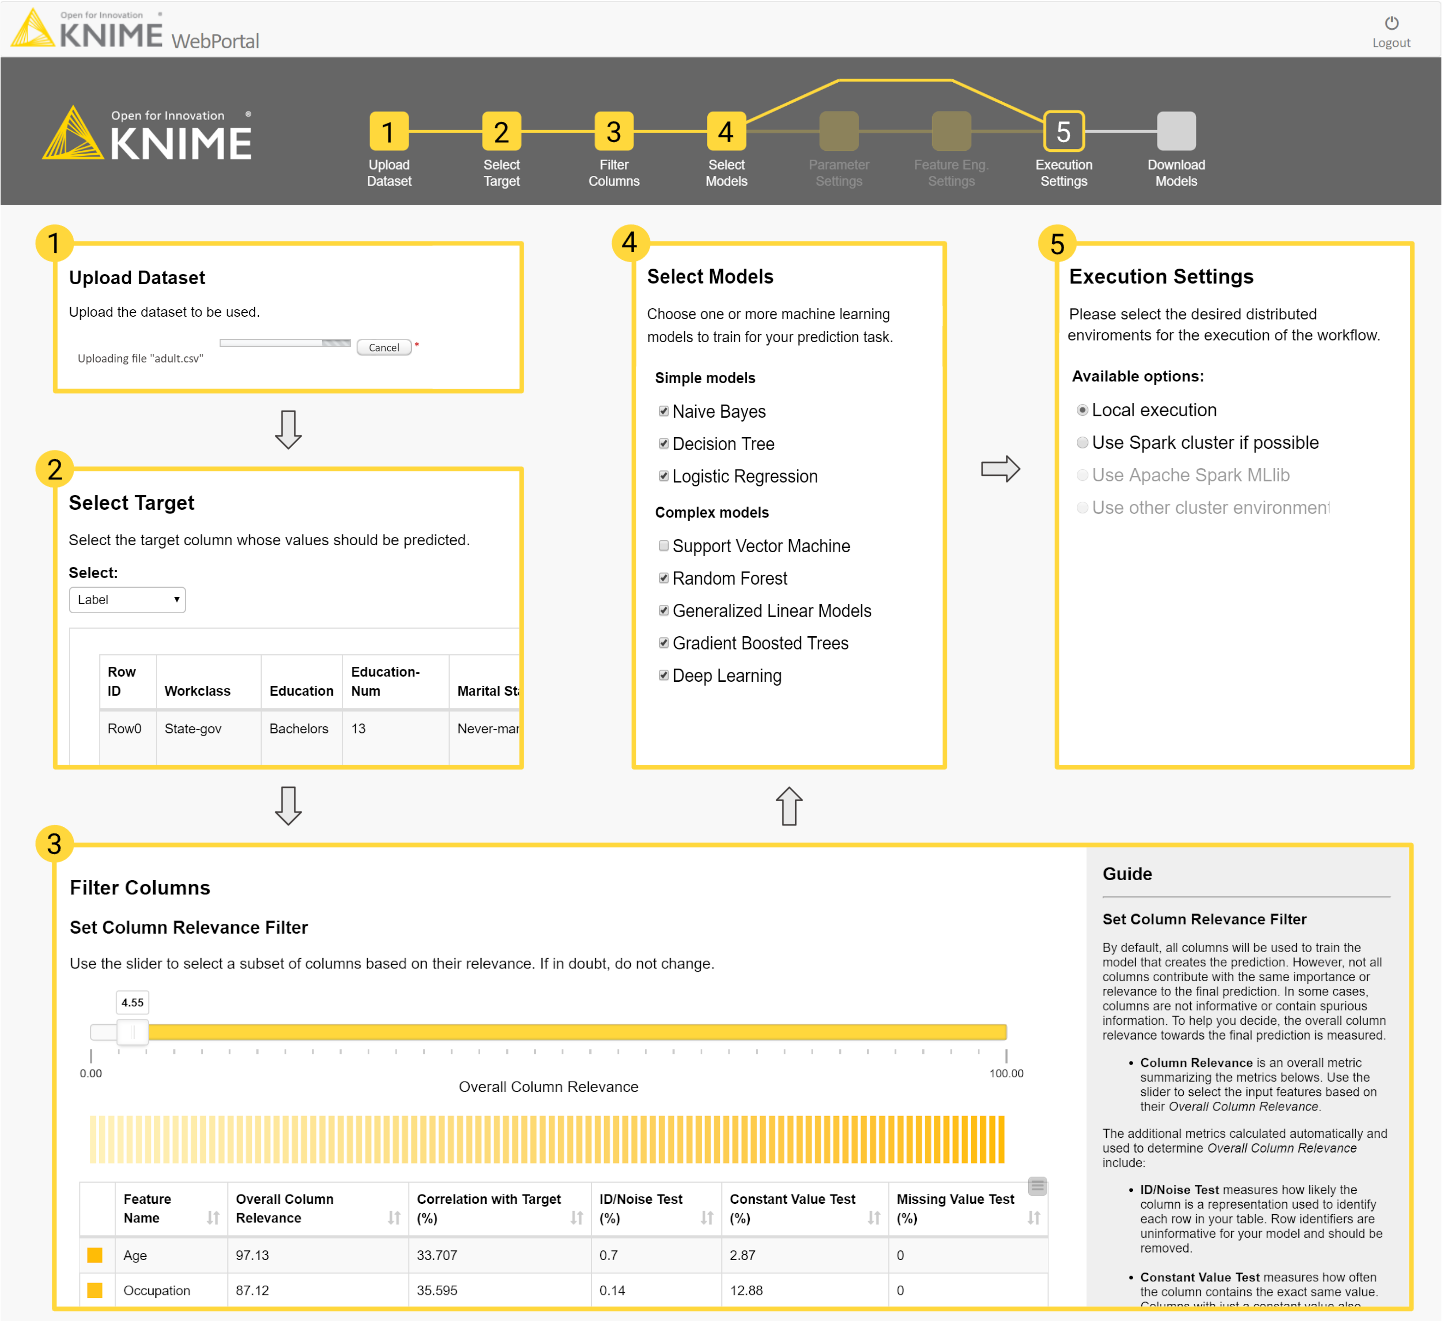
Figure 2: This diagram follows the execution of the blueprint for guided automation on a web browser: (1) upload the dataset file, (2) select the target variable, (3) filter out undesired columns, (4) select the algorithms to train, (5) define the execution environment. At the top is the flowchart that will serve as the navigation bar throughout the process.
After crunching the numbers — i.e., data pre-processing, feature creation and transformation, parameter optimization and feature selection, and final model re-training and evaluation in terms of accuracy measures and computing performance — the final summary page appears showing the model performance metrics. At the end of this final page we will find the links to download one or more of the trained models for future usage, for example, as a RESTful API in production.
For a look at the full end-user experience, you can watch the guided automation application in action in this demo video, “Guided Analytics for Machine Learning Automation.”
The Workflow Behind Machine Learning Automation
The workflow behind the blueprint is available on on the KNIME Hub here.
You can import the workflow into your KNIME Analytics Platform, customize it to your needs, and run it from a web browser on KNIME Server. In this video, you can find more details on how to access and import workflows from KNIME Examples Server to KNIME Analytics Platform. The blueprint workflow is shown in Figure 3 below.
Find everything about JavaScript and jQuery in the cheat sheets, read the JavaScript blog or use the free online tools.
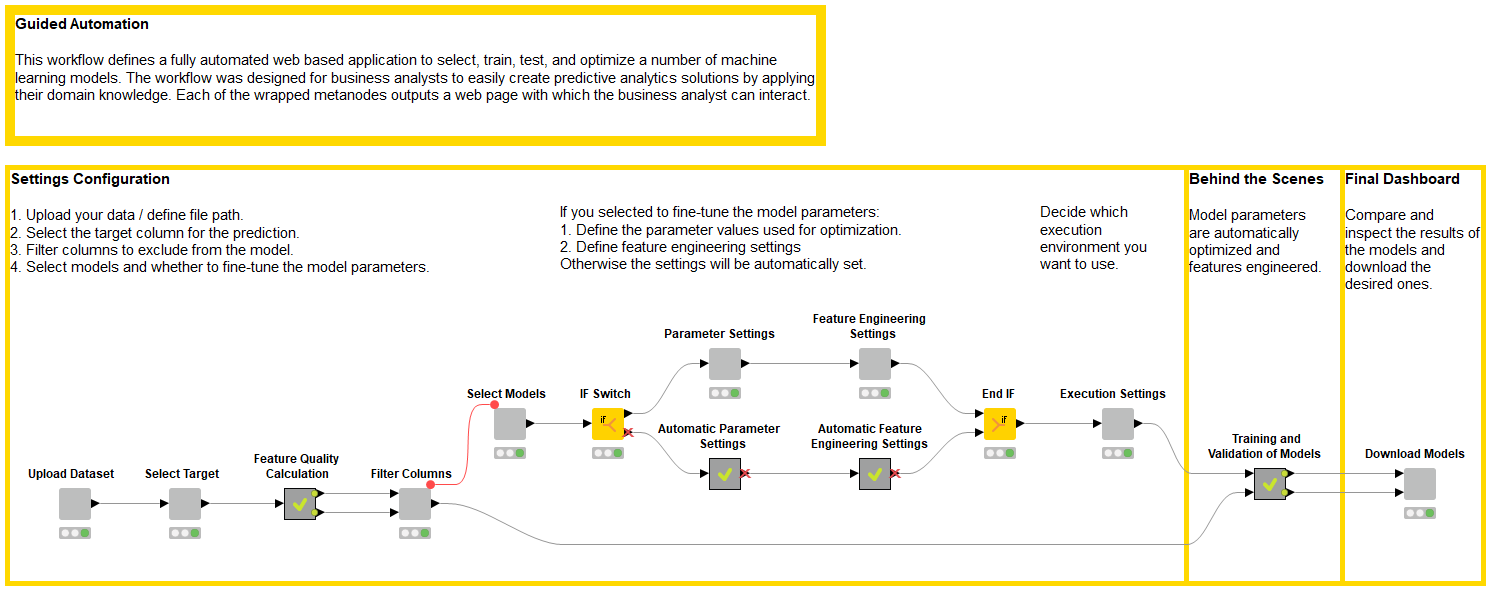
Figure 3: Guided automation workflow implementing all required steps and web pages: settings configuration, data preparation and model training, and final dashboard.
In the workflow, you can recognize the three phases of the web-based application:
- Settings configuration: Upload, select, fine-tune, and execute the automation
- Behind the scenes: Data preparation and model training
- Final dashboard: Compare and download models
Settings Configuration: Upload, Select, Fine-tune & Execute the Automation
In the first part of the workflow, each light gray node produces a view, i.e., a web page with an action request. When running the workflow via a web browser to KNIME Server, these web pages introduce as many interaction points where the end user can set preferences and guide the analytics process. You can see the nodes to upload the dataset file, select the target variable, and filter certain features.
Data columns can be excluded based on their relevance or on an expert’s knowledge. Relevance is a measure of column quality. This measure is based on the number of missing values in the column and on its value distribution; columns with too many missing values or with too constant or too spread values are penalized. Moreover, columns can be manually removed to prevent data leakage.
After that, you can select the machine learning models to train, optionally introduce settings for parameter optimization and feature engineering, and finally select the execution platform. The sequence of web pages generated during the execution of these special nodes is shown in Figure 2.
Behind the Scenes: Data Preparation and Model Training
In the following phase, the number crunching takes place behind the scenes. This is the heart of the guided automation application. It includes the following operations:
- Missing value imputation and (optional) outlier detection
- Model parameter optimization
- Feature selection
- Final optimized model training or retraining
After all settings have been defined, the application executes all of the selected steps in the background.
Data partitioning. First the data set is split into training and test sets, using an 80/20 split with stratified sampling on the target variable. Machine learning models will be trained on the training set and evaluated on the test set.
Data preprocessing. Here, missing values are imputed column by column using the average value or the most frequent value. If previously selected, outliers are detected using the interquartile range (IQR) technique and capped to the closest threshold.
Parameter optimization. The parameter optimization process implements a grid search over a selected set of hyperparameters. The granularity of the grid search depends on the model and type of hyperparameters. Each parameter set is tested with a four-fold cross-validation scheme and ranked by average accuracy.
Feature engineering and feature selection. For feature engineering, a number of new artificial columns are created according to previous settings. Four kinds of column transformations can be applied:
- Simple transformation on a single column (ex, x², x³, tanh(x), ln(x))
- Combining together pairs of columns with arithmetical operations
- Principal component analysis (PCA)
- Cluster distance transformation, where the data are clustered by the selected features and the distance to a chosen cluster center is calculated for each data point
A feature optimization process is run on the new feature set, consisting of all original features and some newly created features. The best feature set is selected by random search through a four-fold cross-validation scheme ranked by average accuracy. Parameter optimization and feature engineering can be customized. Indeed, for small datasets and easy problems, model optimization can be skipped to avoid overfitting.
Model retraining and evaluation. Finally, using the optimal hyperparameters and the best input feature set, all of the selected machine learning models are retrained one last time on the training set and reevaluated on the test set for the final accuracy measures.
Final Dashboard: Compare and Download Models
The last part of the workflow produces the views in the landing page. The node named Download Models contains prepackaged JavaScript-based views producing plots, charts, buttons, and descriptions visible in the final landing page.
ROC curves, accuracy measures, gain or lift charts, and confusion matrices are calculated on the test set and displayed in this final landing page to compare accuracy measures.
Model execution speed is evaluated during training and during deployment. Deployment execution speed is measured as the average speed to run the prediction for one input. Thus, two bar charts show respectively the model training time in seconds and the average time to produce a single prediction in milliseconds.
All dashboard views are interactive. Plot settings can be changed, and data visualizations can be explored on the fly.
The same node also produces the links at the end of the page to download one or more of the trained models for future usage.
An Easily Customized Workflow for Guided Machine Learning
We have reached the end of our journey in the realm of guided automation for machine learning.
We have shown what guided automation for machine learning is, our own interpretation for semi-automated (guided) machine learning applications, and the steps required.
We have implemented a blueprint via KNIME Analytics Platform that can be downloaded for free, customized to your needs, and freely reused.
After introducing the relevant GUI and analytics steps, we have shown the workflow implementing the application behind the web browser view.
This workflow already works for binary and multiclass classification and it can be easily customized and adapted to other analytics problems—for example, to a document classification problem or to a time series analysis. The rest is up to you.
As first published in InfoWorld.