
Is it possible to fully automate the data science lifecycle? Is it possible to automatically build a machine learning model from a set of data?
Indeed, in recent months, many tools have appeared that claim to automate all or parts of the data science process. How do they work? Could you build one yourself? If you adopt one of these tools, how much work would be necessary to adapt it to your own problem and your own set of data?
Usually, the price to pay for automated machine learning is the loss of control to a black box kind of model. What you gain in automation, you lose in fine-tuning or interpretability. Although such a price might be acceptable for circumscribed data science problems on well-defined domains, it could become a limitation for more complex problems on a wider variety of domains. In these cases, a certain amount of interaction with the end user is desirable.
At KNIME, we take a softer approach to machine learning automation. Our guided automation—a special instance of guided analytics—makes use of a fully automated web application to guide users through the selection, training, testing, and optimization of a number of machine learning models. The workflow was designed for business analysts to easily create predictive analytics solutions by applying their domain knowledge.
In this article, we will show the steps of this application from the business analyst point of view, when running from a web browser. In a follow-up article, we will show the behind-the-scenes implementation, explaining in detail the techniques used for feature engineering, machine learning, outlier detection, feature selection, parameter optimization, and model evaluation.
Guided Analytics for Machine Learning Automation
With guided automation, we do not aim to replace the driver by totally automating the process. Instead, we offer assistance, and we allow feedback to be gathered whenever needed throughout the modeling process. A guided automation application is developed by data scientists for end users. To be successful, it needs:
- Ease of use for the end user (for example, execution from a web browser)
- A set of GUI interaction points to gather preferences and display results
- Scalability options
- A flexible, extensive, agile data science software application running in the background
By flexible, extensive, and agile, we mean a data science application that allows for the assembly of complex data and machine learning operations as well as easy integrations with other data science tools, data types, and data sources.
In general, a guided automation application can automate the development of many kinds of machine learning models. In this case, we need to automate the following parts of the data science cycle to create a generic classification model:
- Data preparation
- Feature engineering
- Parameter optimization
- Feature selection
- Model training
- Model evaluation
- Model deployment
As simple as the final application might seem to the end user, the system running in the background could be quite complex and, therefore, not easy to create completely from scratch. To help you with this process, we created a blueprint of an interactive application for automatic creation of machine learning classification models.
This blueprint was developed with KNIME Analytics Platform, and you can download the workflow from the KNIME Hub.
A Blueprint for Guided Automation of Machine Learning
The main concept behind the blueprint for guided automation includes a few basic steps:
- Data upload
- Definition of application settings through human interaction
- Automated model training and optimization, based on the previously defined settings
- Dashboard with performance summary and model download
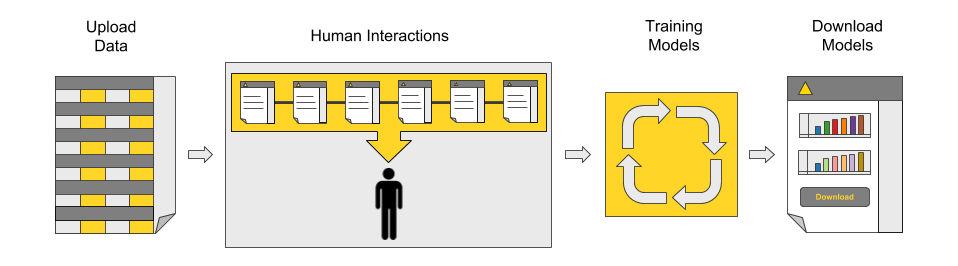
Figure 1: The main process behind the blueprint for guided automation: data upload, application settings, automated model training and optimization, a dashboard for performance comparison, and model downloads.
The current process implemented in the blueprint (Figure 1) applies to a standard predictive analytics problem. However, standard is rarely the case when we deal with data problems. Often, custom processing must be applied to the input data due to a special data type, data structure, or just pre-existing expert knowledge. Sometimes, the training and test set might need to follow specific rules, for example, the time order.
A possible customization of the previous process, including custom data preprocessing and a custom train/test split, is shown in Figure 2. You can easily apply these customizations to the blueprint in Knime Analytics Platform. Thanks to its visual programming framework, no coding is required.
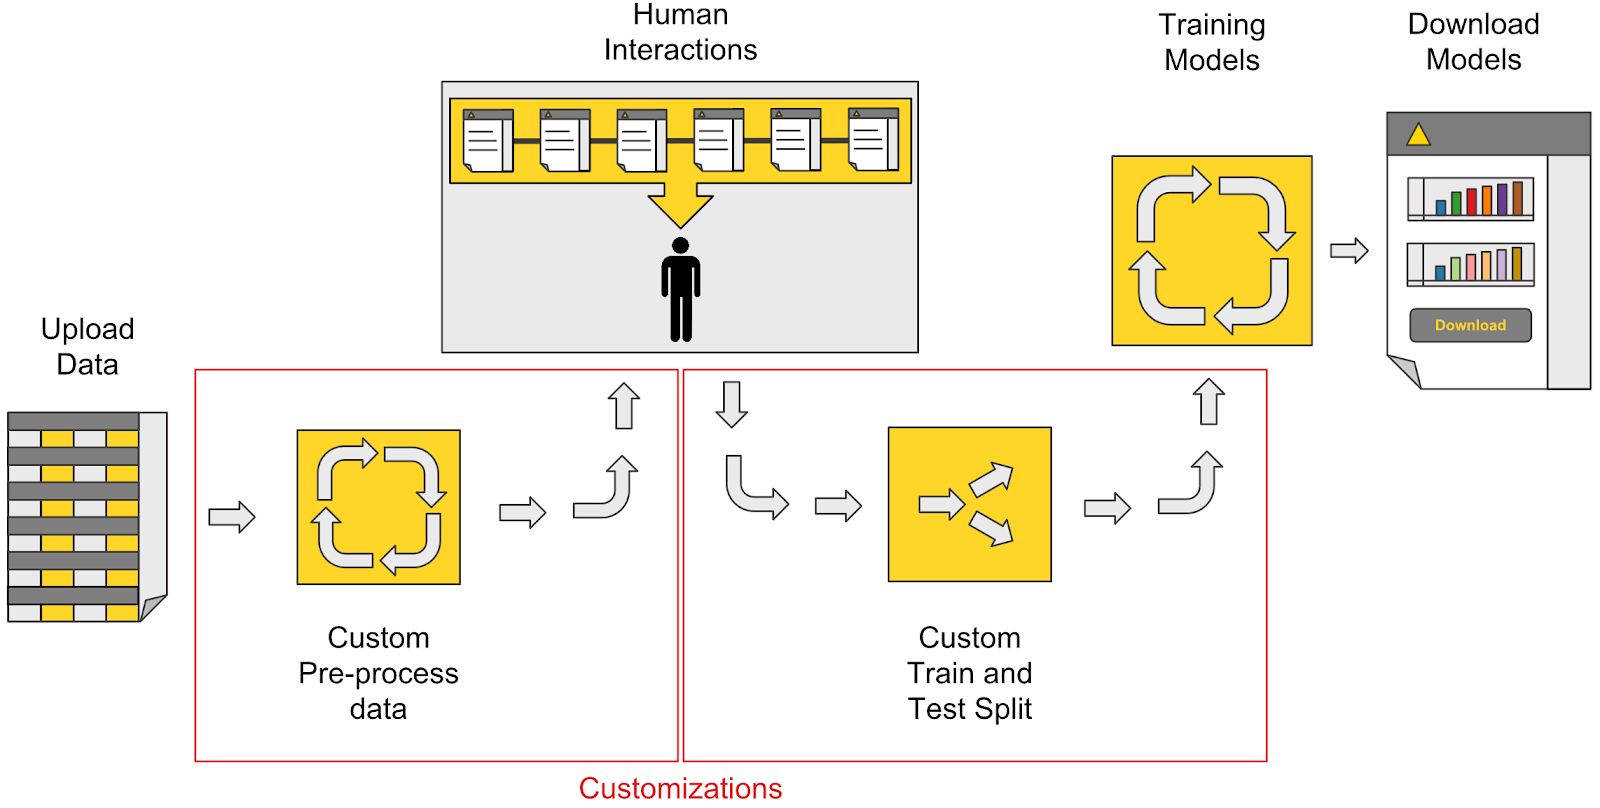
Figure 2: A possible customization of guided automation. In this case, custom data preparation and a custom train/test split are added to the process.
Guided Automation of Machine learning: Web Browser Step by Step
Let’s see what the guided automation blueprint looks like from a web browser via KNIME Server.
At the start, we are presented with a sequence of interaction points:
- Upload the data
- Select the target variable
- Remove unnecessary features
- Select one or more machine learning algorithms to train
- Optionally customize parameter optimization and feature engineering settings
- Select the execution platform
Input features can be removed based on the business analyst’s own expertise or on a measure of feature relevance. The measure of relevance we used was based on the column’s missing values and value distribution; columns with too many missing values, with values that are too constant, or with values that are too spread out are penalized.
Customizing parameter optimization and feature engineering are optional. Parameter optimization is implemented via a grid search on customizable parameter ranges. Feature engineering, if enabled, works first with a number of selected feature combinations and transformations, then with a final feature selection.
A few options are available in terms of the execution platform ranging from your own local machine (default) to a Spark-based platform or other distributed execution platforms.
The webpage template to be used for all interaction points, which are summarized in Figure 3 below, includes a description of the required task on the right and an application flow chart at the top. Future steps are displayed in gray, past steps in yellow, and the current step in just a yellow frame.
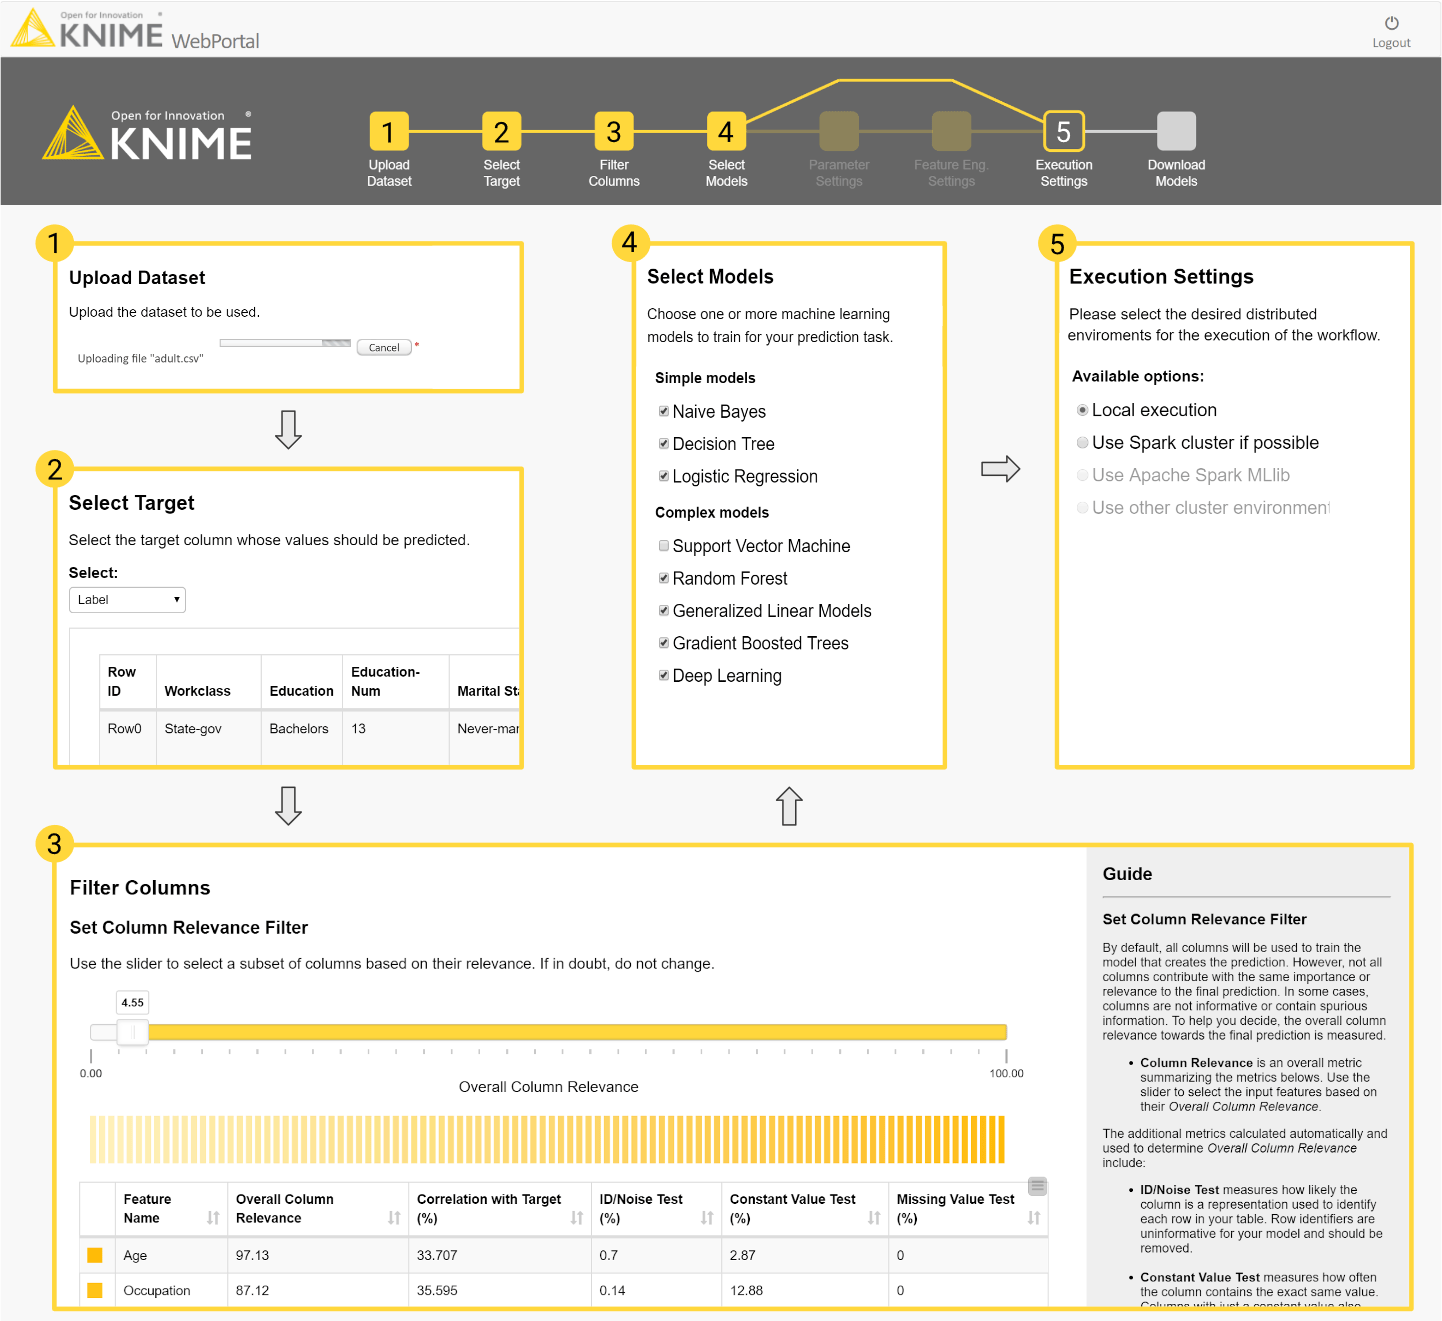
Figure 3: This diagram follows the execution of the blueprint for guided automation in the web browser: (1) upload the dataset file; (2) select the target variable; (3) filter out undesired columns; (4) select the algorithms to train; (5) define the execution environment. At the top is the flowchart that serves as a navigation bar throughout the process.
After all of the settings have been defined, the application executes the steps in the background. The selected input features will go through data preprocessing (dealing with missing values and outliers), feature creation and transformation, parameter optimization and feature selection, and final model retraining and evaluation in terms of accuracy measures and computing performance.
And here we reach the end of the guided automation journey. The application returns a dashboard where the selected machine learning models are compared in terms of accuracy and execution speed.
ROC curves, accuracy measures, gain or lift charts, and confusion matrices are calculated on the test set and displayed in the final landing page to compare accuracy measures (Figure 4).
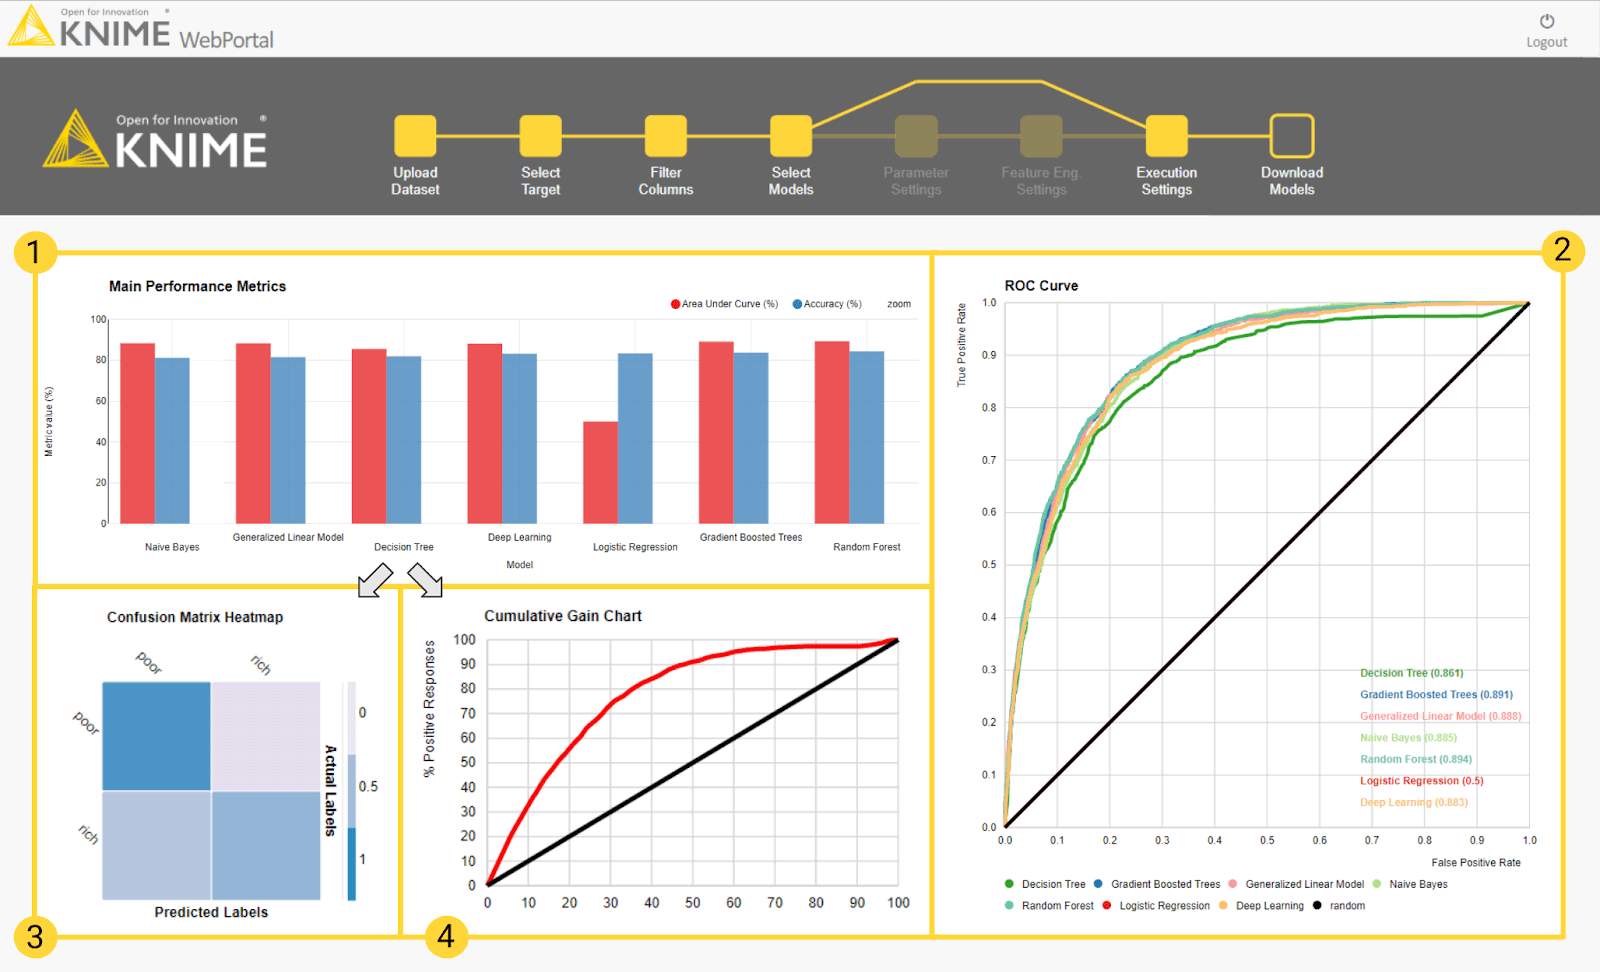
Figure 4: The dashboard in the final page of the guided automation blueprint. The top part of the dashboard covers charts for model performance evaluation. Cumulative views for all trained models include: (1) a bar chart of accuracies (blue) and AUC scores (red); (2) ROC curves. Single views for each model include: (3) a confusion matrix heat map and (4) the cumulative gain chart. Each model gets a row in the dashboard to host the single views.
Model execution speed is evaluated during training and during deployment. Deployment execution speed is measured as the average speed to run the prediction for a single input. Thus, two bar charts show, respectively, the model training time in seconds and the average time to produce a single prediction in milliseconds (Figure 5).
All dashboard views are interactive. Plot settings can be changed, and data visualizations can be explored on the fly.
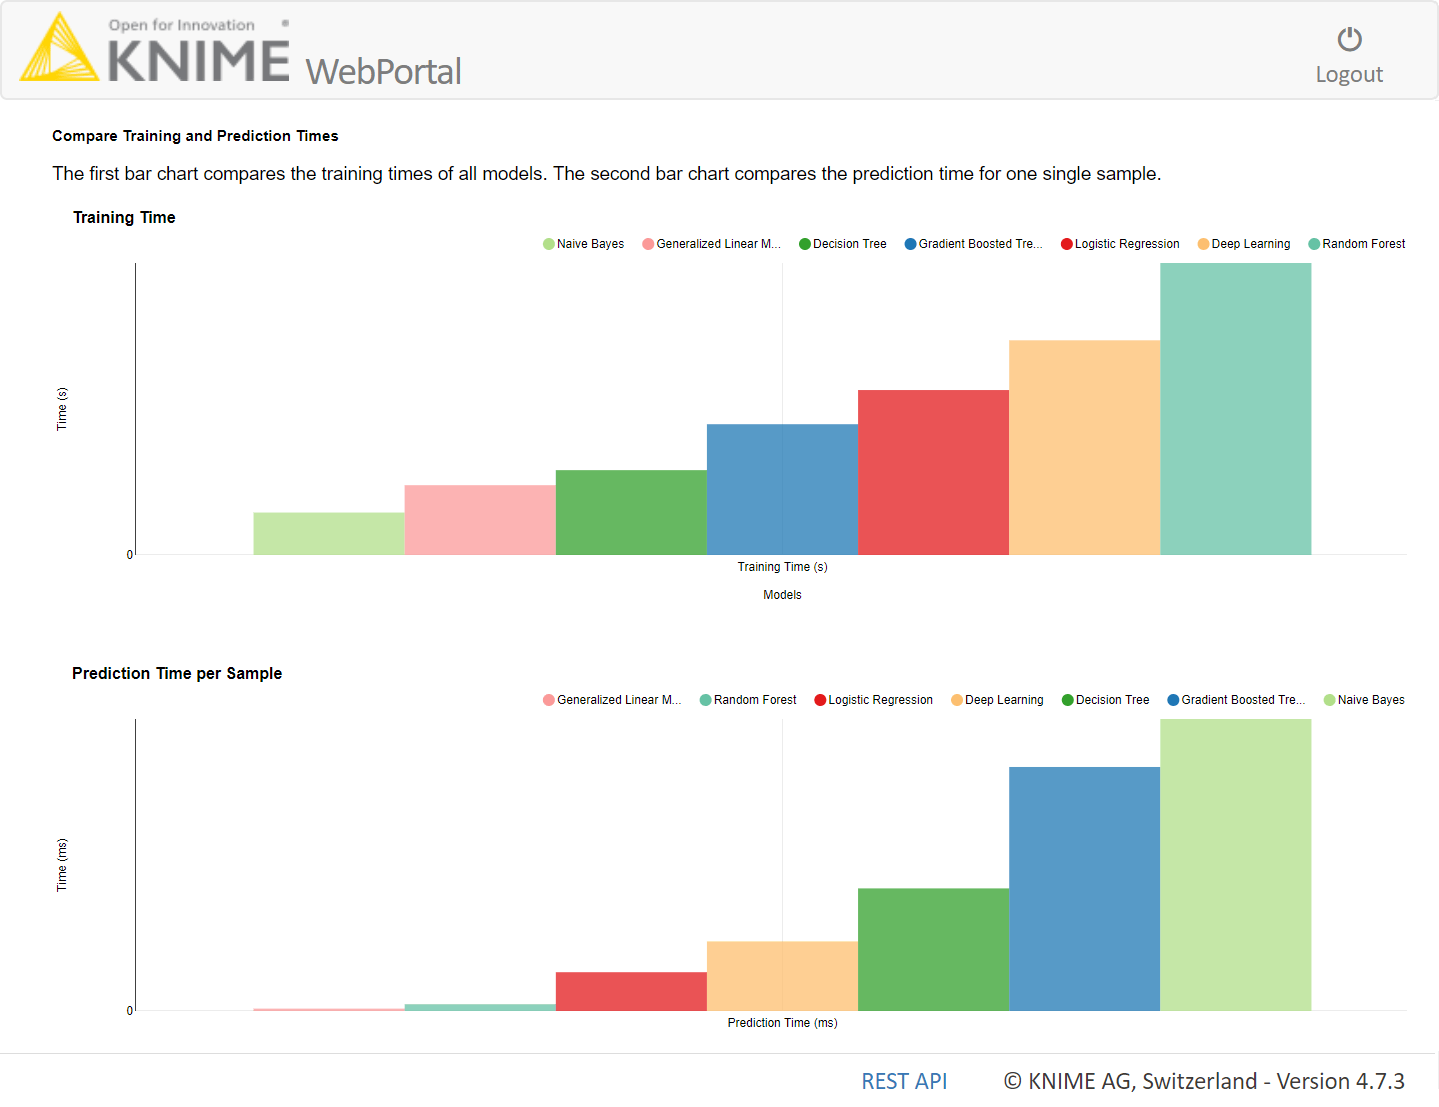
Figure 5: Here we see the part of the dashboard that displays execution speeds. The top bar chart shows the training time in seconds; the bottom bar chart shows the average time in milliseconds for a single prediction during deployment.
The models are now ready for download. At the end of the final dashboard, you will find the links to download one or more of the trained models for future usage, for example, as a RESTful API in production.
For the full guided automation experience, you can watch the application in action in this demo video: “Guided Analytics for Machine Learning Automation.”
Machine Learning for Business Analysts
In this article, we have described our blueprint for the guided automation of machine learning and illustrated the steps required. This workflow-driven web application represents our own interpretation of semi-automated (guided) machine learning applications. In our next article, we’ll look at the implementation behind the scenes.
The blueprint implemented via the KNIME Analytics Platform and described in this article can be downloaded for free, customized to your needs, and freely reused. Find it on the KNIME Hub here. A web-based workflow can be executed by running the same application on the KNIME Server.
Now, it is your turn to create a guided machine learning application starting from this blueprint. In this way, you can empower the business analysts to easily create and train machine learning models from a web browser.
As first published in InfoWorld.
Further Infos: Also interesting to check out: Paolo and Christian's talk on Guided Automation at the recent KNIME Spring Summit in Berlin.