
One of the main features of KNIME Analytics Platform is the capability to build reproducible workflows where it is easy to understand what is going on even if you have not created the workflow yourself or if you have not looked at it for some time. This facilitates sharing your work or running an analysis with different data sets multiple times with only one click. As a bioinformatician, I often use different command line tools with particular parameters in a particular sequence. Using KNIME, I can easily create a pipeline of those tools which not only saves me a lot of time, it also ensures quality, as I can simply look at the workflow and verify that I used the correct parameters. Additionally, I can combine this with other built-in functionality in KNIME such as creating interactive visualizations to investigate the results.
With access to KNIME Server, the possibilities expand even further. I can make the results of my analysis - with interactive interaction points - available to the domain expert via the KNIME WebPortal. That domain expert, in turn, needs not to know anything about KNIME or the processes running under the hood. She or he can simply interact with the data through web pages.
Topic: Today, we will create a reproducible workflow for a typical bioinformatics application: variant prioritization. For that, we will combine classic command line tools with built-in functionality in KNIME Analytics Platform including shared components, REST Services, and interactive visualizations. Moreover, we will make the results available for interactive investigation as a browser-based data app via the KNIME WebPortal.
Variant Prioritization
A variant refers to a specific region of the genome that differs between two genomes. This can either be a single base, or even big chunks of thousands of bases (insertions/deletions). Analyzing and interpreting those variants can lead to improved patient care, surveillance, and treatment outcomes1. As we have learned in previous blog posts about Sequence Motifs and Mutations and Gene Expression Data Analysis, this variation yields different effects of varying impact. Some lead to no observable effect while others can cause severe genetic diseases. Finding disease-causal variants among large numbers of variants in a human genome remains a major challenge in next-generation sequencing data analysis. Because of the complexity, Cooper (2011) refers to this as a search for "needles in stacks of needles."2 Filtering and annotating the variants from such experiments is an important step towards understanding the functional consequences of variants.
One of the most frequently used formats to store variant information is the Variant Call Format (VCF). The VCF format is specifically designed to store complex genetic variation data in an efficient and concise way. Due to its condensed structure, mining those files is not a straightforward task, and there are several command line tools for filtering and querying information in VCF files such as VCFtools3 and BCFftools. Moreover, tools such as the Variant Effect Predictor (VEP)4 are used for annotation and prioritization of genomic variants.
The VCF file5 we are using today is based on data from the 1000 genomes project, to which we additionally added a known mutation in the HBB gene leading to a recessive disease. Our ultimate goal is to distinguish disease-causal variants from non-causal ones in our VCF file. The variant prioritization procedure requires biological/biomedical reasoning, and biologists and clinicians are increasingly motivated to handle the task themselves6. Therefore, we make the results available as an easily accessible web application through the KNIME WebPortal where the domain expert can interact with the data and further annotate the results.
Variant Prioritization Workflow
With KNIME Analytics Platform, it is very easy to combine different tools and sources of information. Today, we combine classic command line tools with built-in functionalities in KNIME Analytics Platform including shared components and interactive visualizations in one reproducible workflow.
The Reproducible Variant Prioritization workflow (Figure 1) consists of three main steps:
- Filter Variants using the command line tools Bcftools and VCFtools
- Predict Variant Effects through a shared component using Ensembl’s Variant Effect Predictor (VEP) via their REST API
- Create an interactive view through which the domain expert can then filter and manually annotate variants
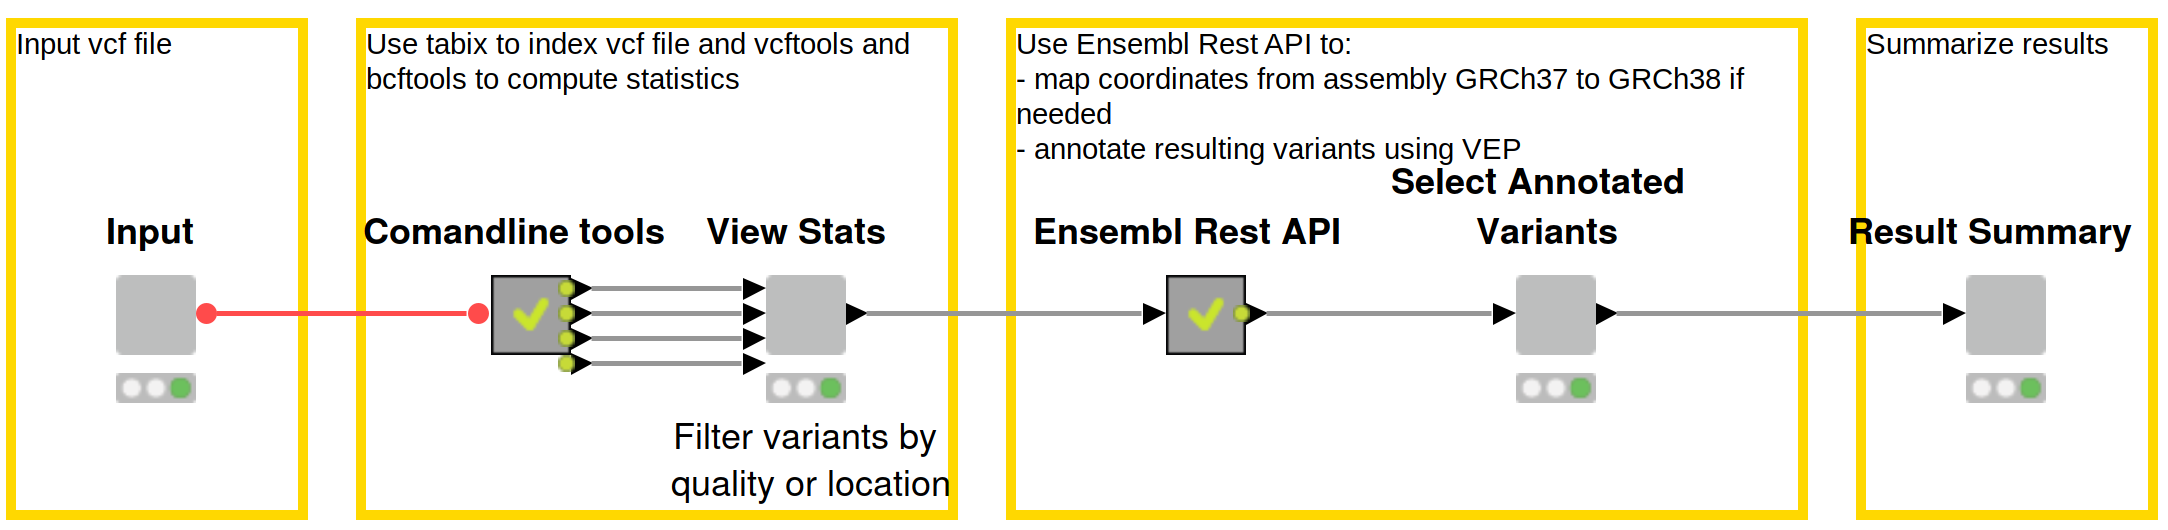
Figure 1: Reproducible workflow for variant prioritization with domain expert interaction. First, the data is filtered using common command line tools, and statistics about the data are displayed in an interactive view. Effects of the variants are subsequently predicted using Ensembl’s REST API, and results are made available to the domain expert for review and selection. Lastly, final results are summarized including the intermediate files, the final result file, and all commands used throughout the workflow. Download this workflow from the KNIME Hub here.
Using the KNIME WebPortal, the results of each step can be easily accessed through web pages. The domain expert can interact with the data without having to worry about the tools under the hood. Furthermore, classic bioinformatics command line tools typically run on a Linux environment and through the KNIME WebPortal one can easily access the workflow from Windows.
With KNIME Server 4.11.0, we redesigned the WebPortal frontend with a focus on user interface and user experience. In the following we will use the new WebPortal to make our workflow accessible to the user with domain expertise but not necessarily knowledge of command lines or KNIME.
We start with a VCF file that the user uploads. The user also has to specify the output directory and a prefix for the result files. When running the workflow on your local Linux machine, the output directory is a local path. When running it on the Server, it should point to a directory on the Server. All results (intermediate and final) will be stored in the specified directory and start with the given prefix. In addition, the user should select the assembly that was used to create the data from a drop-down menu. Finally, the user must decide if Insertions/Deletions (Indels) and heterozygous variants should be removed. For many use cases, it is good practice to analyze Indels separately. Heterozygous variants can be removed if we are investigating, for example, a recessive genetic disorder. In our case, the data is based on coordinates from the GRCh37 assembly version and we remove Indels and heterozygous variants.
These inputs are then used to create command line commands, which are utilized to compute statistics of the data and to filter it by different criteria in the following steps:
- To enhance performance, we use bgzip and tabix to compress and index data
- We use BCFtools to compute basic statistics about the data including the number of heterozygous and homozygous variants.
- Depending on the user input we filter the data in two steps:
- We keep only variants that are homozygous using BCFtools if that option was selected in the beginning.
- If selected by the user, we remove Insertions/Deletions (Indels) using VCFtools.
- We use VCFtools to extract the Phred quality scores. The Phred Score is logarithmically related to the base-calling error probabilities. For example, if Phred assigns a quality score of 30 to a base, the chances that this base is called incorrectly are 1 in 1000.
The specific commands used are also summarized in the last step of the workflow (see Fig. 5). In order to run the workflow, you need to install the relevant command line tools.
We display the results in an interactive view, as can be found in Figure 2. The user can see the number of homozygous and heterozygous variants for the sample under investigation in the table view. In the parallel coordinates plot, one can select a region of interest and exclude/include variants based on their quality. Making a selection based on domain expertise will also decrease the runtime of the next step, which can take a while as there are REST calls involved. If an error occurs in the command line tools, we display those at the bottom of the interactive view.
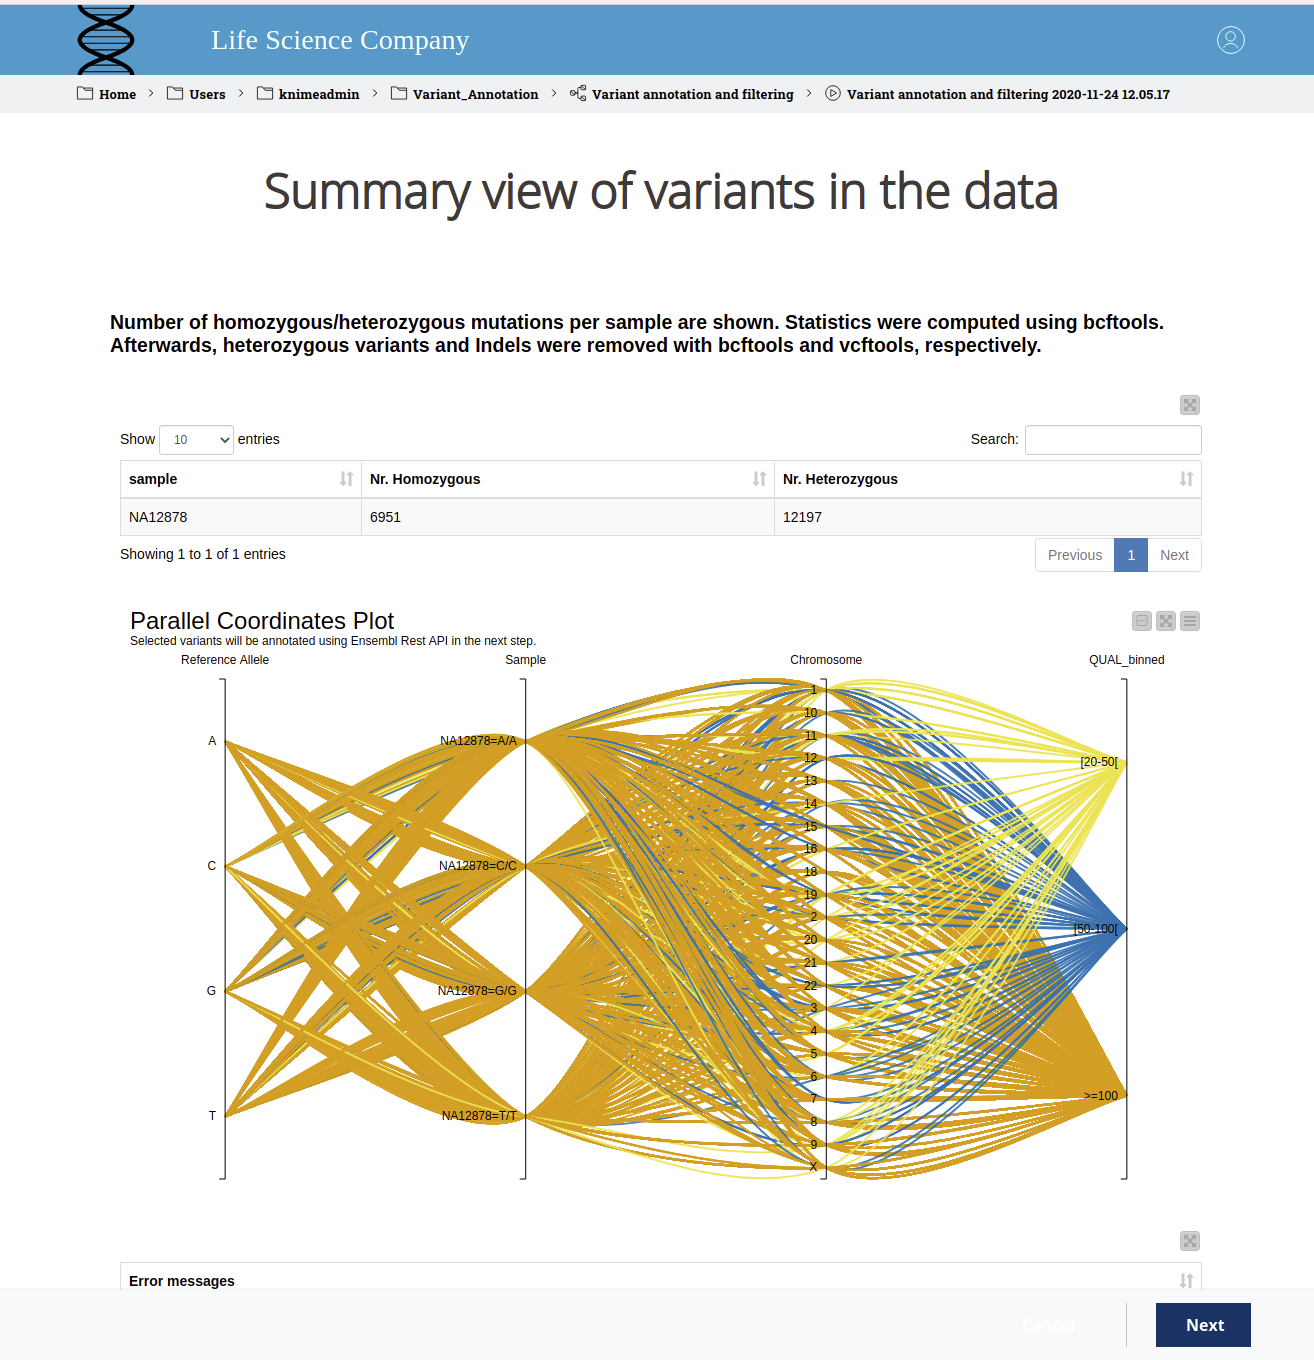
Figure 2. WebPortal view of variants in the data. The sample ID and the number of homozygous and heterozygous variants are displayed in a table. In the parallel coordinates plot, the reference allele, the sample, and the deviating allele, the region and the binned quality score are shown. The colors indicate the binned quality score. The user can select a region of interest and exclude/include variants based on their quality.
As mentioned above, variants yield different effects of varying impact. Variants that alter the amino acid sequence for which they encode or variants located in regulatory regions often have a stronger impact than variants that reside, for example, in intergenic regions. Those differences can be used to predict the influence of a variant. In the next step, we do exactly this with the Variant Effect Predictor (VEP) from Ensembl. Instead of using the command line, we now retrieve information from Ensembl’s REST API.
In particular, we employ two GET Requests in order to:
Convert coordinates from one assembly to another
Converting coordinates from one genome assembly version to another is a common task in bioinformatics. In our example, our initial VCF is based on coordinates from the GRCh37 assembly version. However, the current version that we want to use in the next step is GRCh38. Hence, we created a shared verified component based on Ensembl’s REST API (http://rest.ensembl.org/documentation/info/assembly_map) that converts the coordinates between different assembly versions of the human genome. The component can be accessed via the KNIME hub here.
Retrieve variant annotations from Variant Effect Predictor (VEP)
We determine the effect of genetic variants using Ensembl's Variant Effect Predictor (VEP) (https://rest.ensembl.org/#VEP). To make this functionality easily accessible, we created a verified shared component, you can find it from the KNIME hub here.
The retrieved annotations include the most severe predicted effect of the variant (most severe consequence), which we display in an interactive table view (see Figure 4). Those consequences are calculated per transcript, so we include the transcript information as well. We complete the created view by adding an explanatory image describing the different consequences (Fig.3):
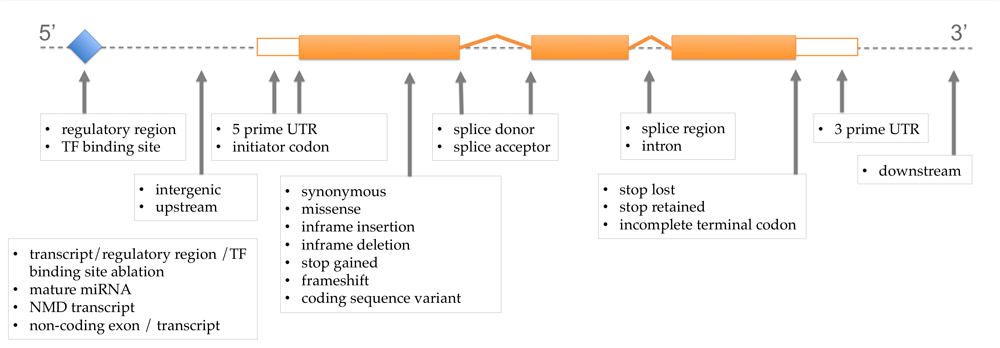
Figure 3. Explanatory Image of Variant Consequences. This image is taken from Ensembl http://www.ensembl.info/2012/08/06/variation-consequences/ and illustrates the various impacts of variants depending on where they occur in the genome. The terms used are based on the Sequence Ontology (SO) for the variation consequences.
Additionally, we extract the allele frequency in the 1000 genomes project from the Ensembl REST API. The minor allele is the less common allele for a single nucleotide polymorphism (SNP), the frequency gives you an idea of how common a SNP is. Filtering for this frequency is motivated by the fact that common variants are less likely to be disease-causal. Therefore, we introduce a range slider which enables the user to interactively filter by minor allele frequency in the 1000 genomes project.
Furthermore, a recent project analyzed 125,748 exomes and 15,708 genomes from human sequencing studies and aggregated the data into the Genome Aggregation Database (gnomAD)7. We add an additional range slider where the user can filter for the frequencies in this data set as well.
Moreover, we extract the SIFT (Sorting Intolerant From Tolerant) score from the Variant Effect Predictor. The SIFT Score indicates whether an amino acid substitution affects protein function8, it ranges from 0 to 1, with low scores indicating a damaging effect.
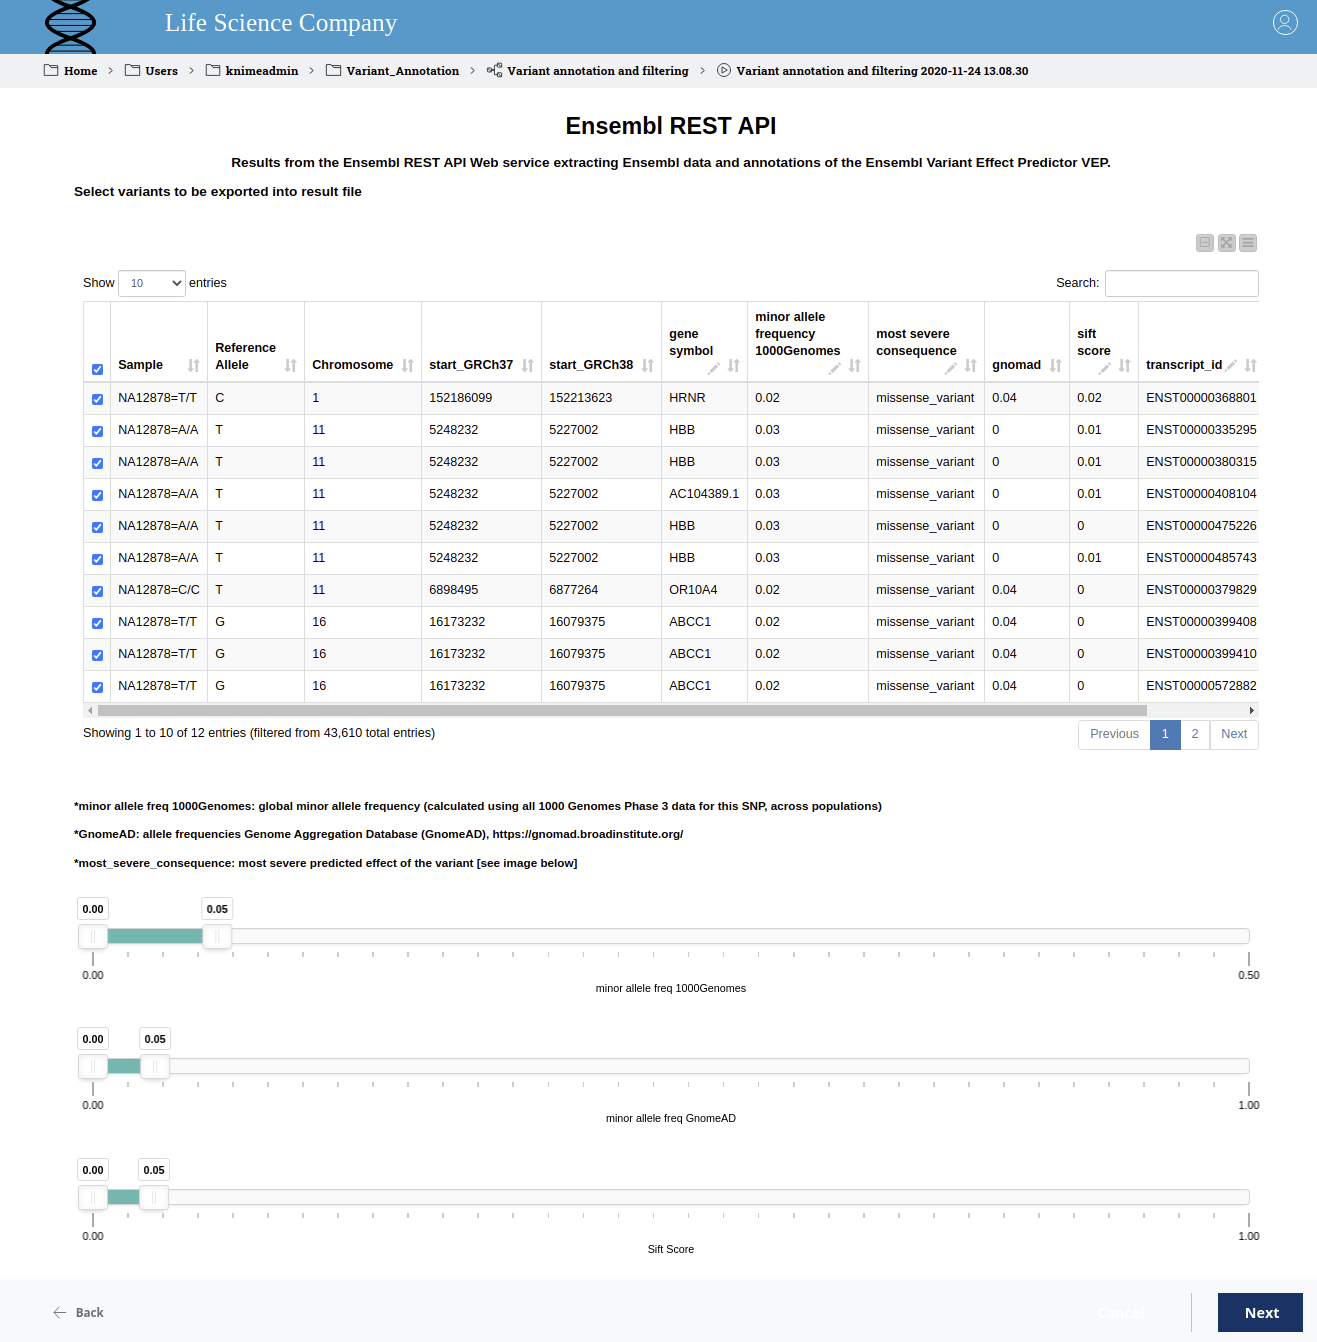
Figure 4. Interactive view to filter variants. The table displays the position and the most severe predicted effect of the variant. The gene symbol and the transcript ID are also displayed and the domain expert can add a manual annotation. The range sliders allow filtering for the SIFT score as well as for allele frequencies in the 1000 genomes project and gnomAD.
The user can now manually inspect the resulting table and decide which variants should be exported to the final result file. Using the interactive sliders, it is very easy to remove variants that are likely to have a low impact on the disease under consideration. In addition, it is possible for the domain expert to add a manual annotation that will also be written to the result file.
As can be seen in Figure 4, we have filtered for the SIFT score as well as the minor allele frequency in the 1000 genomes project and in the gnomAD data with a cut off of 0.05. This allows us to narrow down the set of potentially harming variants from variants in 45,106 transcripts to six. Those six include the one variant in the HBB gene that we purposefully introduced at the beginning. That missense mutation that we successfully found occurs in the Database dbSNP, where we can learn that the homozygous variant at position chr11:5227002 (GRCh38) can lead to Sickle cell disease. Hence, we were successful in interactively finding the disease-causal variant among large numbers of variants in our dataset.
Lastly, the selected results and a summary of the used commands (command line and GET Request) are displayed in the final view (Fig. 5).
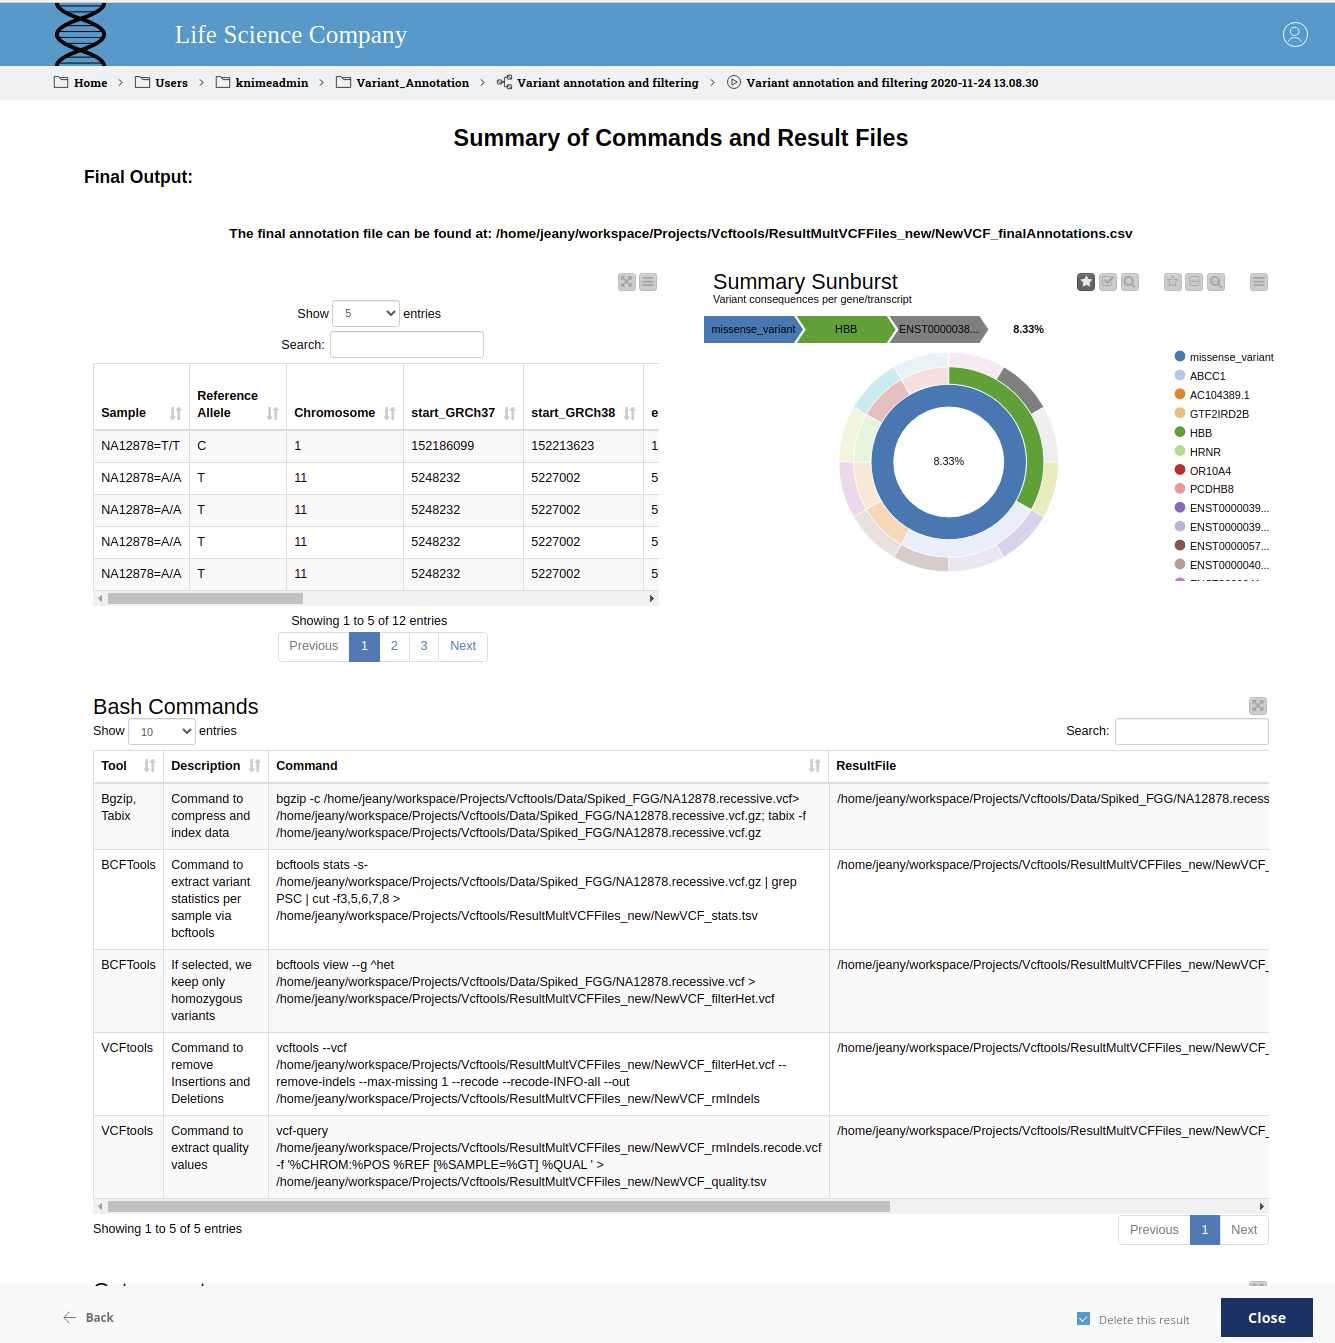
Figure 5. Summary of commands and result files. The table displays the final prioritized variants that are written to the output file in the given path. The sunburst chart shows, from the inner to the outer circle, the most severe consequence, the gene symbol, and the Ensembl transcript ID. The applied bash commands are shown below.
Summary
We created a reproducible workflow for a typical bioinformatics application: variant prioritization. This workflow can be easily accessed via the KNIME WebPortal to allow for domain expert interactions. In the workflow, we combined typical command line tools with built-in functionality in KNIME Analytics Platform including shared components, REST Services, and interactive visualizations. This allowed us to filter and predict the effect of thousands of variants and to find a disease-causing one within our data set.
References
1. McLaren, W., Gil, L., Hunt, S.E. et al. The Ensembl Variant Effect Predictor. Genome Biol 17, 122 (2016). https://doi.org/10.1186/s13059-016-0974-4
2. Cooper, G., Shendure, J. Needles in stacks of needles: finding disease-causal variants in a wealth of genomic data. Nat Rev Genet 12, 628–640 (2011). https://doi.org/10.1038/nrg3046
3. Petr Danecek, Adam Auton, Goncalo Abecasis, Cornelis A. Albers, Eric Banks, Mark A. DePristo, Robert E. Handsaker, Gerton Lunter, Gabor T. Marth, Stephen T. Sherry, Gilean McVean, Richard Durbin, 1000 Genomes Project Analysis Group, The variant call format and VCFtools, Bioinformatics, Volume 27, Issue 15, 1 August 2011, Pages 2156–2158, https://doi.org/10.1093/bioinformatics/btr330
4. McLaren, W., Gil, L., Hunt, S.E. et al. The Ensembl Variant Effect Predictor. Genome Biol 17, 122 (2016). https://doi.org/10.1186/s13059-016-0974-4
5. GCCL Cardenas, Raony, et al. "Mendel, MD: a user-friendly open-source web tool for analyzing WES and WGS in the diagnosis of patients with Mendelian disorders." PLoS computational biology 13.6 (2017): e1005520
6. Sefid Dashti, Mahjoubeh Jalali, and Junaid Gamieldien. "A practical guide to filtering and prioritizing genetic variants." Biotechniques 62.1 (2017): 18-30. https://www.future-science.com/doi/10.2144/000114492
7. Karczewski, K.J., Francioli, L.C., Tiao, G. et al. The mutational constraint spectrum quantified from variation in 141,456 humans. Nature 581, 434–443 (2020). https://doi.org/10.1038/s41586-020-2308-7
8. Pauline C. Ng, Steven Henikoff, SIFT: predicting amino acid changes that affect protein function, Nucleic Acids Research, Volume 31, Issue 13, 1 July 2003, Pages 3812–3814, https://doi.org/10.1093/nar/gkg509