Spheroids are 3-dimensional cell aggregates that are composed of cells of one cell line or a mixture of cells derived from different cell lines. They are useful in modeling diseases where the cellular microenvironment plays a vital role, such as cancer, as they better recapitulate the in vivo situation. Having such models that are closer to reality enables better assessment of cellular behavior and responses, e.g. to drug treatment with potential anti-cancer drugs. Although these more complex 3D model systems are helpful in research and testing new potential drugs, their handling is often less standardized and straightforward as the handling of 2D cell culture.
CytoSMARTⓇ microscopes are great when it comes to monitoring cell culture. Not only do they fit in the incubator where cells can be monitored without disruptions like opening incubator doors and placing plates outside for microscopic inspection, these microscopes can also perform automatic analyses like cell confluence for example. These algorithms work well for 2D cell cultures, however there is no dedicated pipeline for the analysis of spheroids.
KNIME and CytoSMARTⓇ have therefore been teaming up for a proof-of-concept project that establishes an automated analysis of Lux2 or Lux3 BR microscope images to classify if spheroids are ready for further experiments. To show that this setup is also suitable for end-to-end lab digitalization and automation, we’ll retrieve the images that are to be classified from a SiLA server, generate automatic reports and deposit the results back to the SiLA server. In this project we demonstrate how CytoSMARTⓇ devices, SiLA and KNIME nicely integrate and complement each other to detect ready-to-use spheroids in cell culture plates. Read more about this also on the CytoSMART page, KNIME and CytoSMART case study: automated spheroid imaging and analysis.
Brightfield image data
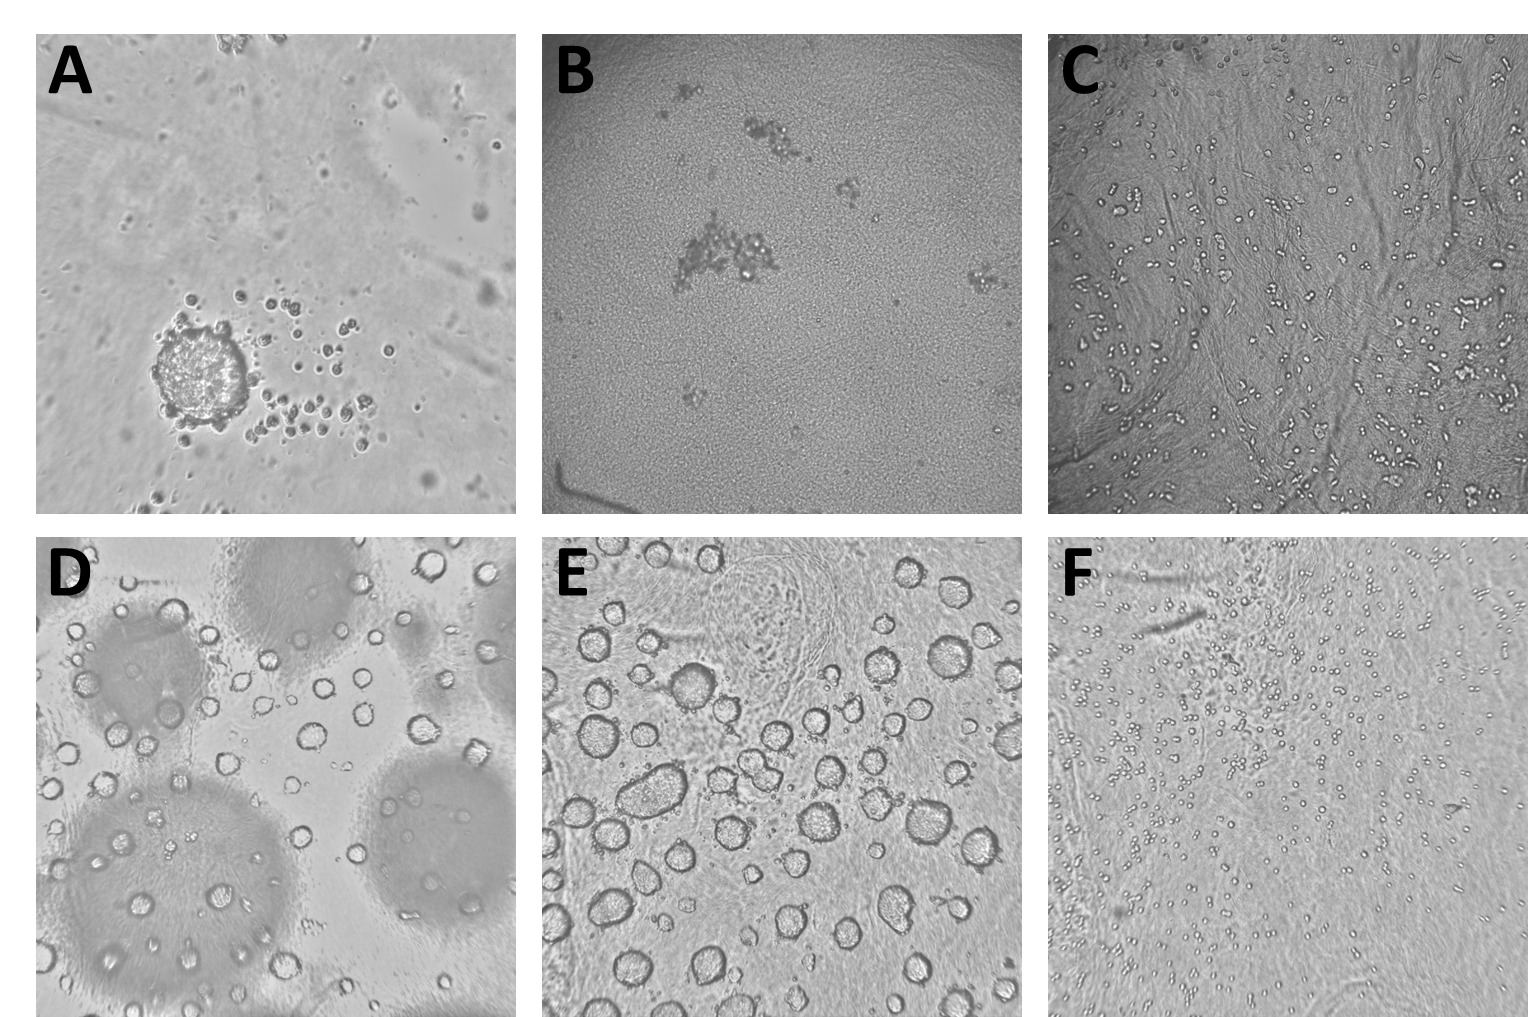
The data we trained the model on consisted of 4077 Brightfield images derived from 7 different experiments. The images show all stages of spheroid assembly, spheroids of different sizes as well as disassembled spheroids with dead cells and images with procedural flaws, like blurry focus and short exposure. All images had been labeled manually by an expert to specify whether or not they contained a mature spheroid ready for experiments. As some of the images used for model training are unpublished and confidential (and also several gigabytes of images are a computational chunk to chew on), we included only a part of the images used for model training in the workflow described below and which you can download from the Hub. Please note that when you run the workflow again, a new model will be trained and the results most likely will be different from the ones shown here.
How we trained the deep learning model
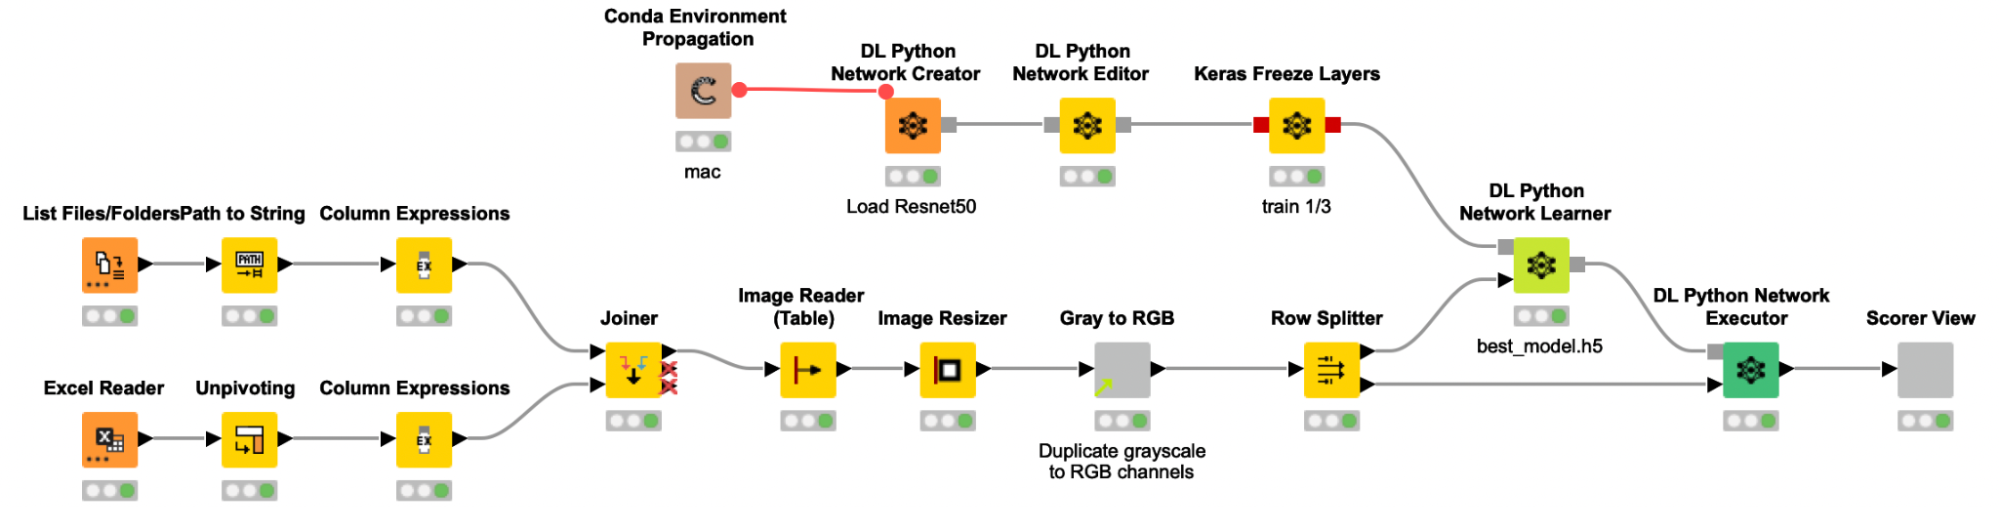
We trained the model following a process similar to previous stories we’ve written about on this blog. A table with the paths to all images is created and joined with the label information from an Excel file, before the images are actually read into KNIME. The grayscale images were then resized and multiplicated to the RGB channels to provide the required input format to the pretrained Resnet50 model. To adjust the pretrained Resnet50 model to our use case, we are only retraining the weights of the last ⅓ of the layers and freezing the weights for the first ⅔ of the layers of the network.
To add some noise to our images and to avoid overfitting, we use the Keras Image Data Generator for data augmentation. This will expand the training image set by applying several transformations on the existing images, like rotations, zoom changes and flipping. As the data set was quite imbalanced (the ratio of spheroid to non-spheroid images was 1:3), we used class weights to compensate. The data was split into a training (70%) and validation set (30%), and the performance of the model on the validation set was used to determine early stopping. This way, our model fitting is automatically stopped if the performance on the validation set does not increase after five iterations, — or even worse, decreases.
Disclaimer: please be aware that the model trained here serves as a proof-of-concept and is not ready for production or use in scientific publications!
Applying the trained model to classify spheroids
The model that we had created in the previous step is now deployed in another workflow to detect ready-to-use spheroids. This second workflow retrieves images taken with the CytoSMARTⓇ Lux2 and Lux3 BR batchwise from a SiLA server, loads them into KNIME and analyzes them. The results are compiled in a report that is automatically sent to the scientist via email, and the corresponding classification data is sent back to the SiLA server.
Please note that the images do not necessarily need to be retrieved from a SiLA server, but as the CytoSMARTⓇ devices can be controlled using the SiLA standard for lab automation, we wanted to showcase this capability and mimic an automated environment/lab setup.
To retrieve a batch of 6 images stemming from one 6-well assay plate from a mimicked SiLA 2 server, we reuse the shared components from our previous proof-of-concept SiLA blog post, User-friendly end-to-end lab automation in action.
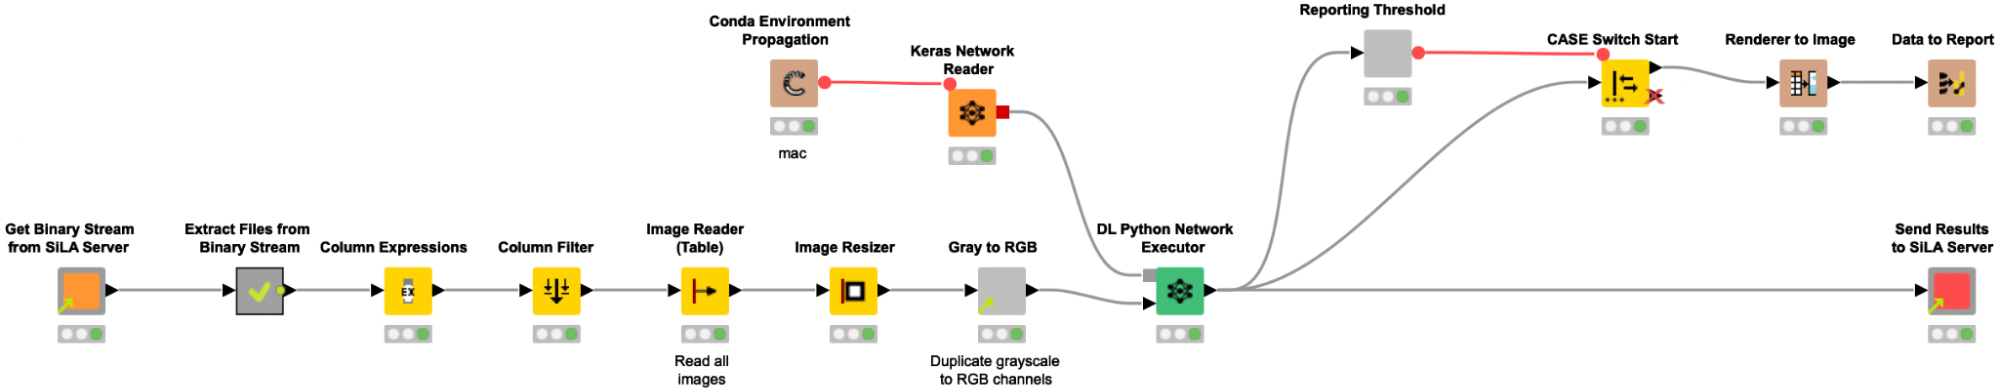
The shared component Get binary stream from Sila Server requests and receives a binary stream from the SiLA 2 Server, and automatically creates a Binary Object column. In the following metanode the content of that Binary Object column is written into a file in a temporary directory. Since we expect the binary stream to contain an entire ZIP archive, we create and extract such an archive, and a table with file paths pointing to the images is returned from the metanode. We use the Column Expression node to extract the image filename and read the images into KNIME with the Image Reader (Table) node. We preprocess the images as described above (resizing, duplicate grayscale to RGB channels) to bring them into the correct input format that is required for the re-trained Resnet50 model. The Keras Network Reader node loads in the previously trained deep learning network (called best_model.h5) and the DL Python Network Executor applies the model on the images to detect spheroids.
In the last step, we use the provided shared component Send Results to SiLA Server to configure the host name, port, and the column with keys and values containing the newly created classification data and push the data back to the SiLA 2 Server.
Outcome report sent to application scientist automatically
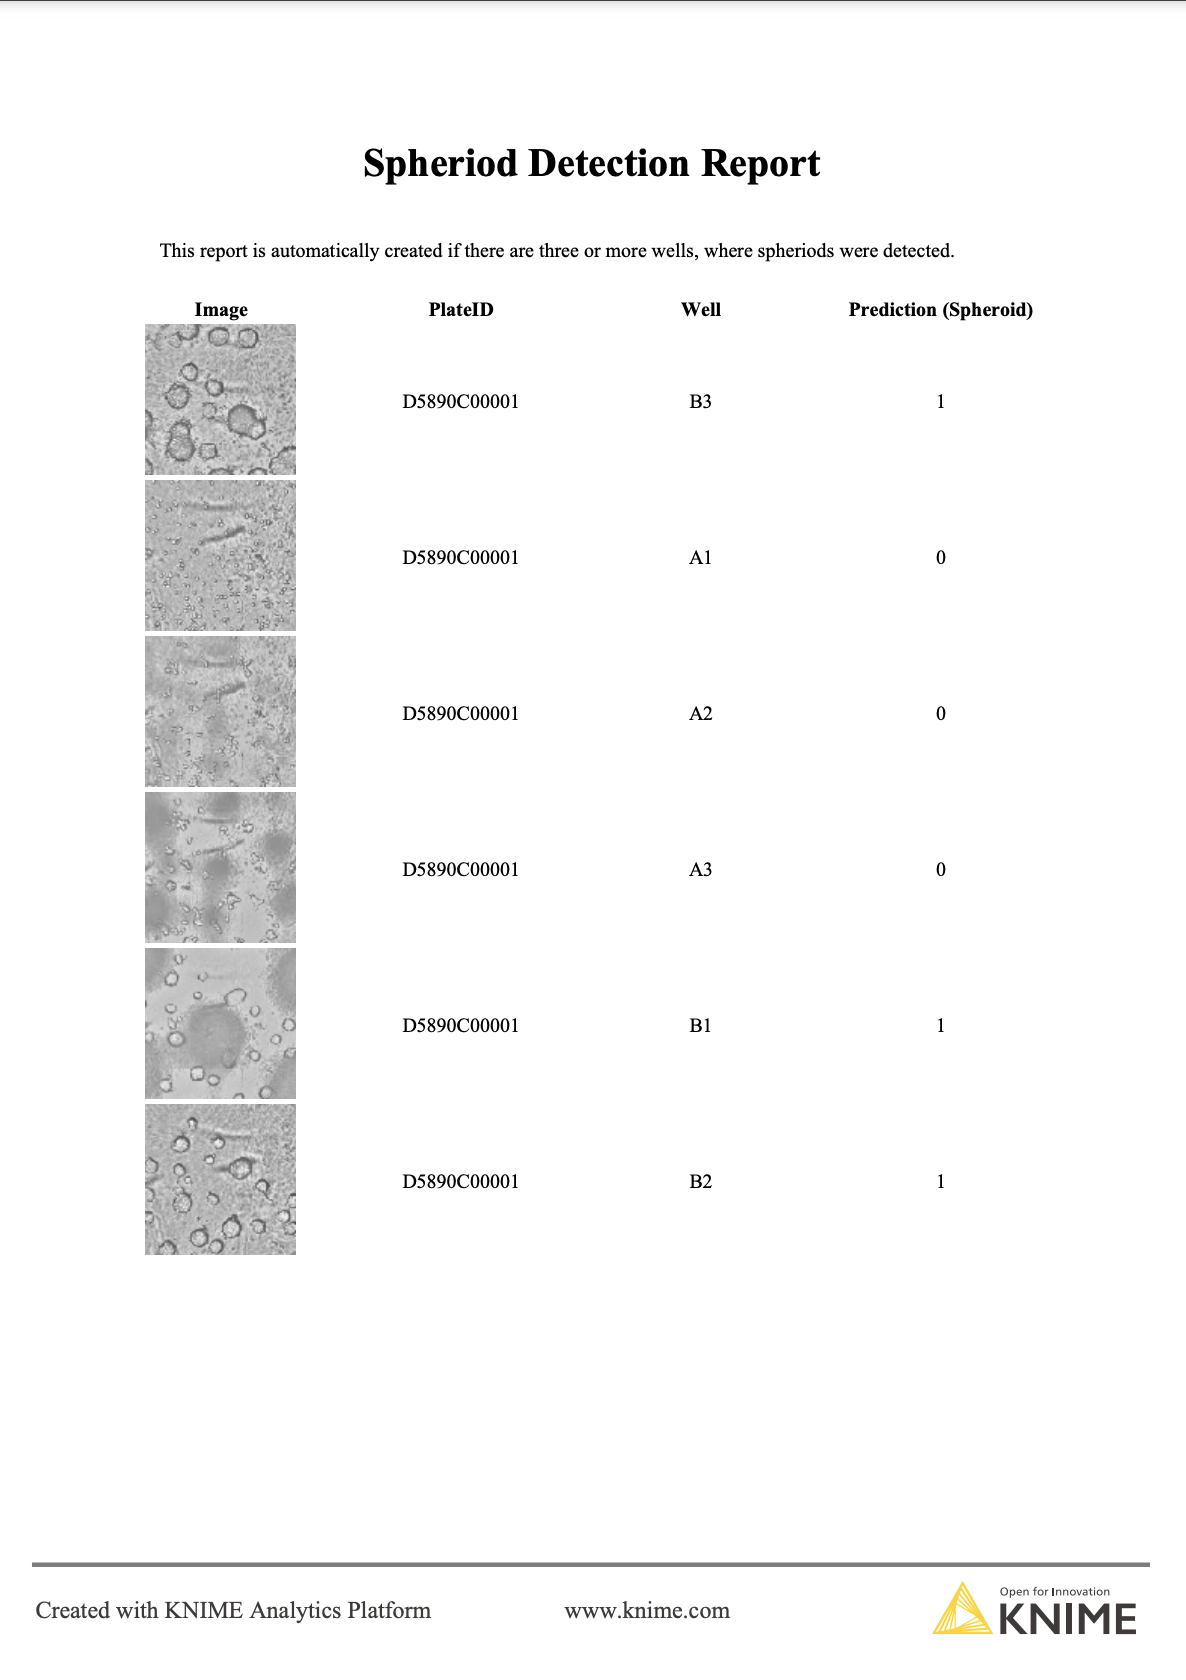
To inform the scientist about the outcome of the classification, we also create a report if at least 3 out of the 6 wells (each well represented by one image) per plate were predicted to contain a ready-to-use spheroid. The report contains the classification as well as the corresponding image, so that the scientist can double-check and decide if the plate is ready for further experiments (Figure 5).
Automating image classification with KNIME Server
Since this process needs to be repeated not only for all the 6-well plates present, but also every 2-4 hours when new images of the plates are taken to monitor the progress in cell aggregation, we utilize the automation and scheduling capabilities of the KNIME Server. The KNIME Server’s scheduling functionality allows us to execute our spheroid detection workflow several times a day whenever fresh microscope images have been taken.
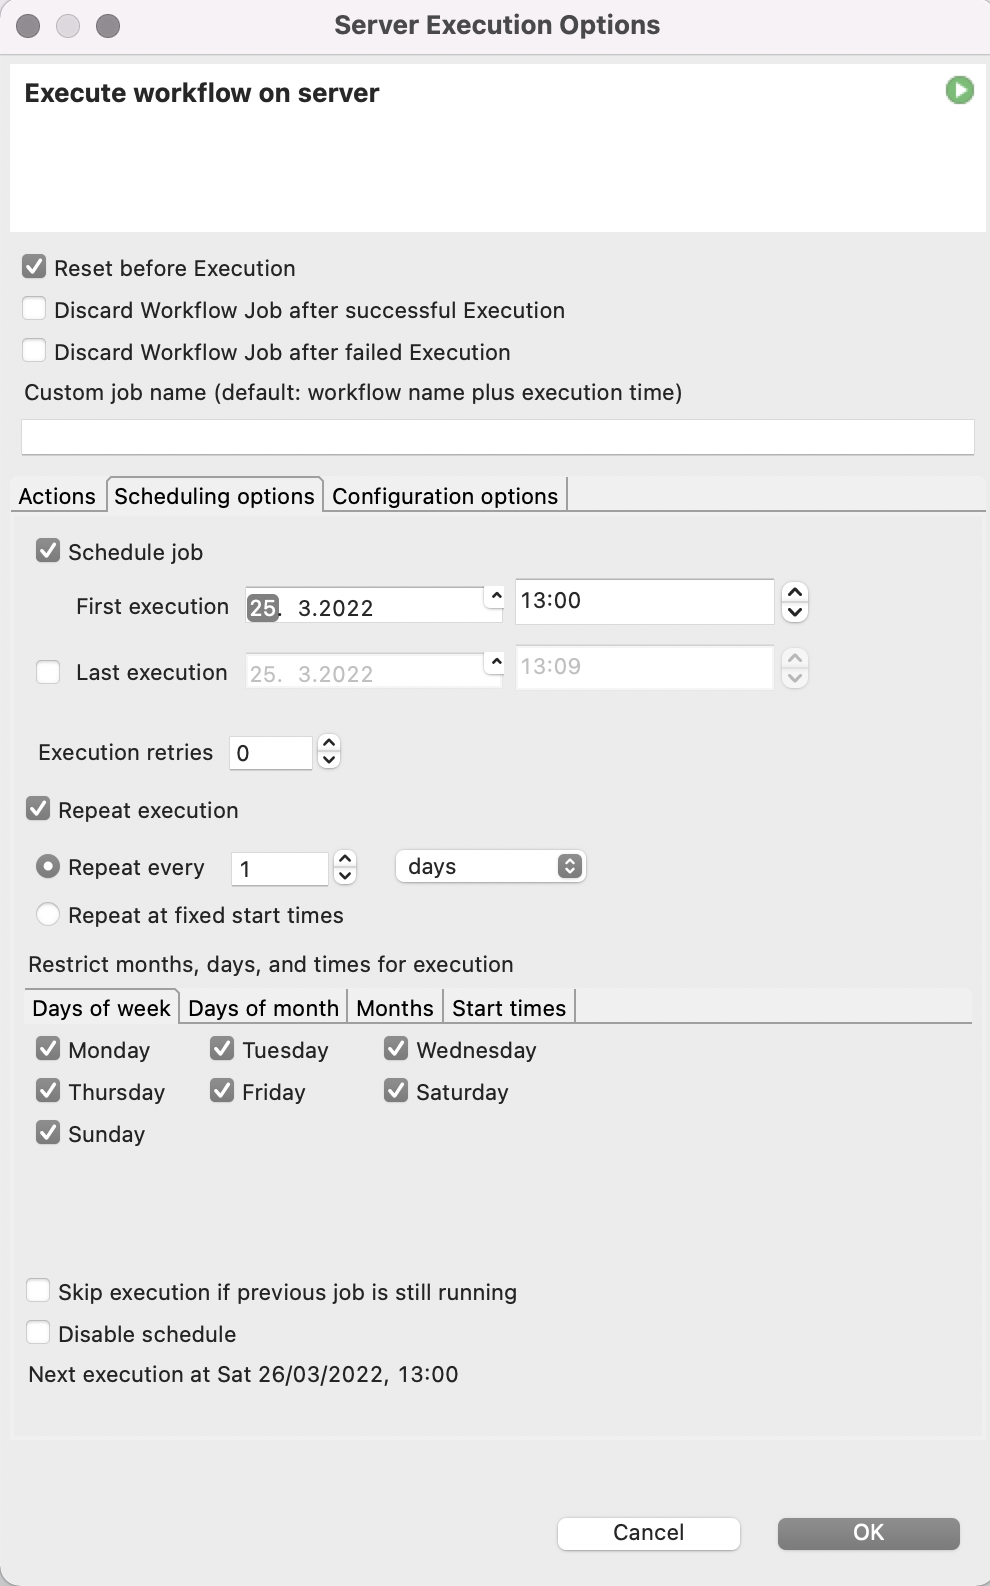
To make our lives even easier, we will also let the KNIME Server send us an Email every time the workflow is finished and attach the report in PDF format.
Automatic spheroid detection in automated lab environment
In this project we teamed up with CytoSMARTⓇ to establish a proof-of-concept pipeline that automatically detects mature spheroids in pictures taken on 6-well plates and informs the scientist if more than half of the spheroids on the plate were classified as mature. We have shown that this pipeline works in an automated lab environment by retrieving and sending data from and to a SiLA 2 server.