
In the past decade the explosion of collected data, the strong increase of computer resources, and the evolution of machine learning (ML) algorithms have led to applications that can perform single activities - such as image recognition - to a human or even superhuman performance. For every data scientist, the value of this technology is beyond doubt, and potential applications can be found in every part of industry, in almost every company department even. On the other hand, ML is based on finding patterns in a dataset and applying them to unseen data. Results are based on probability rather than intuition – accepting these results can be very difficult or even impossible.
In a lot of company departments that could potentially use ML applications, these tasks have usually been carried out by employees - domain experts - often with impressive accuracy, thanks to their years of experience, intuition, and excellent knowledge of the data, the problem, and sometimes even undocumented additional information. The switch to using automated algorithms to carry out this task improves speed dramatically, but an improvement in quality is not always guaranteed. This can result in the domain experts mistrusting and ultimately rejecting these kinds of applications, their fear of being replaced by machines notwithstanding.
The organizational structures of many (large) companies rely on clearly defined responsibilities – what happens if a prediction of an ML algorithm was wrong and this has led to additional costs? Who is responsible for that? The developer? The domain expert? No one? Having clear procedures is not only recommended but usually mandatory; this often calls for processes needing to be redesigned and involves considerable discussion between members of multiple departments – a bad premise for introducing ML applications quickly.
Use guided analytics to build trust in machine learning
We know what it’s like to build trust in colleagues. We believe we understand how they think, and our trust is reinforced following positive experiences with the results they produce. This makes us feel safe to trust their work. ML methods, in contrast, have such a large complexity, that an understanding of the results is only possible for the simplest algorithms. Visualizations and explanations of the methodology often provide just a rough picture as to how the results have been ascertained – and some algorithms are intrinsically so sophisticated that simple reasoning is impossible!
For a domain expert without any background in data science it can hardly be anything other than a black box. So, when will the expert trust the algorithm as naturally as we trust electricity and that the light will go on at a press of the switch?
In our approach we try to combine elements of Guided Analytics to address this problem and involve the domain expert in the process. In this way domain expertise and algorithmic performance can complement each other.
This has several advantages:
- The domain expert retains control over the process – they can decide if the algorithm can be trusted, and inspect, review, and change results
- Responsibilities are clear: the result is approved by an employee
- Domain knowledge that is not documented in the data can still be incorporated
- The domain expert is not replaced by the automated software but is given a tool that supports them to perform their task faster better. With time and positive experiences, trust in the algorithms and acceptance of the methods can be developed
Integrate the domain expert
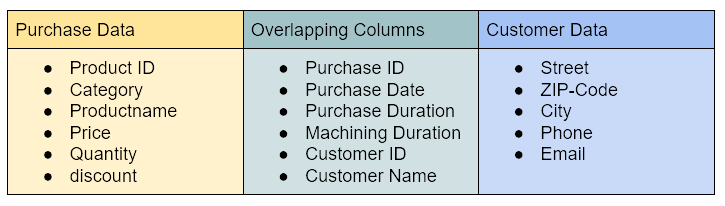
To show how such a process can be implemented based on an example, we created a workflow that blends two different datasets. The datasets are from a fictive online shop, which separates order data into purchase and customer data. Each dataset consists of unique columns and overlapping columns, which appear in both datasets. However, they do not match perfectly: some entries can be incorrect, have misspellings or be formatted differently, meaning that the standard joiner node would fail in most of the cases. Tab. 1 shows the structure of the dataset.
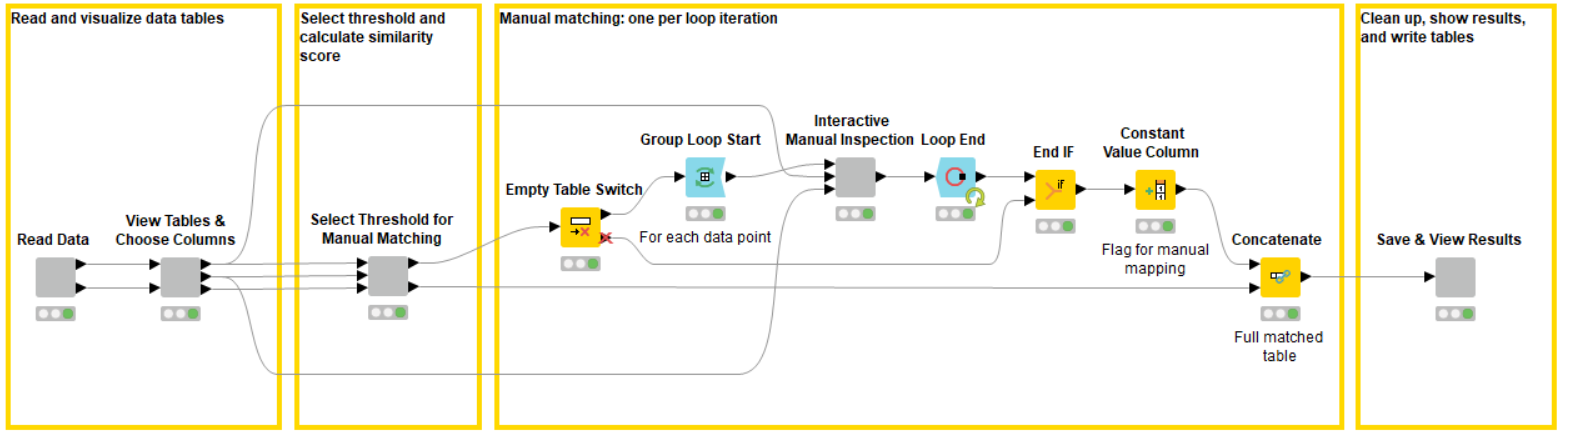
The workflow that we use in this example is shown below.The four boxes highlight the different steps of the workflow.
- Load data and view
- Compute similarity measures, choose accuracy, and perform automatic matching
- Manual inspection
- Show and save the results
The workflow can be basically split into two parts: the first part represents the ML algorithm to match corresponding rows. In our case we use simple numeric and string distance metrics to compute the total distance (difference) between the entries of the overlapping columns of each data row of the first source with each data row of the second table. The closest pairs are matched and joined. The second part of the workflow enables user interaction and invites the domain expert to inspect, review, and change the result of the algorithm. This workflow generalizes well, as the algorithmic part serves simply as an example and can be exchanged by any ML algorithm; the interactive views can be adapted easily to different use cases.
Enable interaction via a data app
To begin with, we want to discuss the workflow from the domain expert’s perspective the data app.
The workflow starts with an introductory, informative view. The first view shows the data, as well as some additional information about the problem. Since there are multiple overlapping columns, the domain expert can choose which ones are used for the matching algorithm, e.g. remove any particularly erroneous columns in particular.
After these introductory steps the matching algorithms compute distances (differences) measures between each pair of rows from the two input tables.
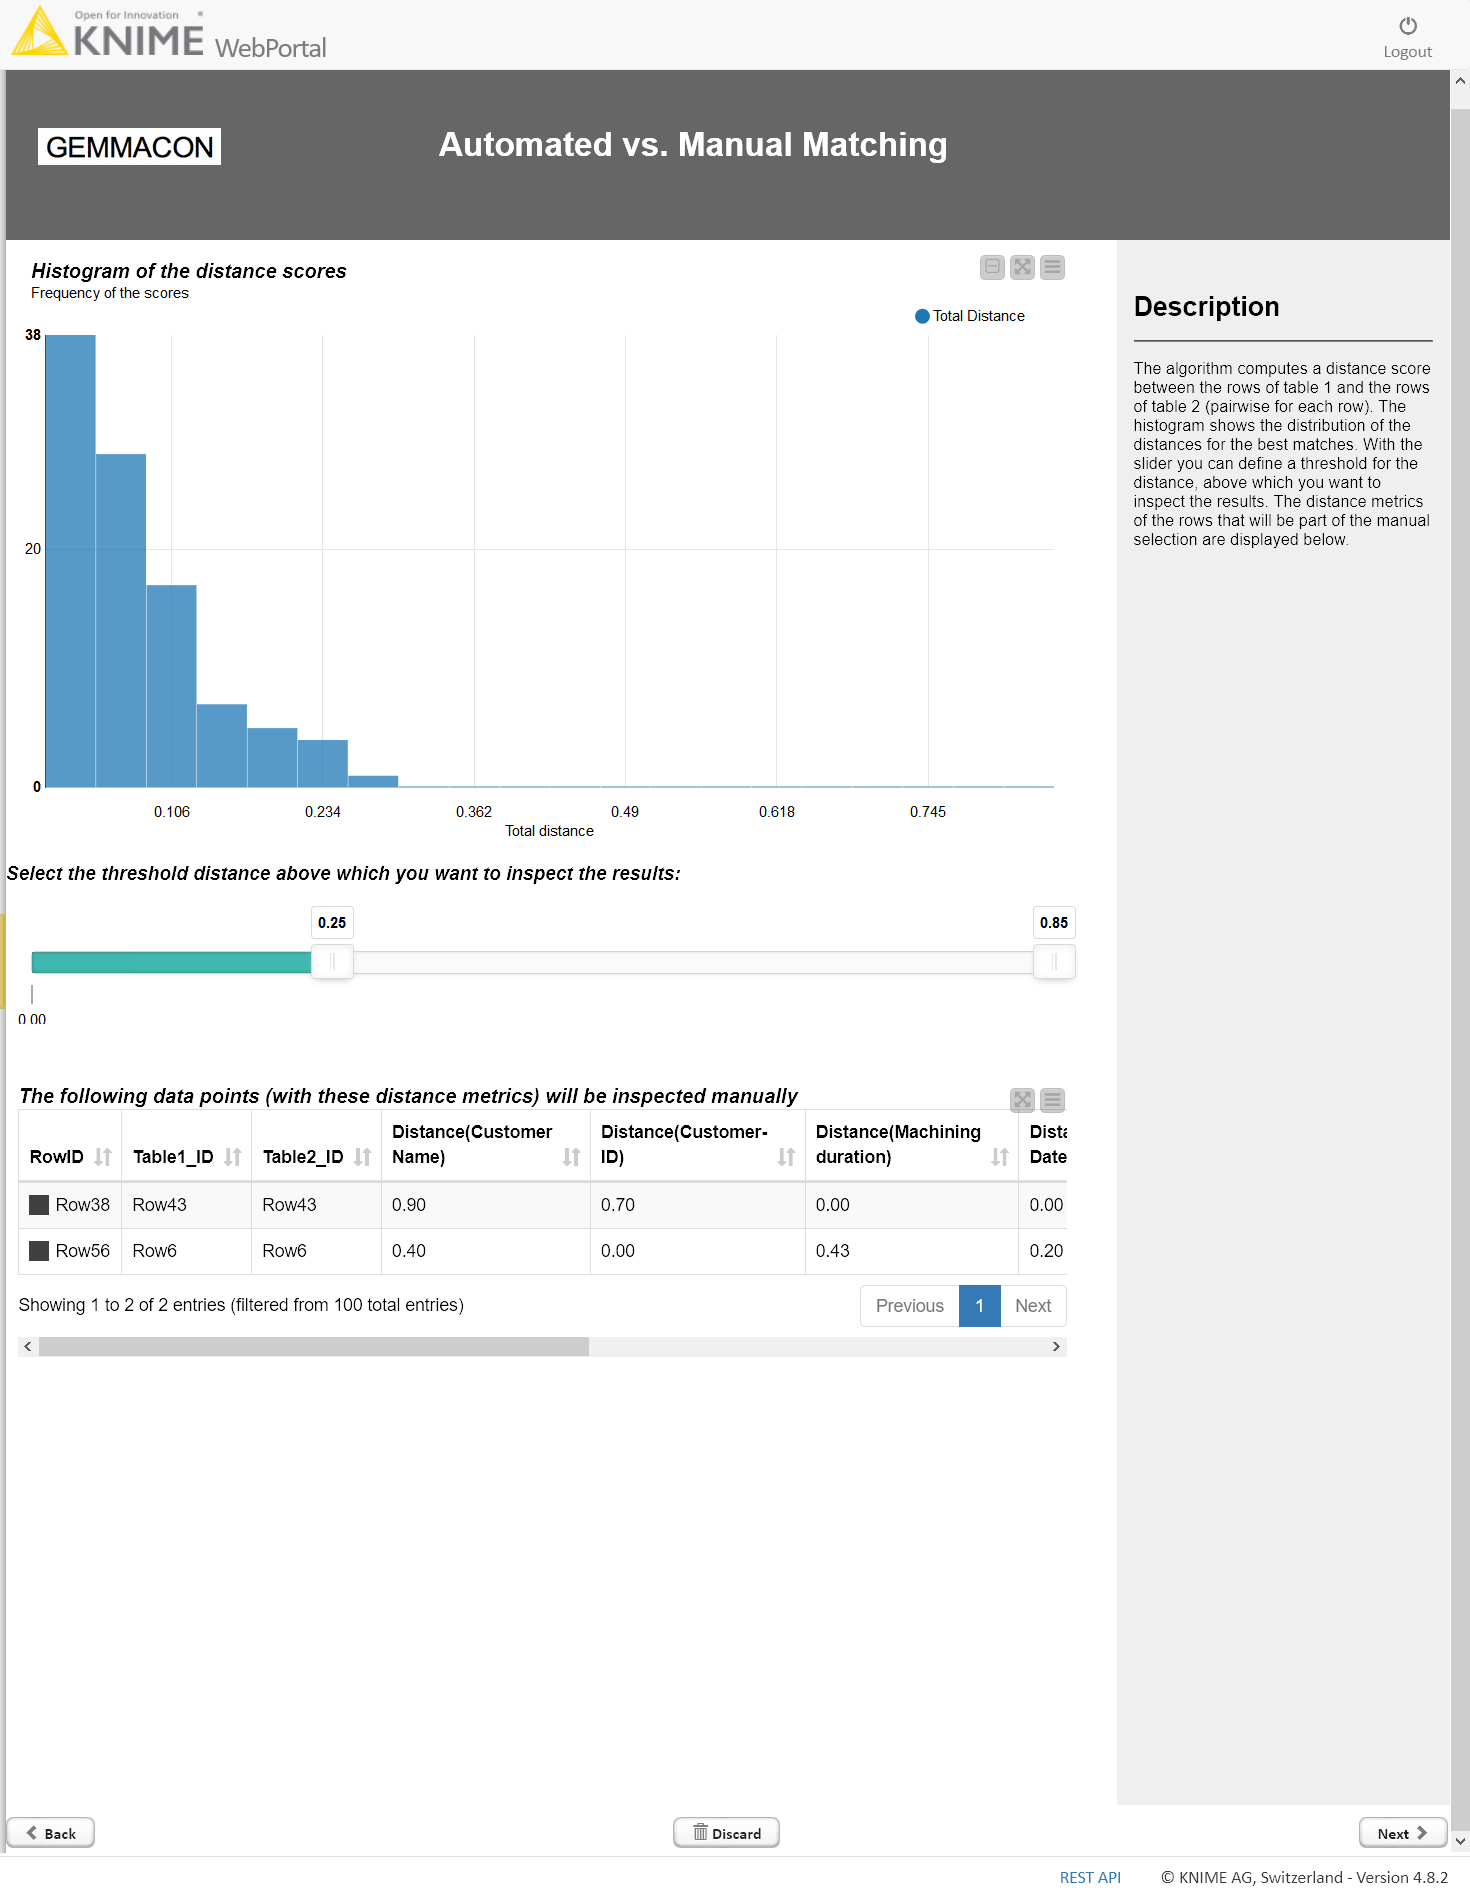
The Automated vs. Manual Matching page on the KNIME WebPortal in Figure 2 shows one of the key pages: A histogram, which shows the distribution of the distance for the best matches from each row of the first input source. This distribution gives the domain expert a quick overview on how the algorithm has performed. Is the algorithmic matching generally confident? Are there outliers?
Using the slider, the domain expert can define a threshold. Below, the matching is performed automatically, above, each match has to be verified by the expert. Depending on trust, time, and own expertise,the domain expert is fully flexible in how they control the algorithm.
After defining the threshold, the workflow loops iteratively through all questionable matches, prints out the datapoint from the first source (purchase data) and possible matches (from the customer data) in a descending order. Quantities, such as distance or precision, can be shown too, and provide valuable additional information to the domain expert.
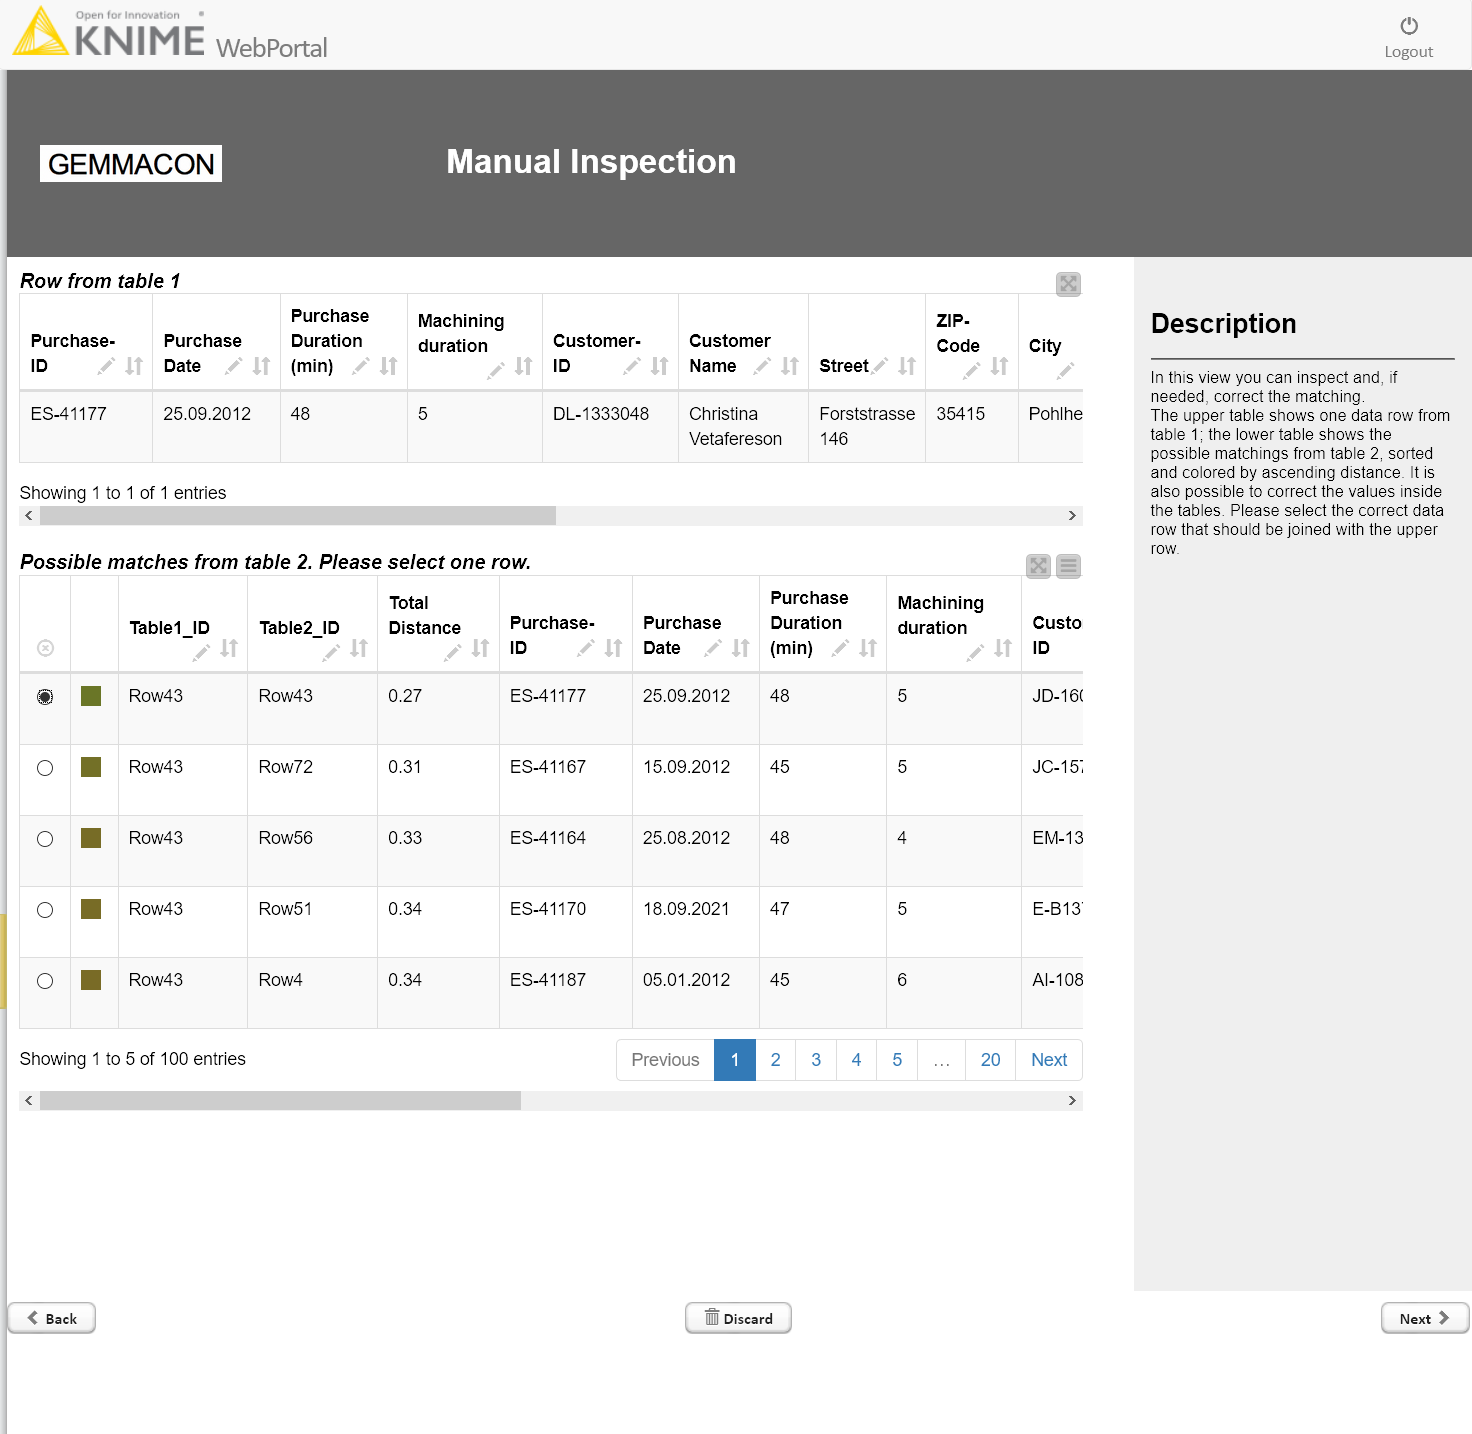
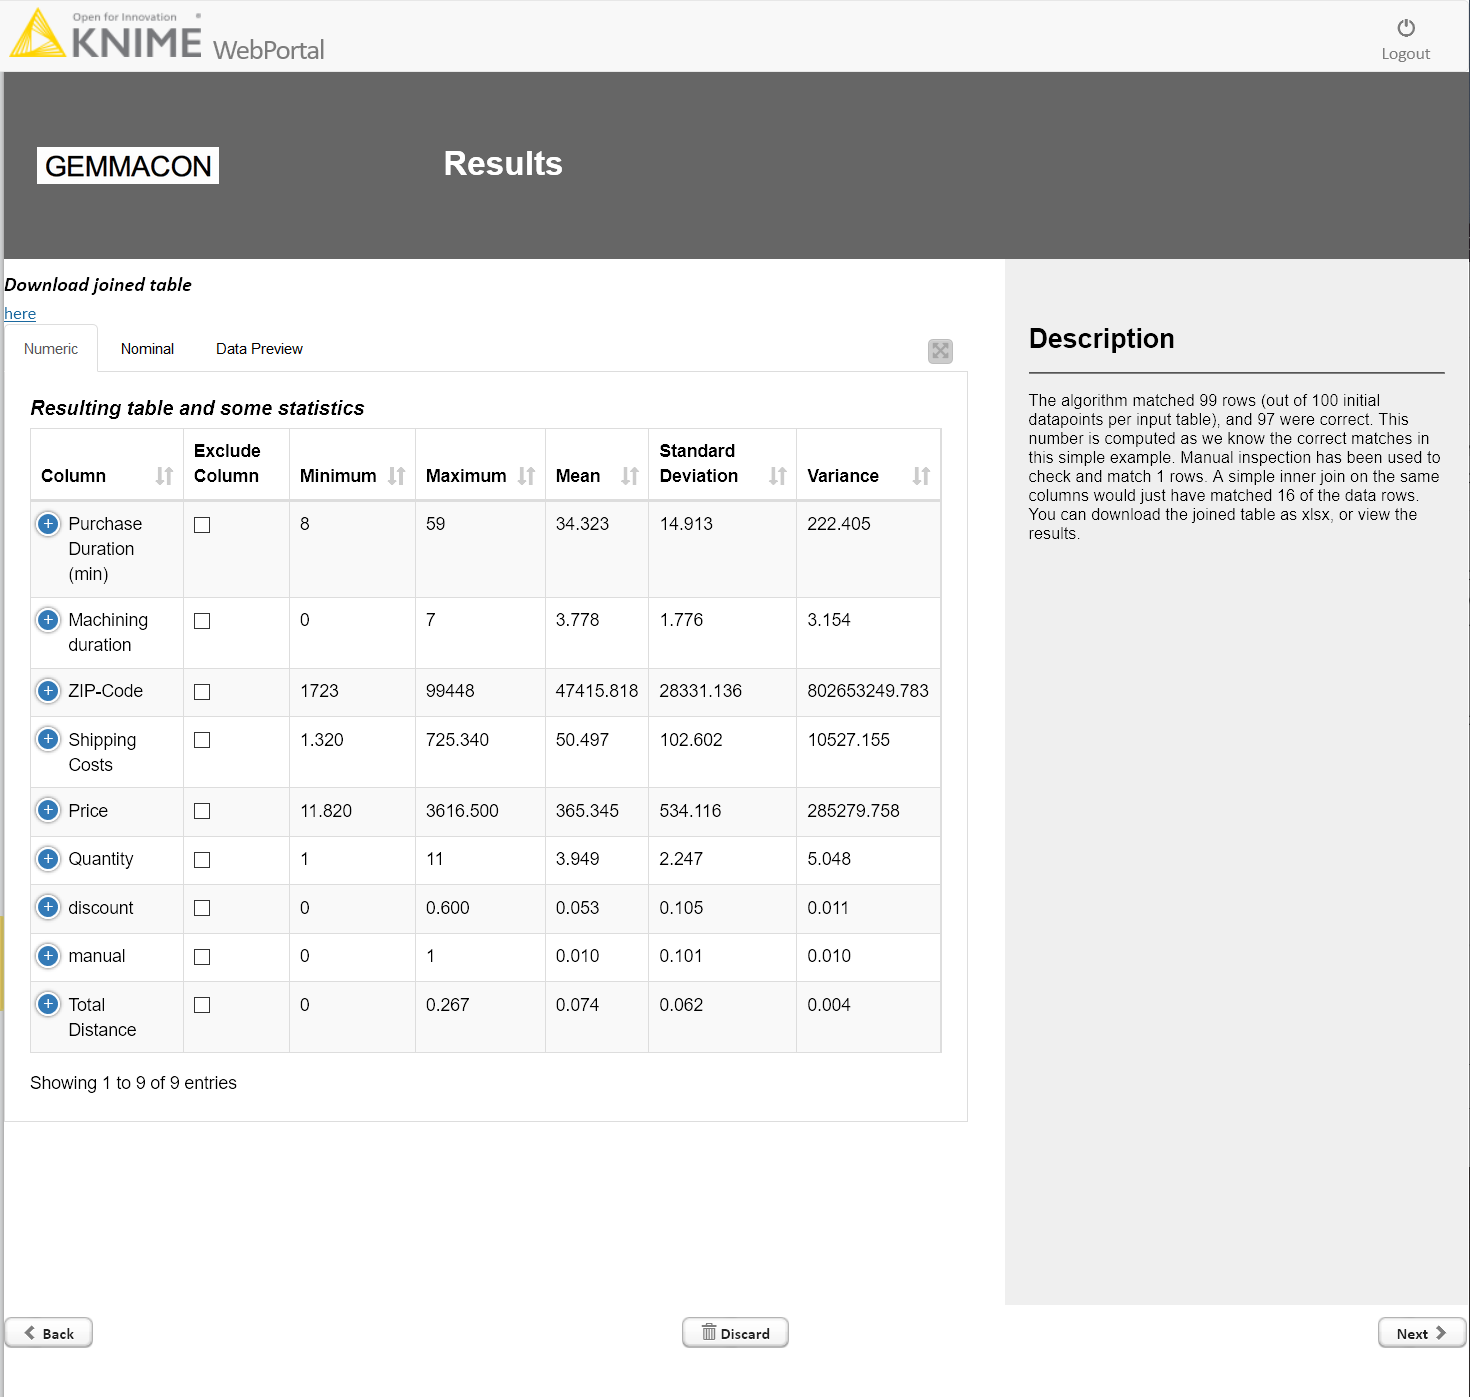
The results are shown after each of the datapoints has been manually verified or changed. Optionally the joined table can also be downloaded.
Behind the scenes of the matching algorithm
We would like to take you behind the curtain of the matching algorithm! It is based on computing distances between the entries of the overlapping columns, which can be numeric, string, or other types such as date and time (not in this workflow).
Distance measures
A specific distance definition is needed for each type. For string columns, the Levenshtein distance can be used, for example, to compare two strings. This distance is normalized to the maximum distance appearing in the comparison, so that the values are in the range [0,1]. This distance is computed for every pair of rows and every string column.
Note: The Levenshtein Distance is one of the most famous string metrics for measuring the difference between two strings. It is the minimum number of operations (i.e. deletions, insertions, or substitutions) performed on a single character to transfor one of the strings into the other.
For numeric columns the computation is slightly different. Here one can calculate easily the numeric difference between the two numbers, normalize this to the maximum difference of that column, so that one obtains values in a range of [0,1] as well. The total distance can be obtained by averaging over all columns.
Adapt weights
Domain knowledge can be introduced to the distance measures for example by modifying the weights of each column. The distance values for each column are in the range [0,1], so that each column has the same weight to the total distance. However, if, due to some other piece of information, you expect to have some columns that match better than others, you can adapt the weights and increase the influence of specific columns to the total distance. An easy implementation is found in the Column Expression node, where we just doubled the distance of the ID column – this encodes the information, that we expect the ID to have less errors than the other columns.
The workflow shows a way to blend the power of ML algorithms with the domain knowledge of the end user - the domain expert. Using both sources can improve the quality of the results and puts the domain expert back in full control, making the ML application a powerful and supportive tool rather than a black box where decisions are made but not transparently reasoned.
The workflow can be easily adapted to other ML problems than matching different data sources.
References
- Workflow: You can download and try it out from the KNIME Hub or from the publicly available KNIME EXAMPLES Server: 40_Partners\04_GEMMACON\01_Semi_Automated_ML
About the author

After his Ph.D. in particle physics Lukas joined Gemmacon as a data scientist and consultant with a passion for transforming business problems into data science projects. Beside the development of data pipelines, the implementation of machine learning algorithms and the design of visualization, a key ingredient is close collaboration with domain experts in order to integrate their knowledge into the solutions.
GEMMACON is a KNIME trusted partner. The company is known for providing simple, effective solutions and passion for digitalization within the automotive industry. As a consulting company the focus is on process, project and quality management. The innovative Quality Analytics approach raises efficiency, understanding and visualization of data to a whole new level. GEMMACON creates the maximum added value for its customers through the reduction of warranty and goodwill costs, the growth of service revenue, and increased customer satisfaction.