
So, what is a Widget node?
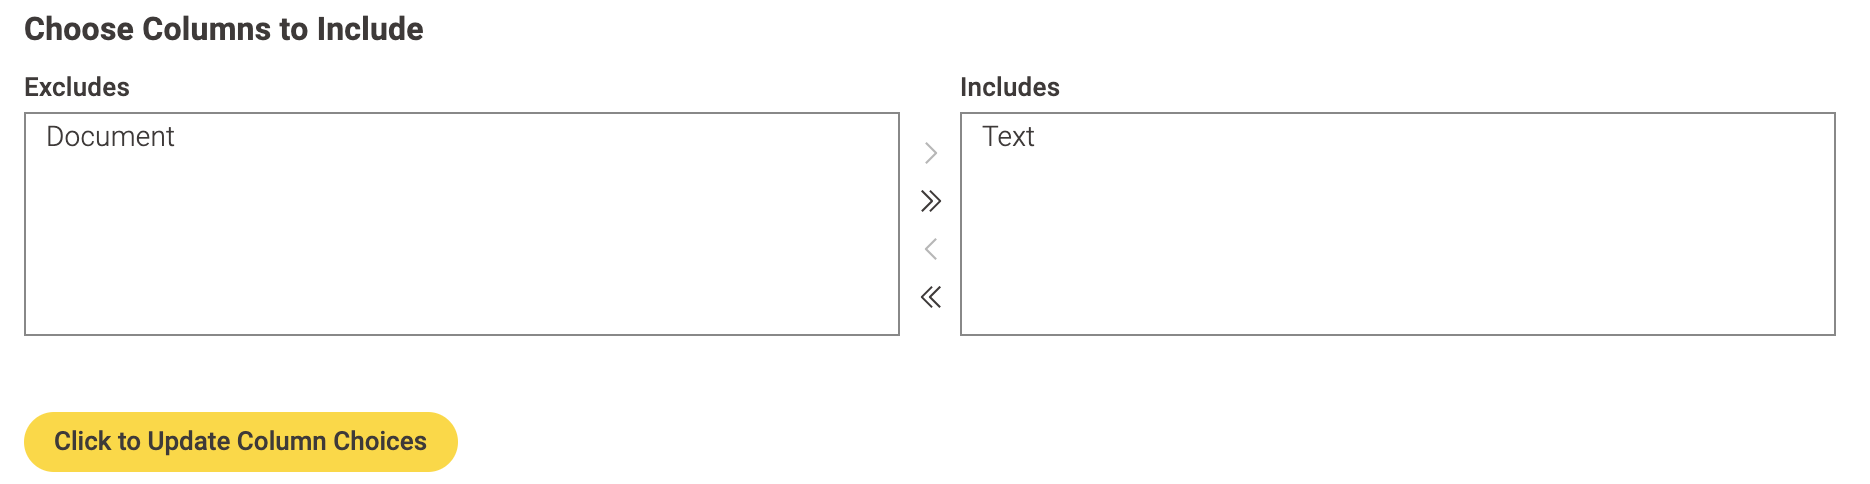
Use Widget nodes in your KNIME workflows to enable interaction with your data analysis by selecting, filtering, and entering values, and by applying new settings, all in an interactive view. This works both in KNIME Analytics Platform via Component Composite Views and on the KNIME WebPortal via Data Apps. For example, below we interact with our data and select the columns we wish to render as output:
We enabled this interaction by using two widgets:
-
The Column Filter Widget: The Column Filter Widget allows us to interactively choose the columns we want displayed.
-
The Refresh Button Widget: The Refresh Widget allows us to change our minds at any point and hit the yellow button to update our selection.
These are just two kinds of widget nodes available in KNIME Analytics Platform. There are more kinds to get to know!
Types of Widgets
Widget nodes come in many flavors:
-
Input widgets: input data – such as text
-
Selection widgets: select data – such as one or more variables
-
Output widgets: output data – such as an image
-
Filter widgets: filter data – such as one or more columns
-
Re-execution widget: re-execute downstream nodes – via the Refresh Button Widget
Now, let’s look at each type and give you some examples of their uses.
Input Widgets
These widgets input different parameters into a workflow. For example, below we demonstrate the Date&Time Widget, which allows you to interactively input a date to be used later.
Selection Widgets
These widgets select input values from a given list. For example, you can choose a specific value or values of a chosen column to filter a data table.
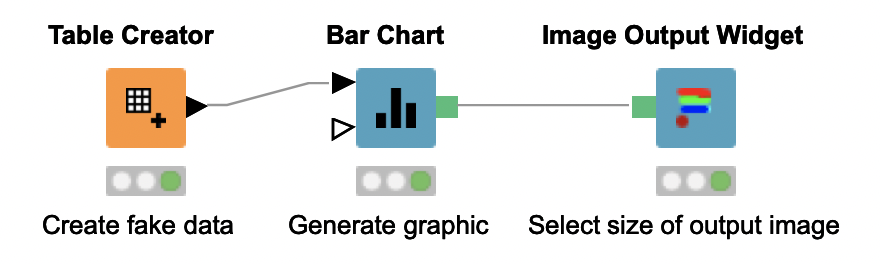
Output Widgets
These widgets produce links to download files, or display images or text.
Filter Widgets
These widgets trigger interactive filtered views. For example, in the graphic below, we want to focus on all data above 6 and below 18.
Re-execution Widgets in KNIME Version 4.4 and Below
The Refresh Button Widget node creates a button to re-execute downstream nodes of the workflow in a component's composite view. You can decide which workflow segments should be re-executed by where you place the node. The (re-)execution is controlled by clicking the yellow button in the view.
Note. If you’re still not sure why you would want a Refresh Button Widget node in your workflow, check out Eight Data App Designs with the New Refresh Button. It’s a great reference if you’re interested in seeing other examples of how powerful widgets can be.
Re-execution Widget in KNIME Version 4.5 and Above
What if you don’t want to click that yellow button every time you make a choice? Is there a way to automatically reload the page whenever a column or option is selected? There is in KNIME Analytics Platform version 4.5 and above!
Simply right-click the appropriate node, select “Configure” and look for the “Re-execution” tab. Select that tab and check the box next to “Re-execution on widget value change.” Here’s what that looks like:
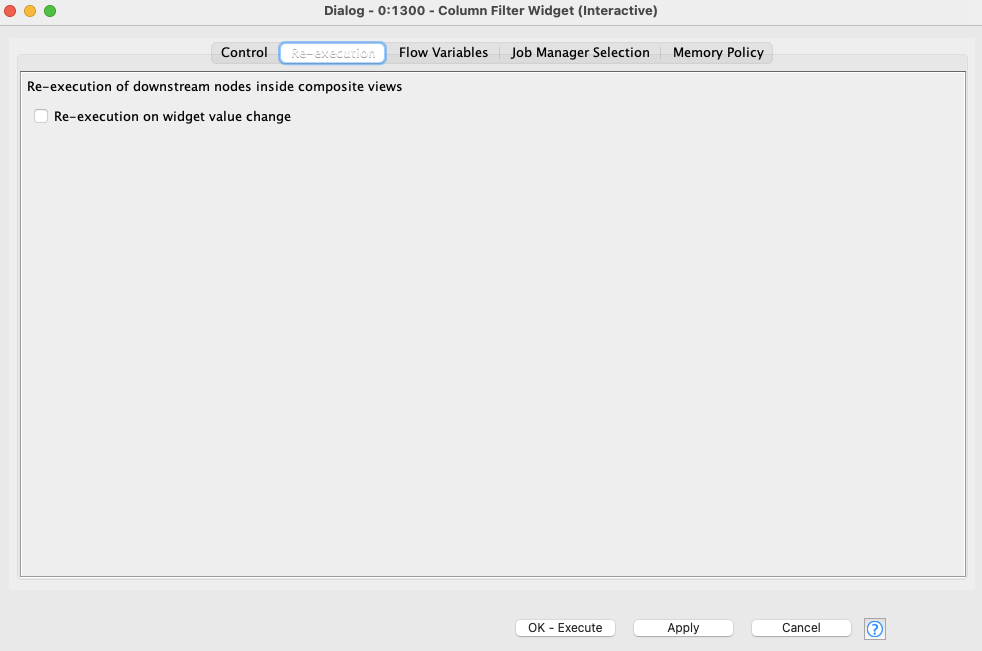
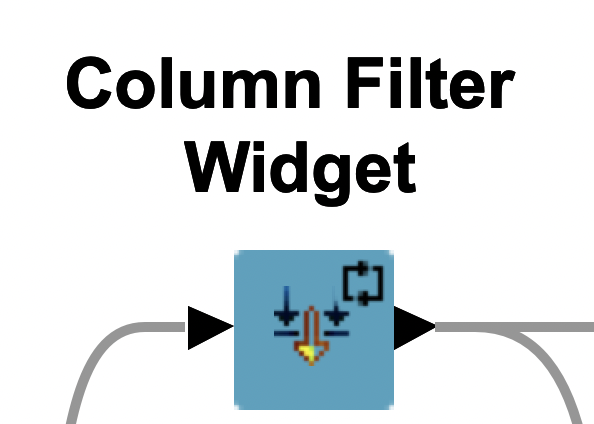
Also note there is a small icon that appears on a widget with re-execution enabled.
So does this mean the Refresh Button Widget node is deprecated in these versions? Absolutely not. You can still opt to use the node instead of checking this option.
But why would you use the node instead of this awesomely automagical reloading? Think about it: What if you have a large amount of data, and reloading each time you make a selection is too time-consuming? In that case, the node would be the simpler method by far.
Putting It All Together
We’ve just learned about the different widget types, and have seen basic examples of their use. Did you know you can use widgets to build your first data app? Read all about it in the article: Build a Data App: Create an Interactive Dashboard in Three Steps with KNIME Analytics Platform.
Now, let’s do something really challenging and novel: Let’s build a data app that makes regex interactive! You can download this workflow here for free, if you want to follow along.
What Is Regex?
Regular expressions, commonly called regex, are a series of special characters that allow us to find specific text in a document. For example, let’s say I have 10,000 documents, and I want to locate a single date somewhere in there. I know I always use the same date format: YEAR-MONTH-DAY. For example: 2021-10-1. I can therefore use this regex to extract every instance of this date from every document: [0-9]{4}-[0-9]{1,2}-[0-9]{1,2}. The following figure describes how to read each part of this regex:
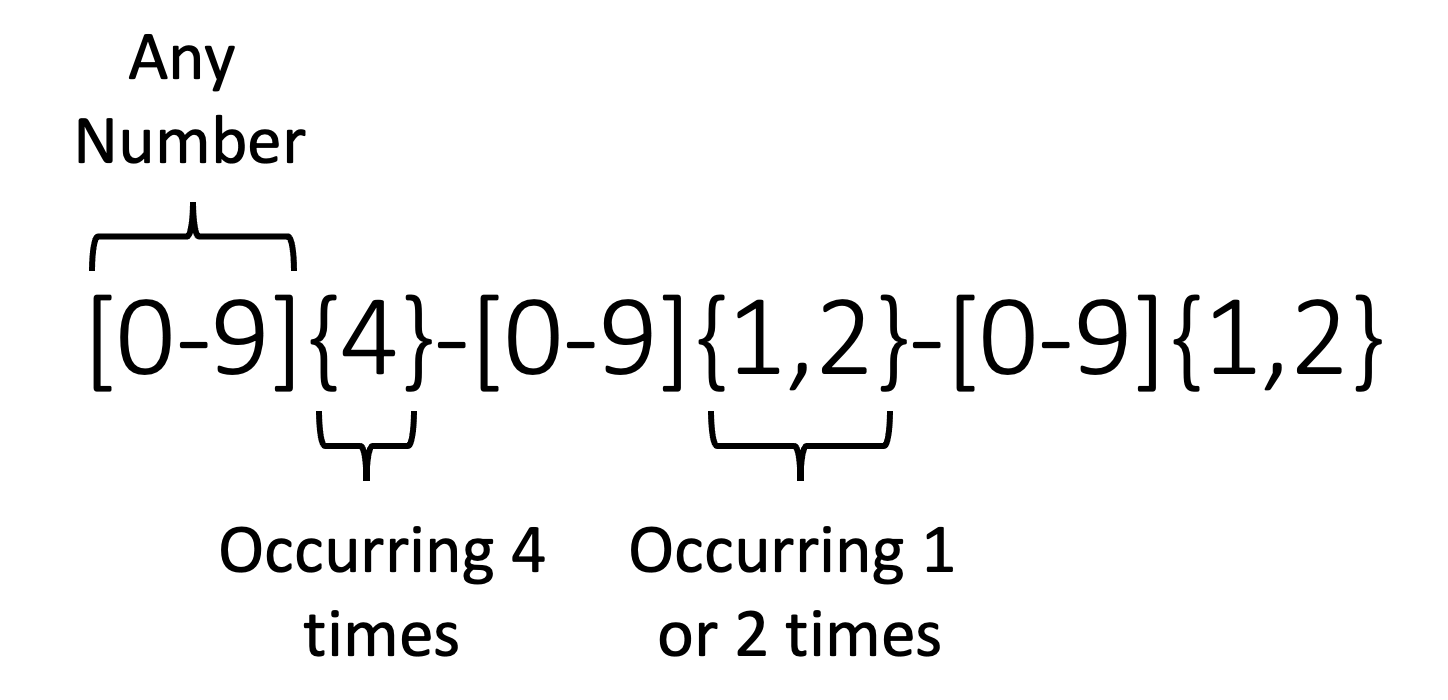
For the purposes of this article, this is all the regex you will need to know. (Hooray!)
Interactive Regex Workflow
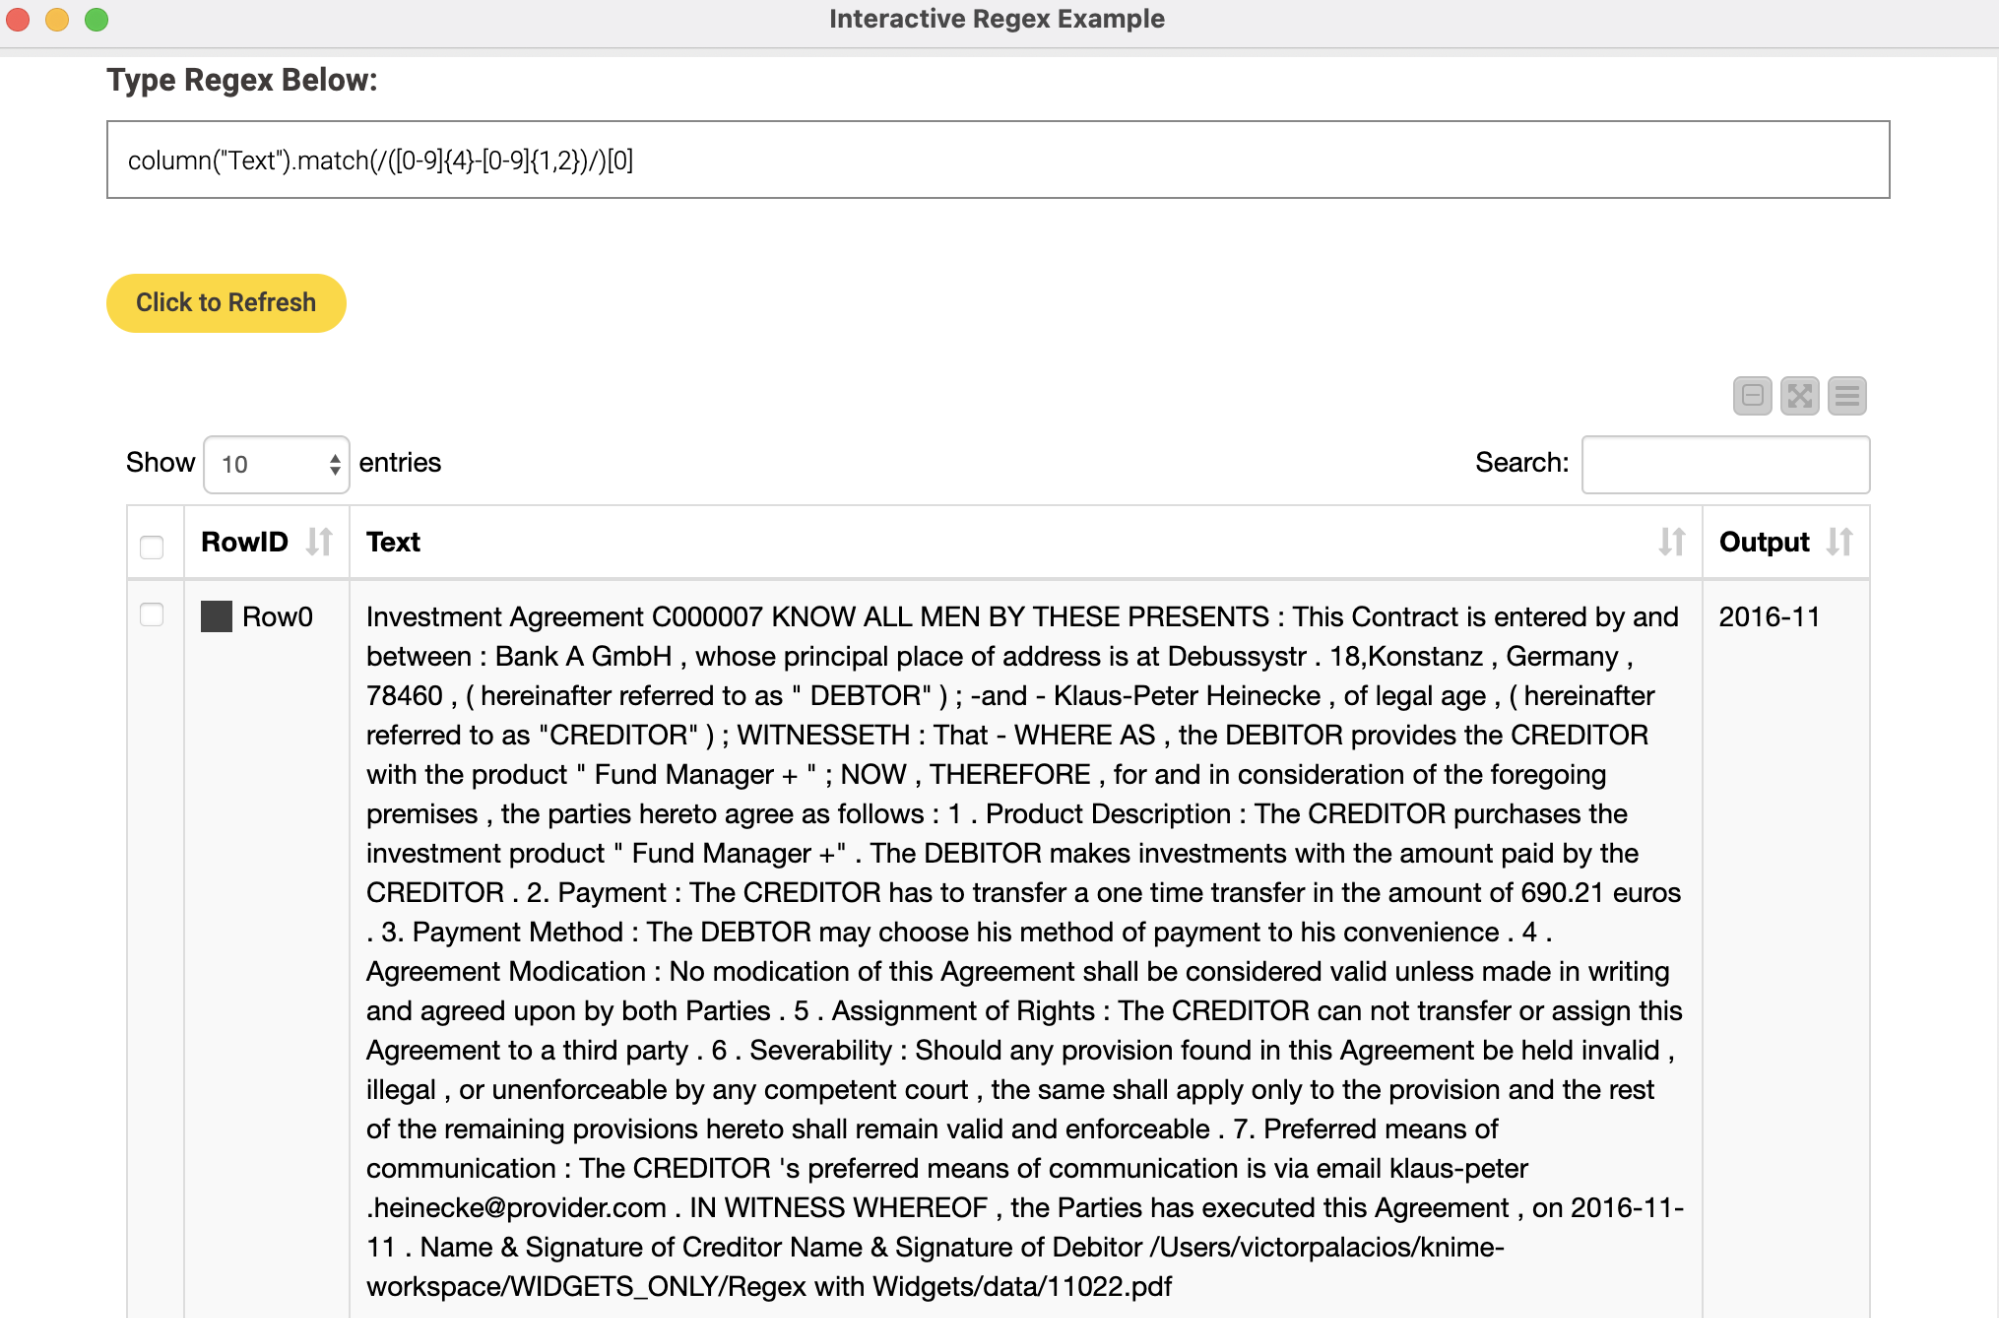
Now let’s use several different widgets to make an interactive view, one in which we can enter a regex to extract the date we need from each document.
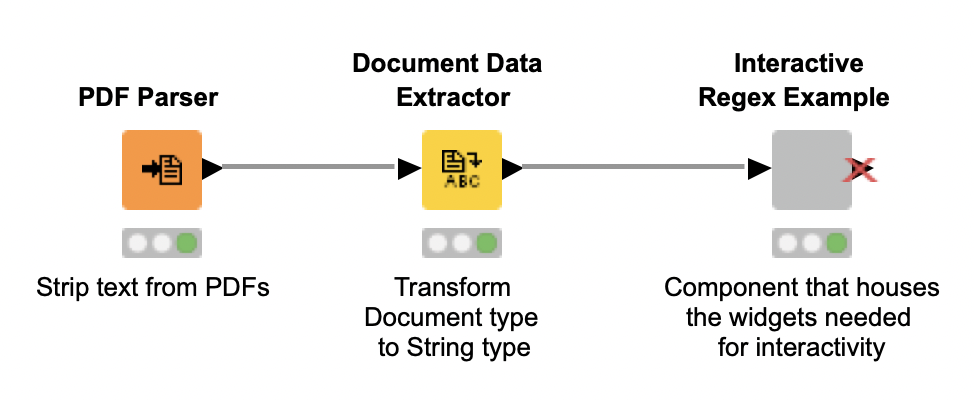
The trick with widgets is that they typically only behave the way you expect them to when you encapsulate them inside a component. This is done by selecting all nodes you want to put inside a component and then right-clicking to create that component. For more details, see KNIME Tutorial – A Friendly Introduction to Components using KNIME Analytics Platform. Let’s see what that gray node (the component) looks like on the inside:
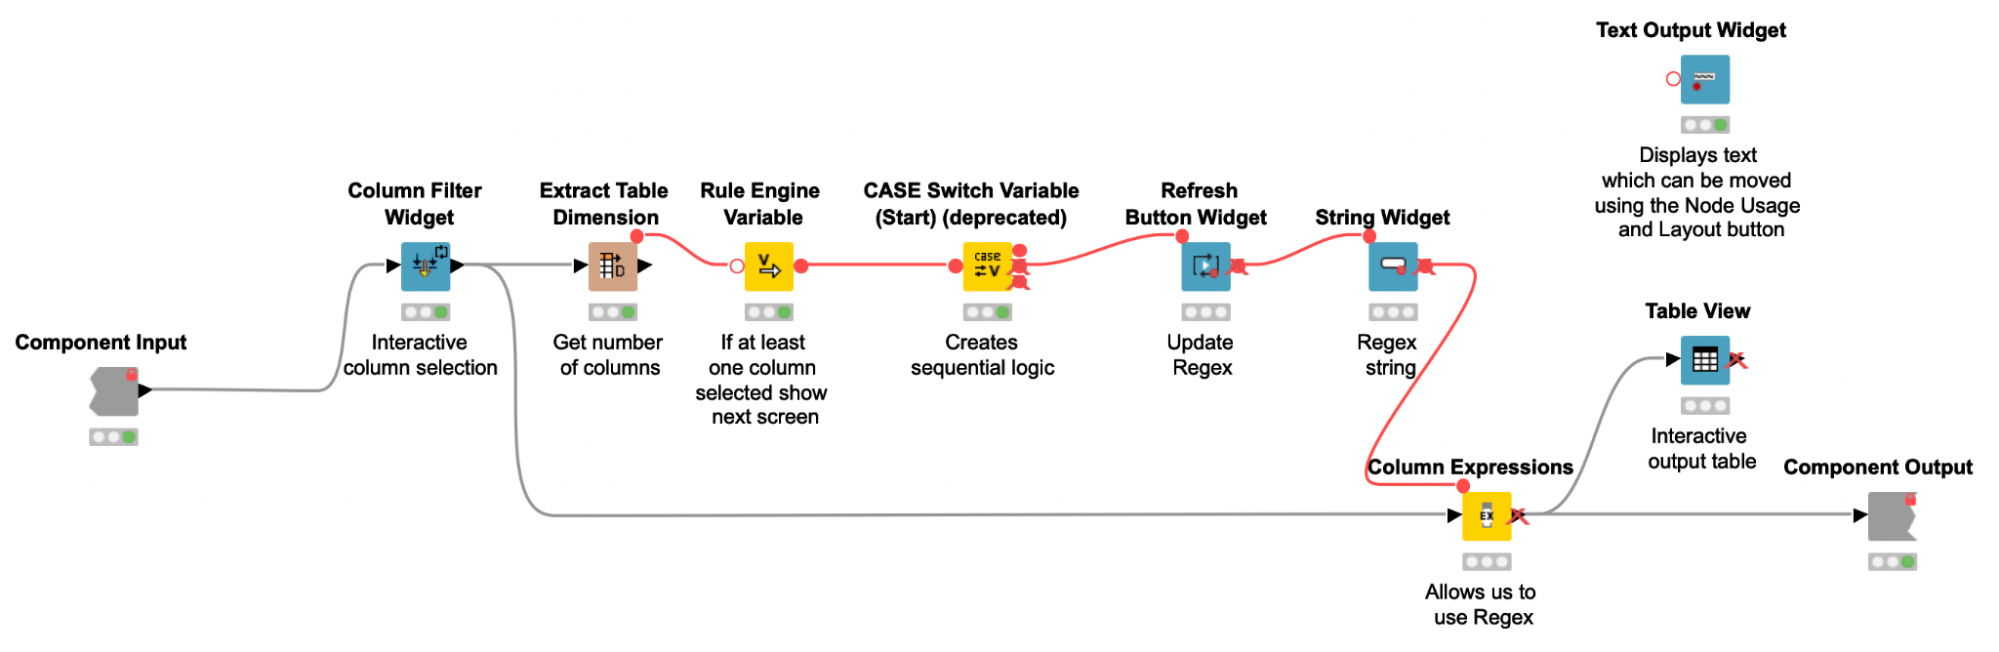
Note. In this figure, we are using flow variables (the red connections) to pass input parameters to other nodes.
Widgets used in the Interactive Regex Workflow
Notice that we could have used two Refresh Button Widgets (placing one before the Column Filter Widget, as we did in previous examples) to create sequential logic (i.e. user selection impacts what appears on the screen next). But because of the new re-execution functionality in KNIME Analytics Platform 4.5, we can simply check the box for automatic re-execution in the configuration window of the Column Filter Widget.
Now let’s get to the real meat of the conversation: the superstar widgets. The String Widget node allows us to enter our regex interactively, and the Refresh Button Widget allows us to make changes dynamically without going back to the workflow.
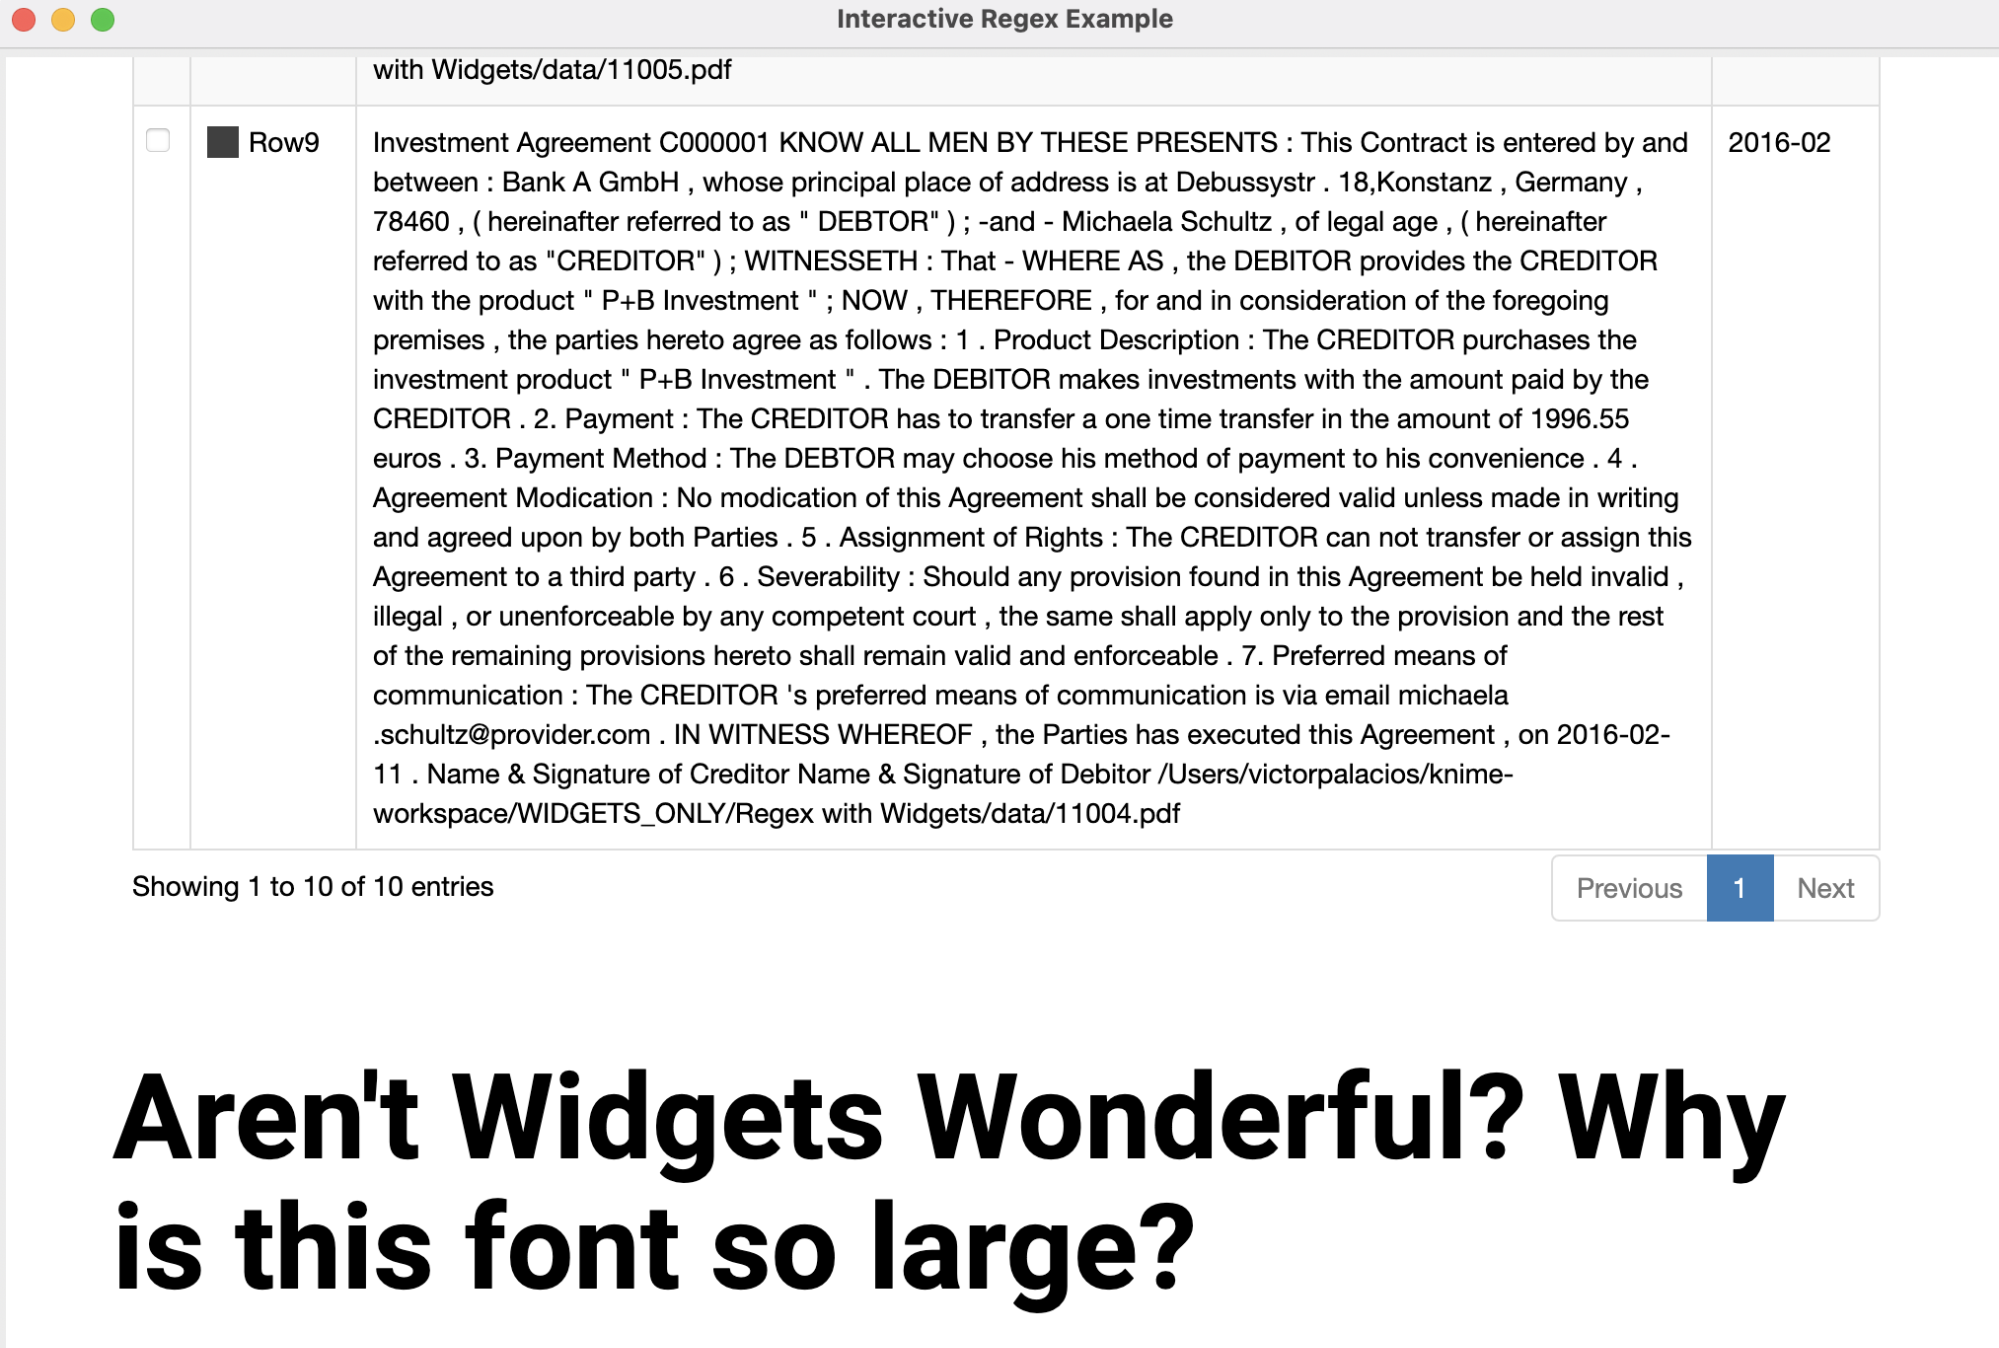
Finally, we added a Text Output Widget which generates some fun text at the bottom of the interactive view. But you can use it for more serious things, like headers!
Widgets for more Interactivity with Your Data Analysis
On KNIME Analytics Platform and the KNIME WebPortal, use a widget node when you want to be able to interact with your data. Here we demonstrated the major types of widgets, and gave examples to demonstrate how they work. You can download a free workflow here which we have built to let you play with widget nodes.
If you are looking for further documentation, see the KNIME Components Guide and if you would like to try some more Re-execution Widget Examples you can download them from the KNIME Hub. Thanks for reading!