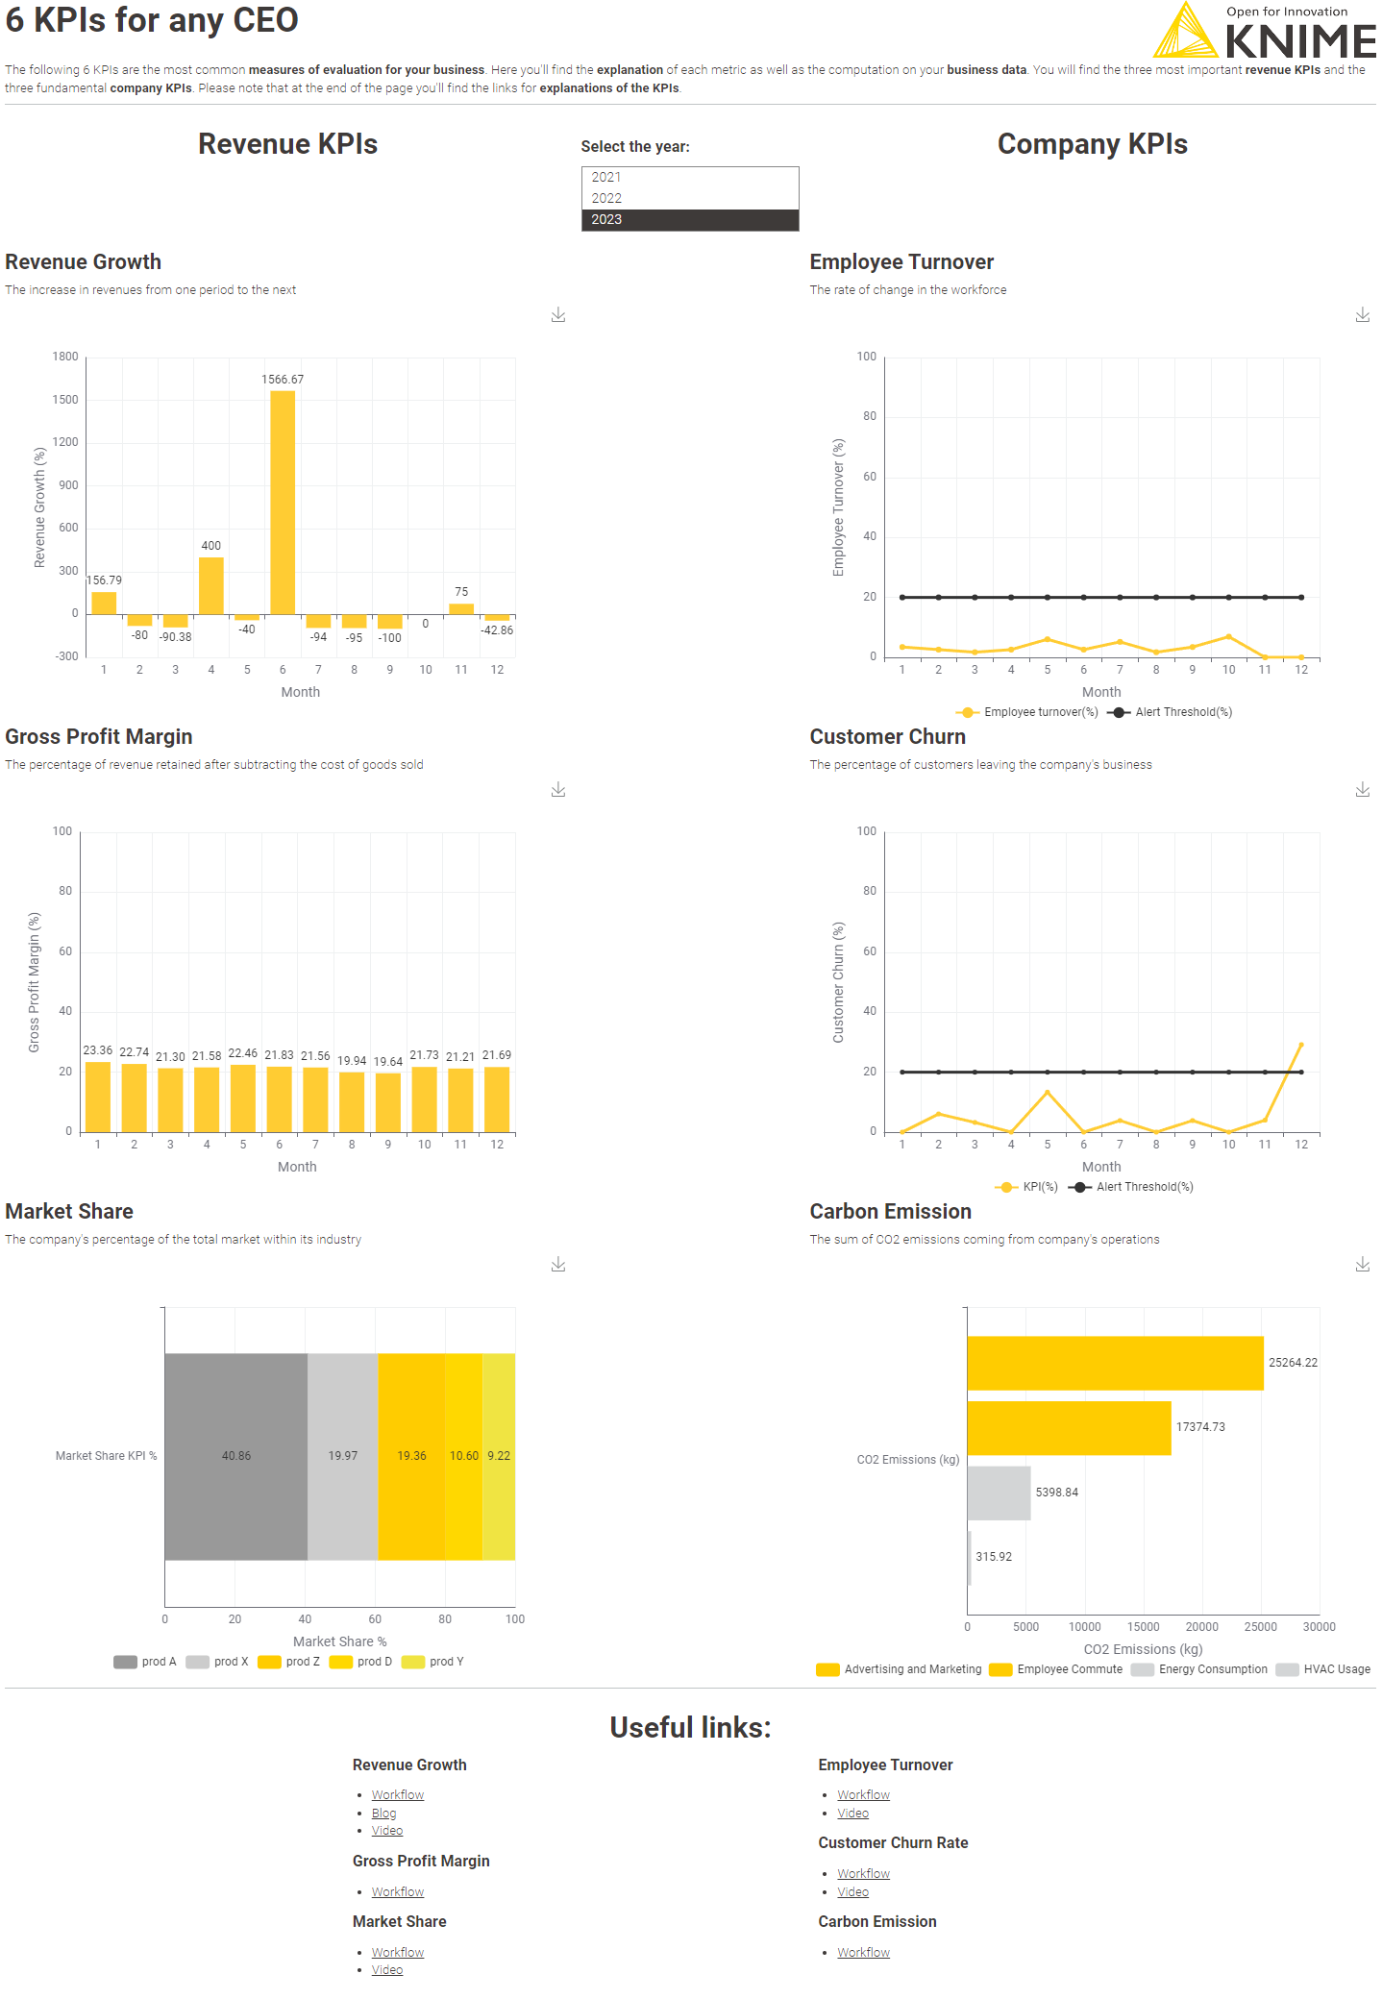
A KPI (Key Performance Indicator) is a metric used to measure how well a business is performing against its objectives. KPIs measure important business metrics, such as revenue, employee retention, customer satisfaction, brand awareness, market share, carbon emissions, and more. CEOs rely on standard KPIs to feel the pulse of the business.
If you work in the data department serving the CEO, it is very likely that you need to work on one or more dashboards including a set of KPIs.
In this article we’ll look at six of the most common CEO KPIs and how you can easily keep track of them each day, week, or month. We’ll cover the following six KPIs:
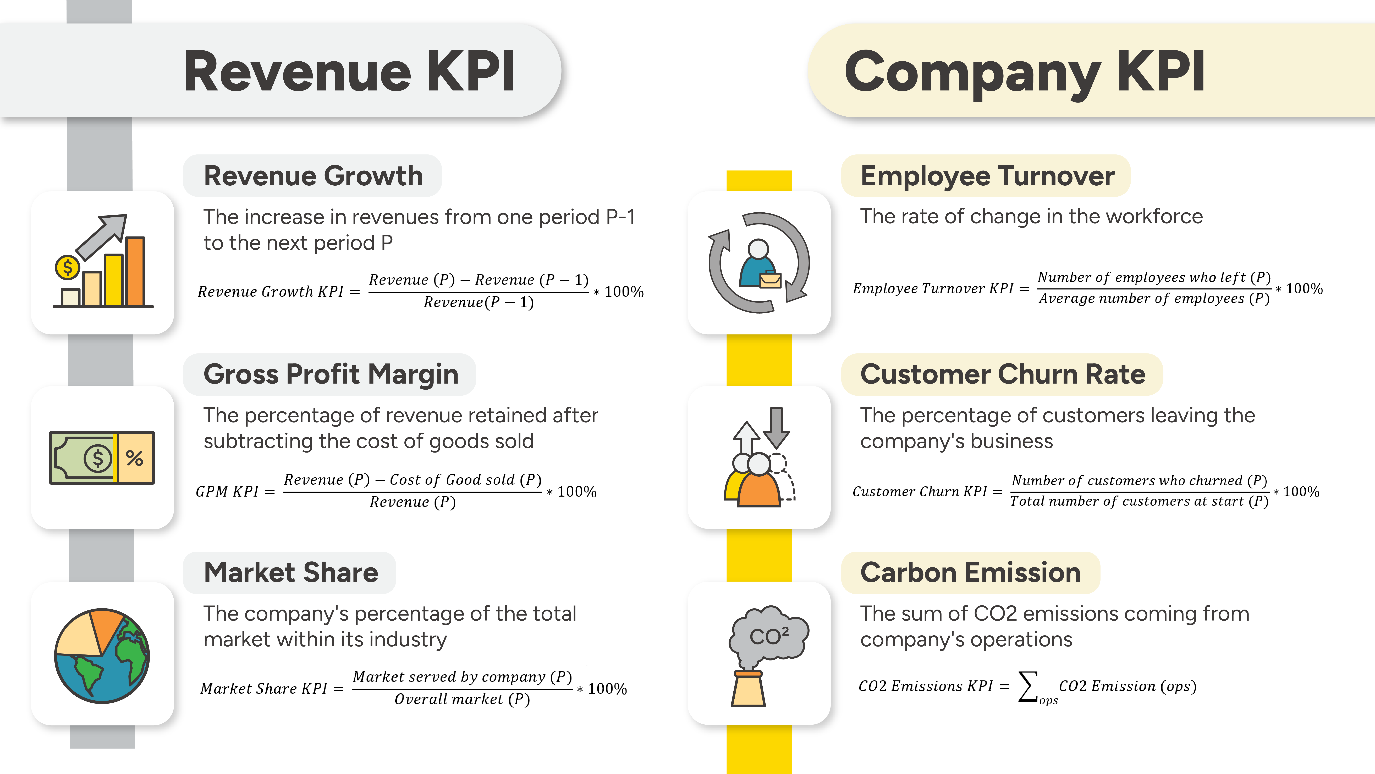
Let’s review and calculate the selected KPIs, one by one, before merging all of them together into one single dashboard.
1. Revenue Growth KPI
One of the main concerns of a CEO is making sure revenue is increasing. Here’s how to calculate the Revenue Growth KPI.
Defining a period P (P = month, quarter, or year), the Revenue Growth KPI can be calculated as:
After accessing your revenue journal entry via Odoo, SAP, Salesforce, other accounting software, a database, an Excel file, or something else, you can adapt the KNIME workflow “Revenue Growth KPI Monthly” – downloadable for free from the KNIME Community Hub – to quickly calculate the monthly revenue growth KPI for your business.
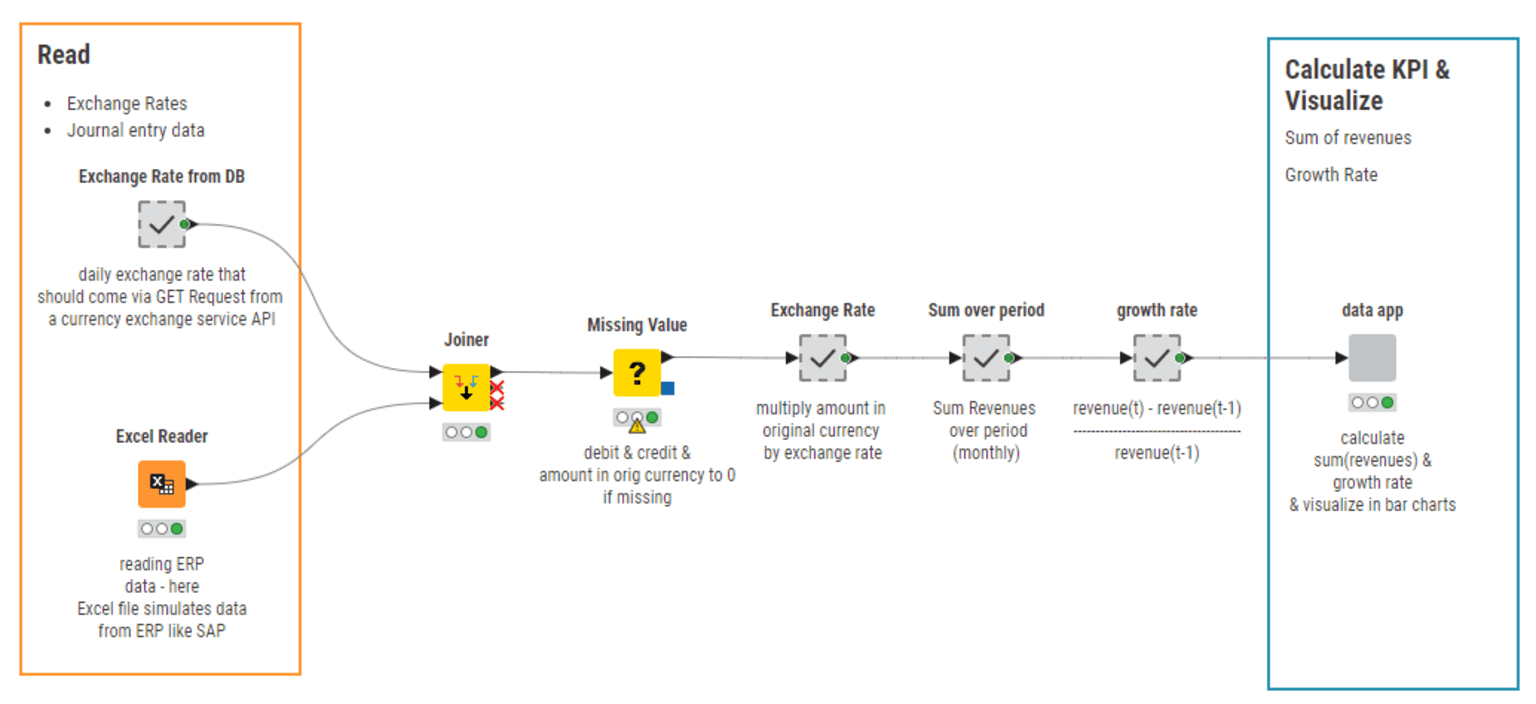
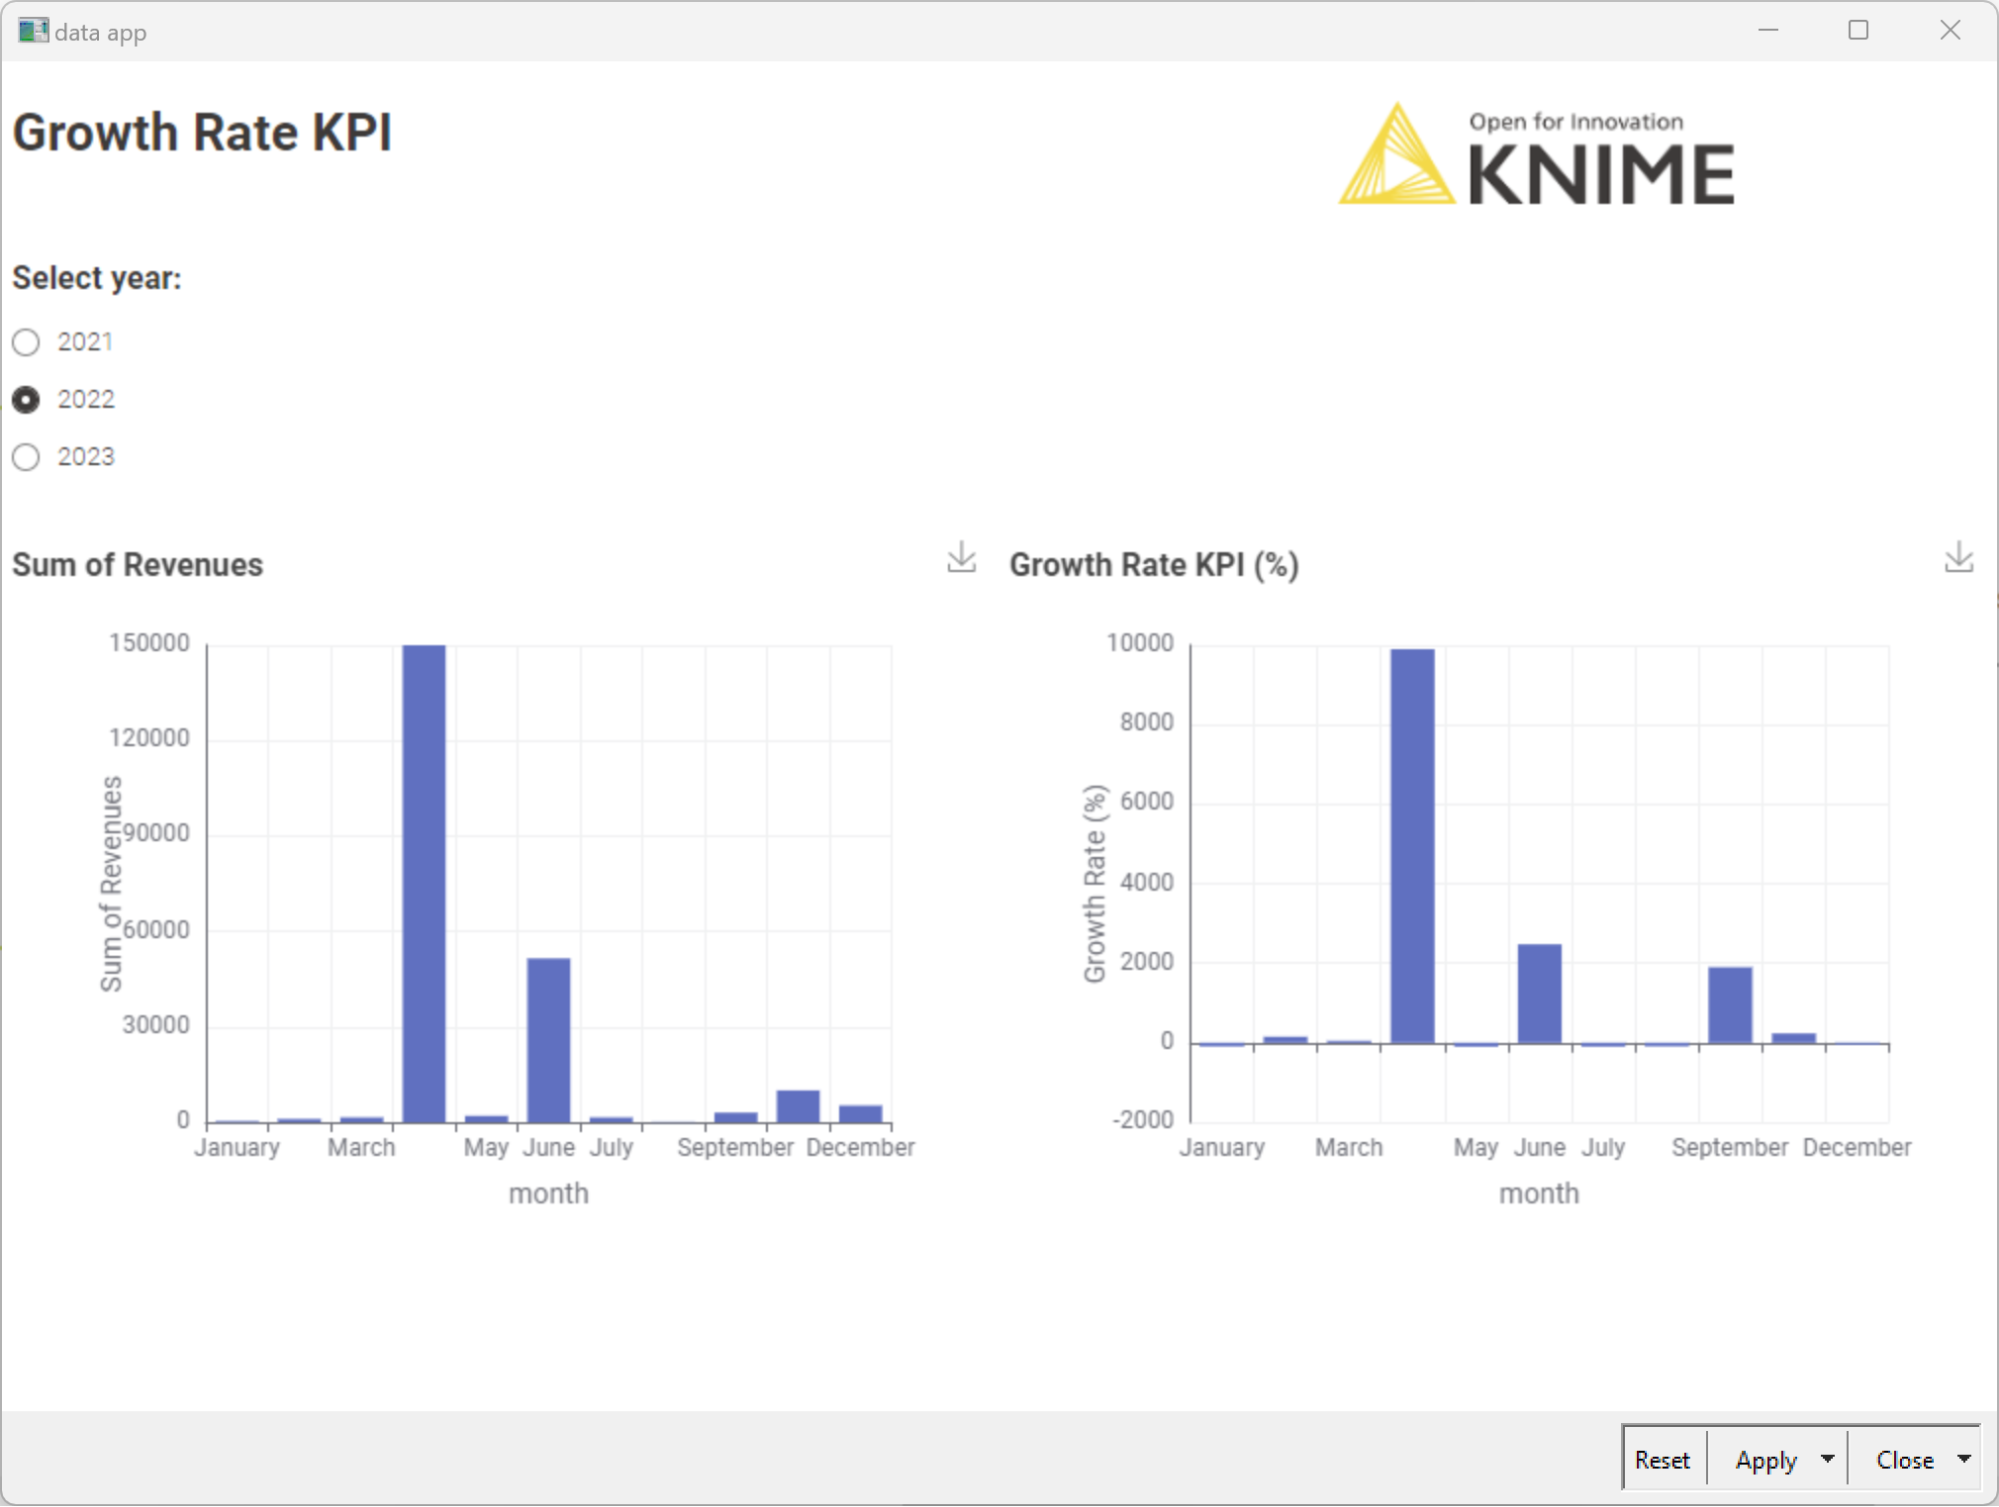
Learn more about how to calculate the Revenue Growth KPI.
2. Gross Profit Margin
While revenue is often the top line figure business focuses most on, it’s not everything. Revenue doesn’t mean much if your costs are also very high. That’s why CEOs often want to measure the gross profit margin.
Gross profit margin measures the amount of profit as a proportion of total revenue, and is presented as a percentage..
The Gross Profit Margin (GPM) KPI is calculated as follows:
You can use KNIME to build a dashboard for the GPM KPI, which makes it easy for you to calculate and observe trends month over month.
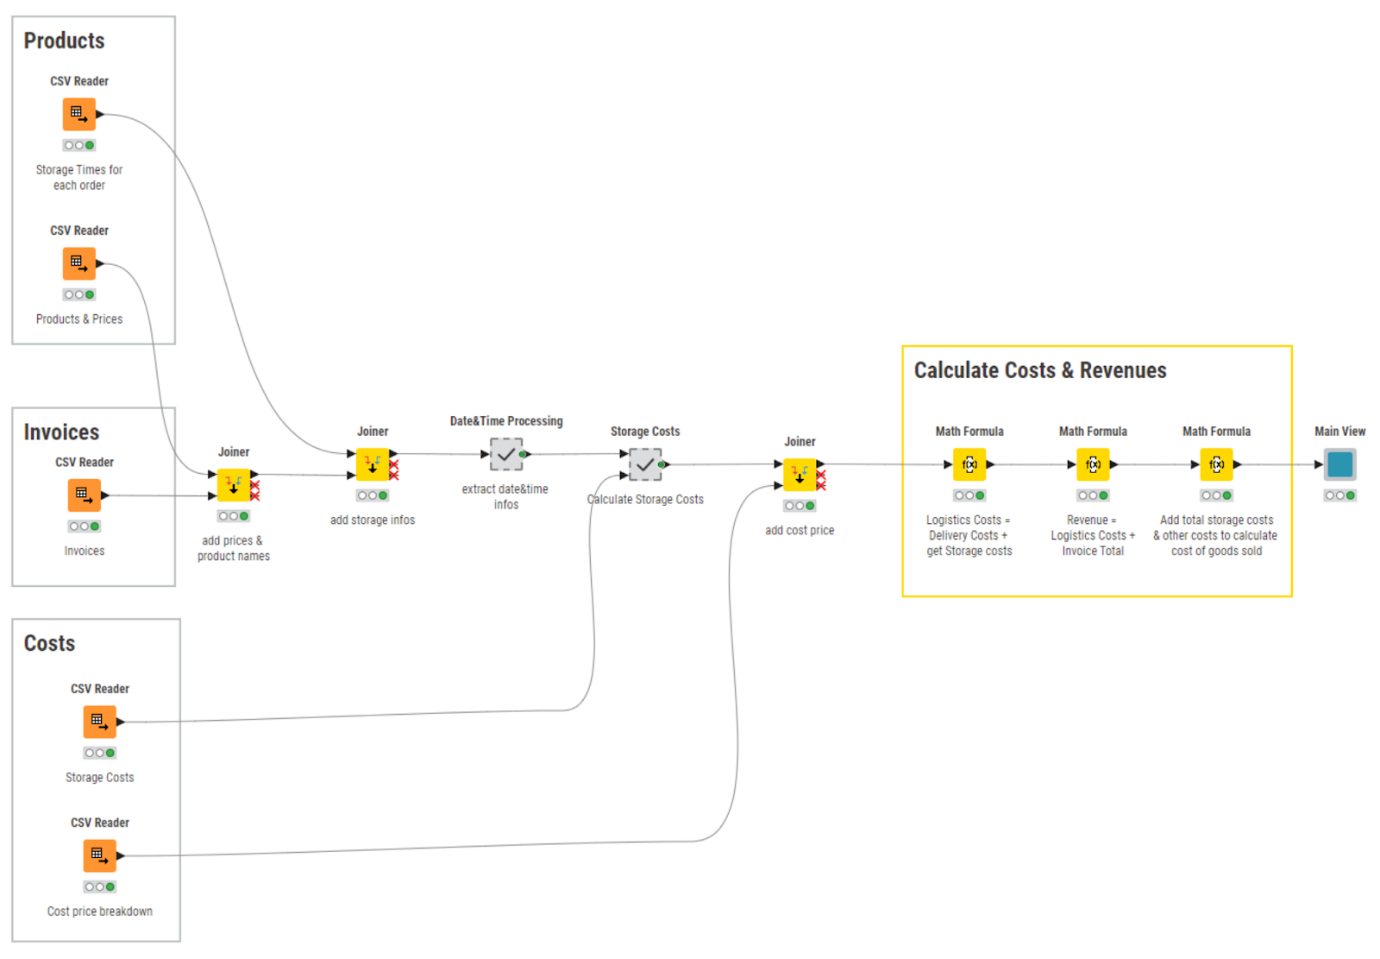
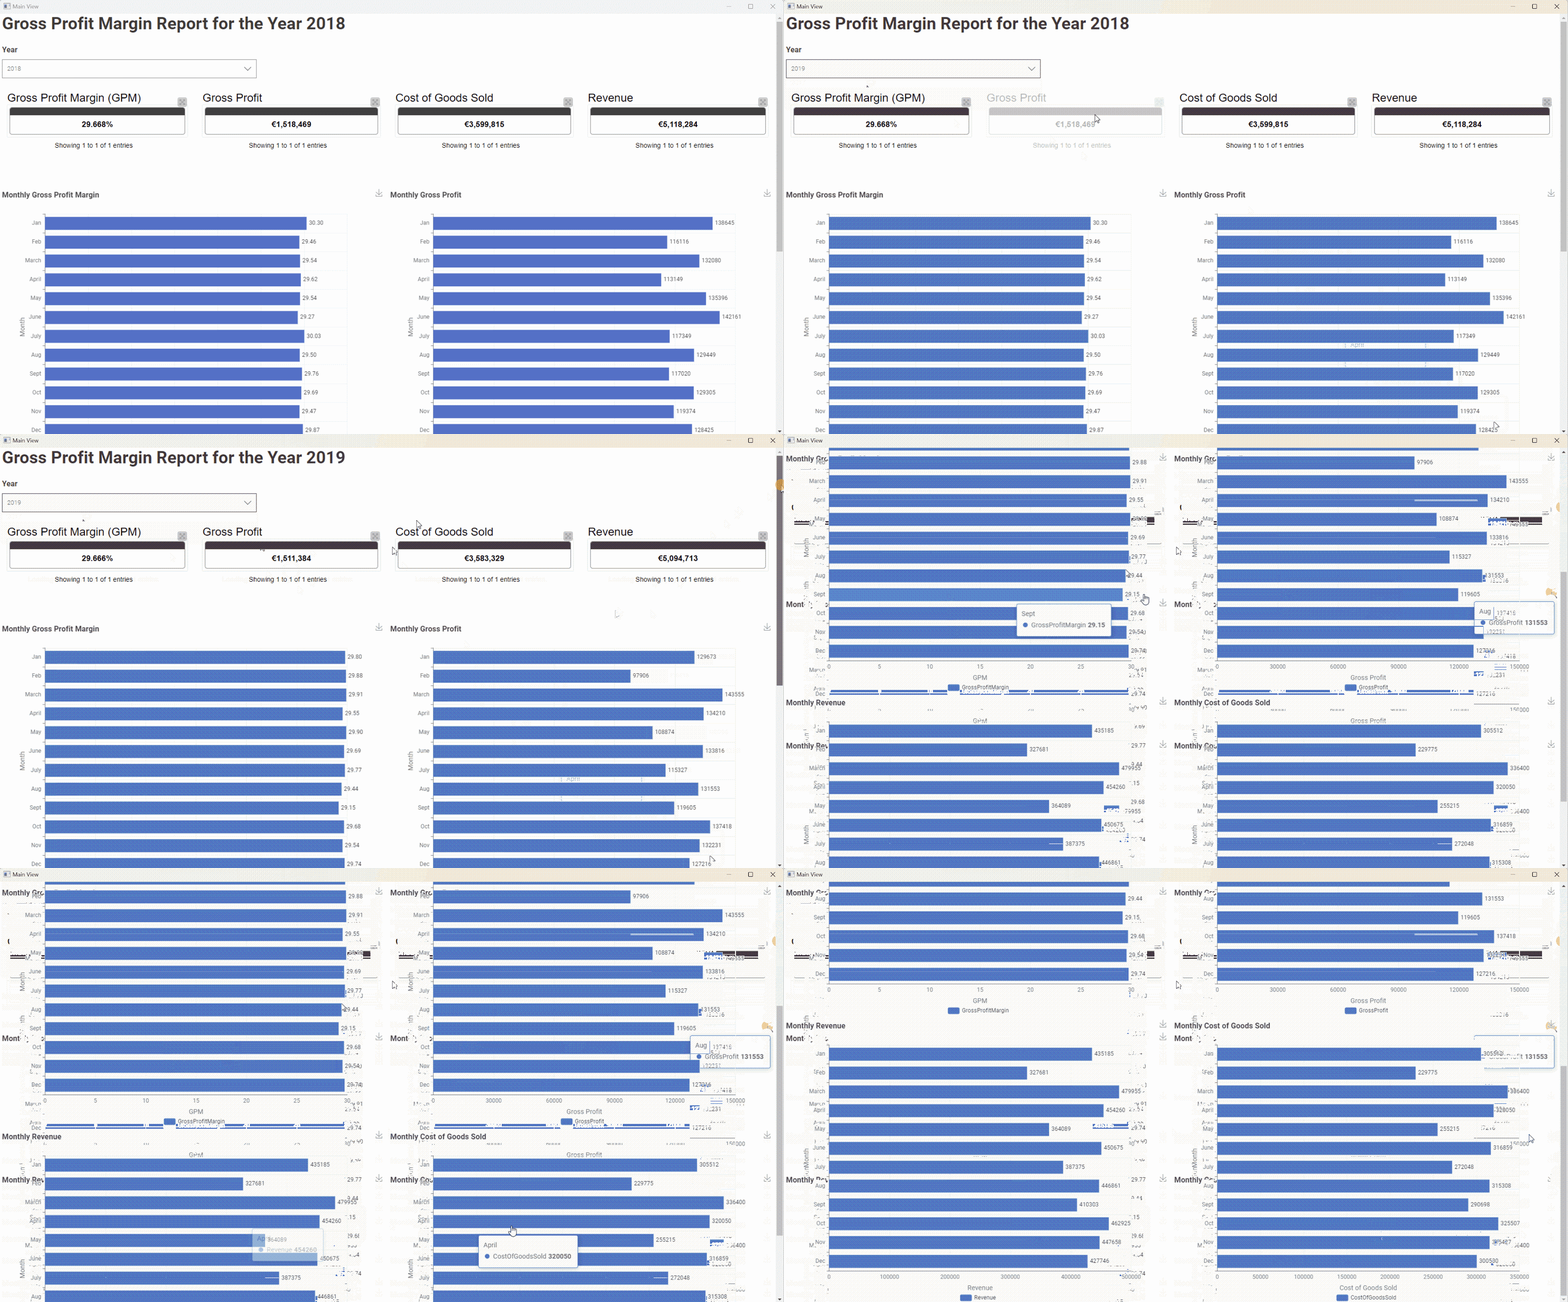
Learn more about calculating your Gross Profit Margin.
3. Market Share KPI
Another important metric for a CEO to monitor is how much of the available market has been covered by the business and what remains for the taking. This is measured by the Market Share KPI. The Market Share KPI measures the percentage of the overall market that a business serves.
This is not a simple KPI to calculate, since the total addressable market cannot be derived from internal data.
The Market Share KPI can be calculated as follows for period P (P=month, quarter, or year):
“Market served by company” can be measured according to the total value of sales or units sold in the designated period.
To estimate the total market size or total addressable market (TAM), you have two options:
- You could buy the data from a third-party company or create an estimation based on the publicly available data from competitors’ annual reports
- You could run a survey and then, assuming the survey is statistically representative, extrapolate the results to obtain an estimate for the total market
The calculation of the KPI is slightly different depending on whether you are looking at one-purchase only markets (like cars) or multi-purchase markets (like food).
Thus the calculation of the Market Share KPI depends on these 4 factors:
- market share as sold units vs sale revenues
- business as one-purchase vs. multiple purchase scenario
- TAM estimated via survey vs third-party report
| TAM estimation | sale revenue est. | market share as | business scenario |
| third-party report | CRM data | units sold | one-purchase |
| survey data | survey data | sale revenues | multiple purchases |
We implemented a few workflows for Market Share KPI, using different combinations of the four factors above. You can find all of the workflows to calculate the Market Share KPI in the Market Share folder within the KPI folder.
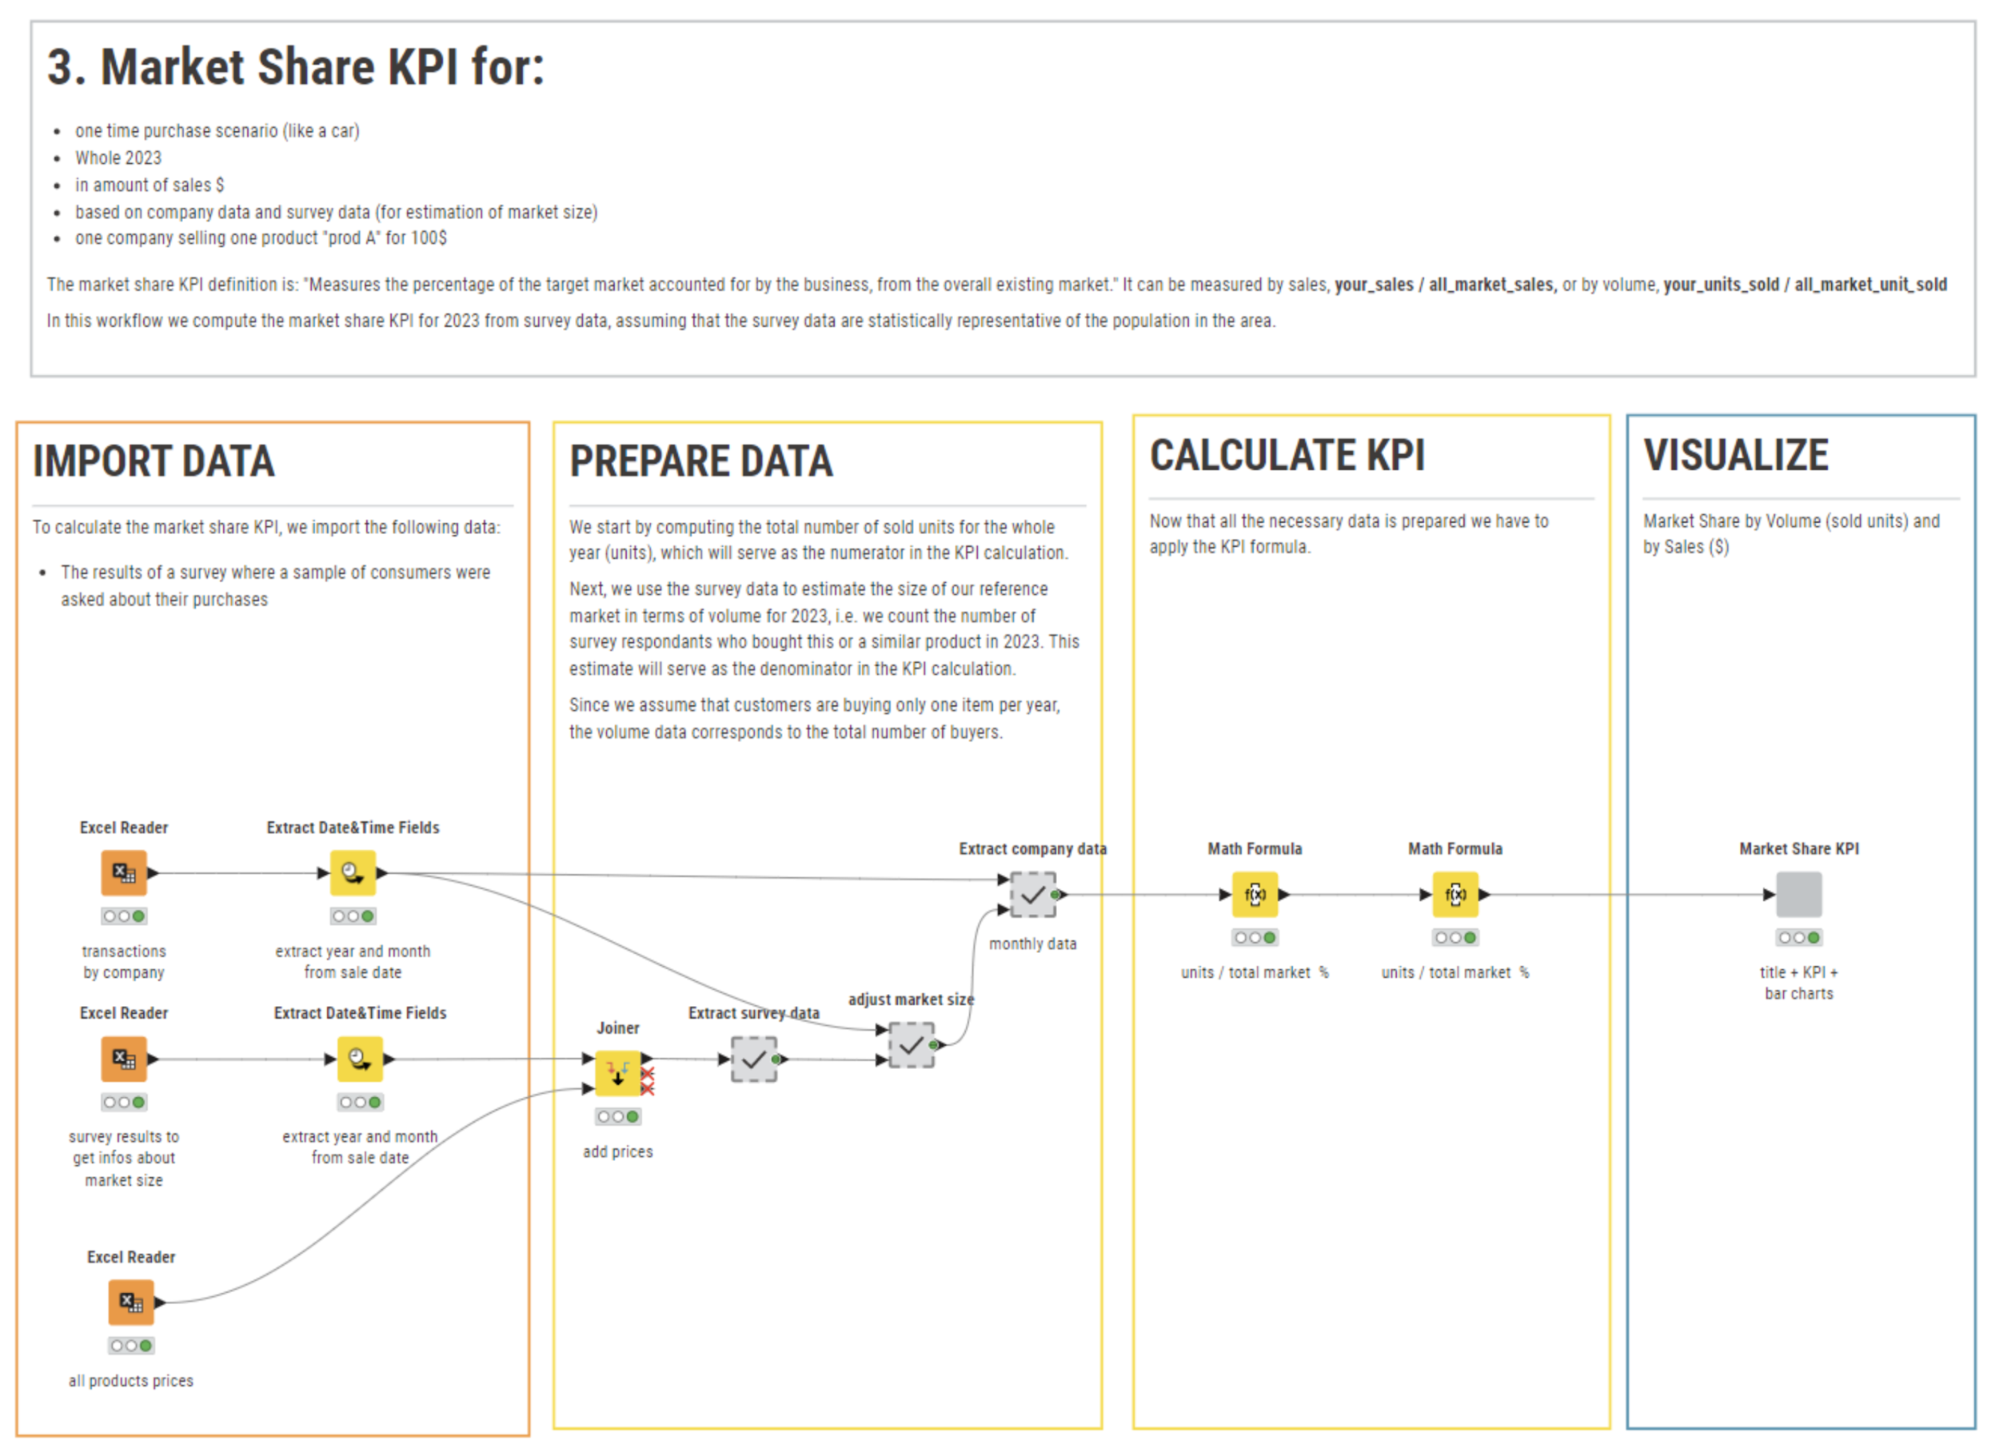
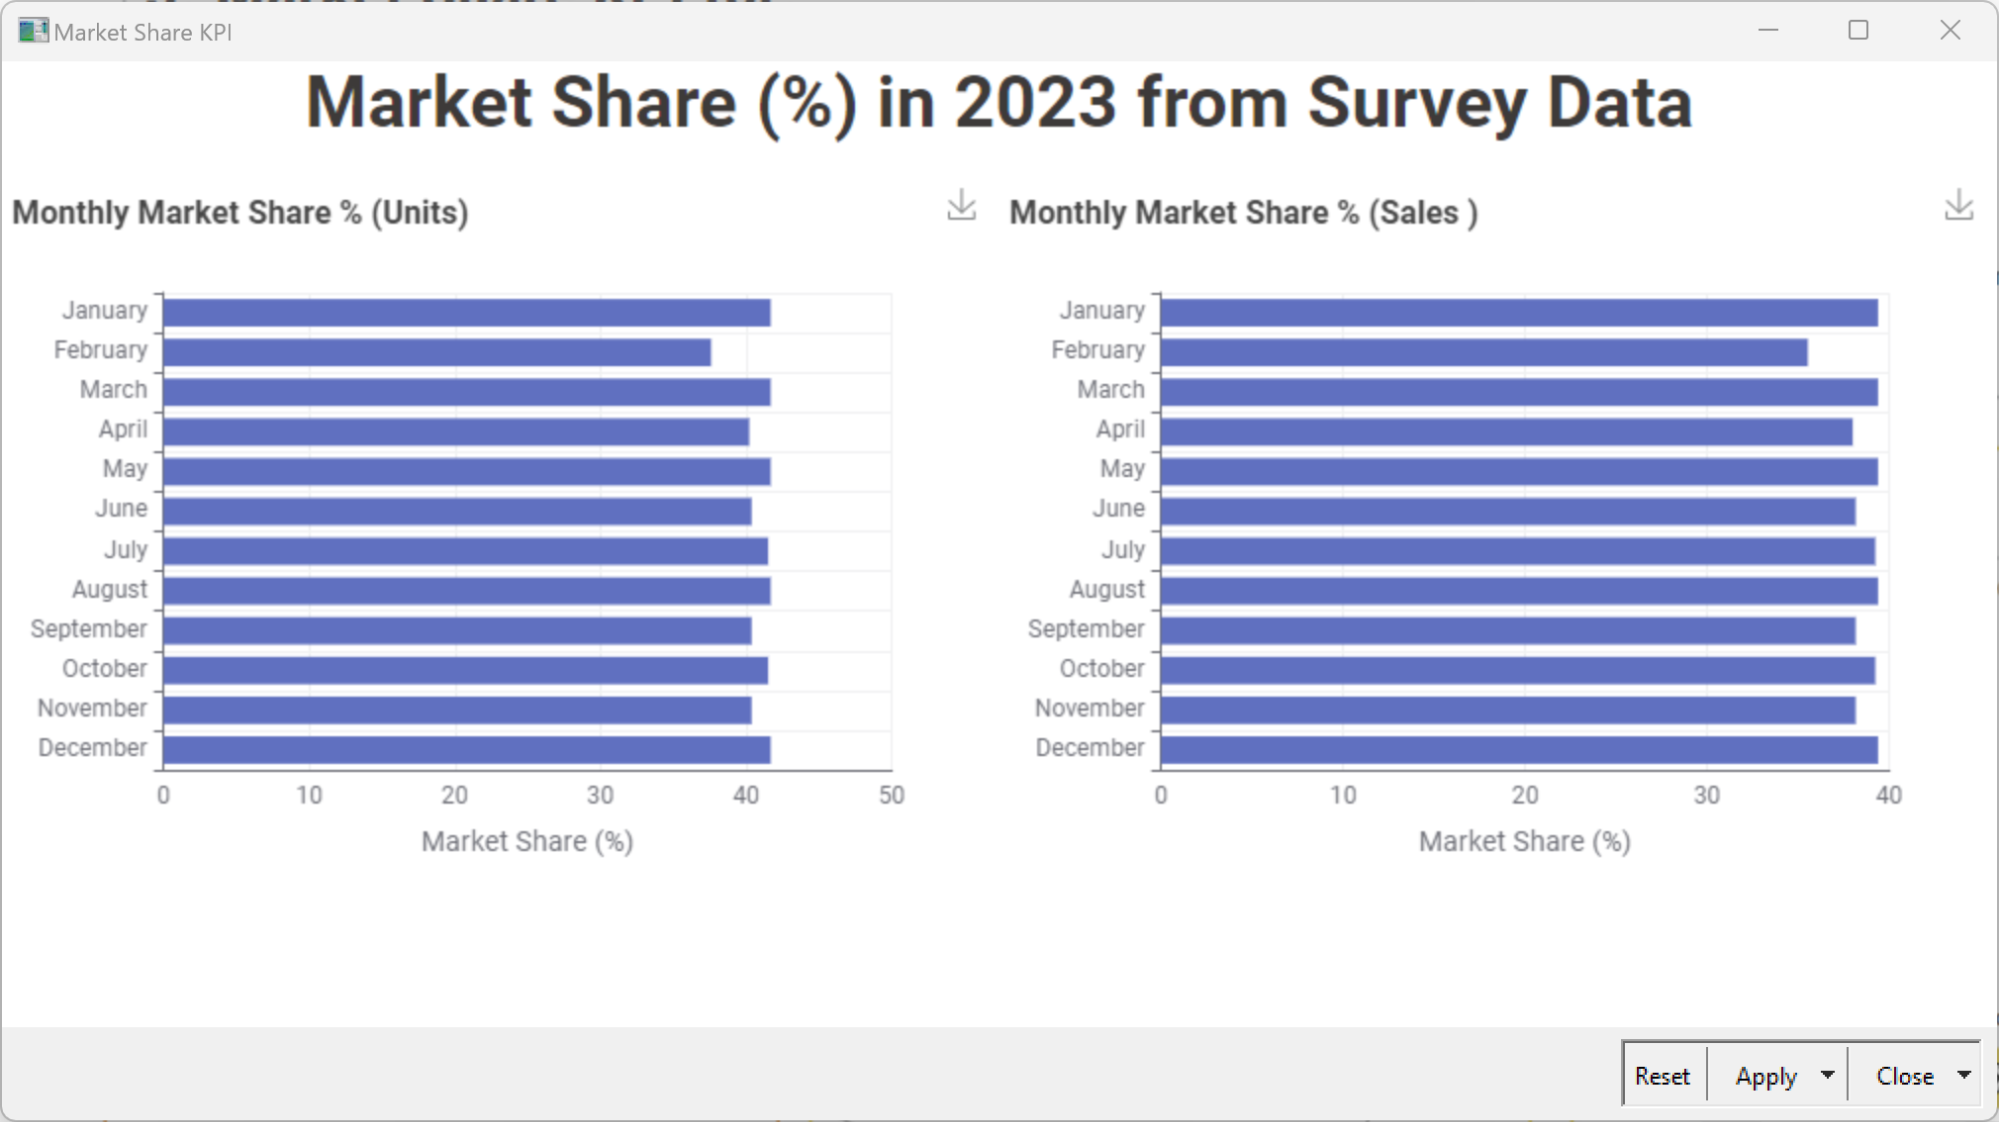
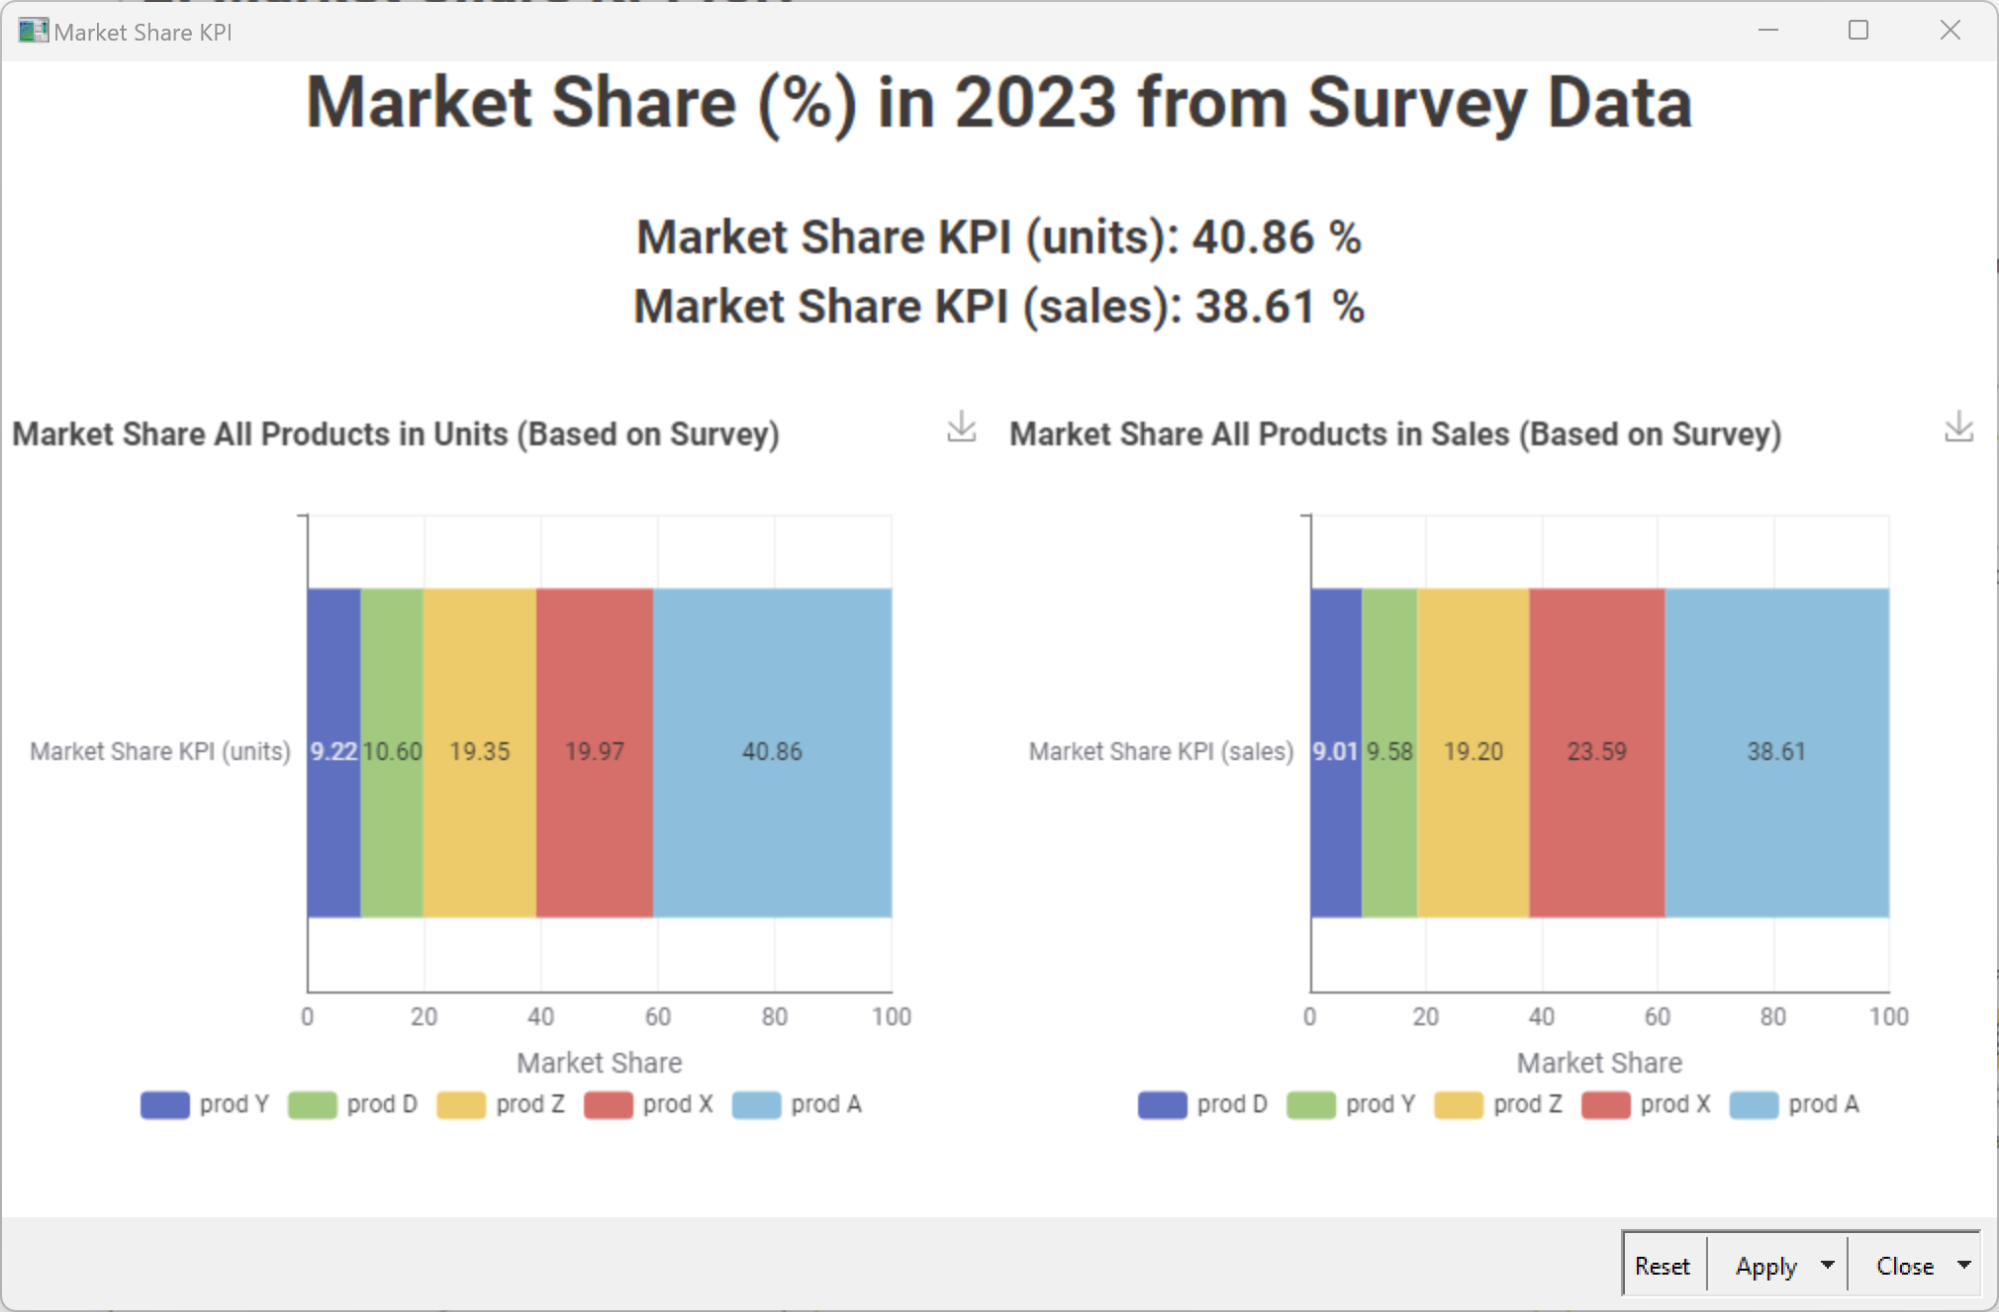
Learn more about calculating your Market Share KPI.
4. Customer Churn KPI
Once sales are going up and salaries are paid, the next immediate worry for CEOs is customer churn. Maintaining low customer churn enables your business to have fewer revenue fluctuations, operate within a margin of safety, and maintain a healthy business and product/service satisfaction.
Customer Churn KPI measures how many customers are churning over a period P (P = month, quarter, or year) and can be calculated as:
This KPI should be monitored within an acceptable range to make sure customer churn levels do not endanger the business.
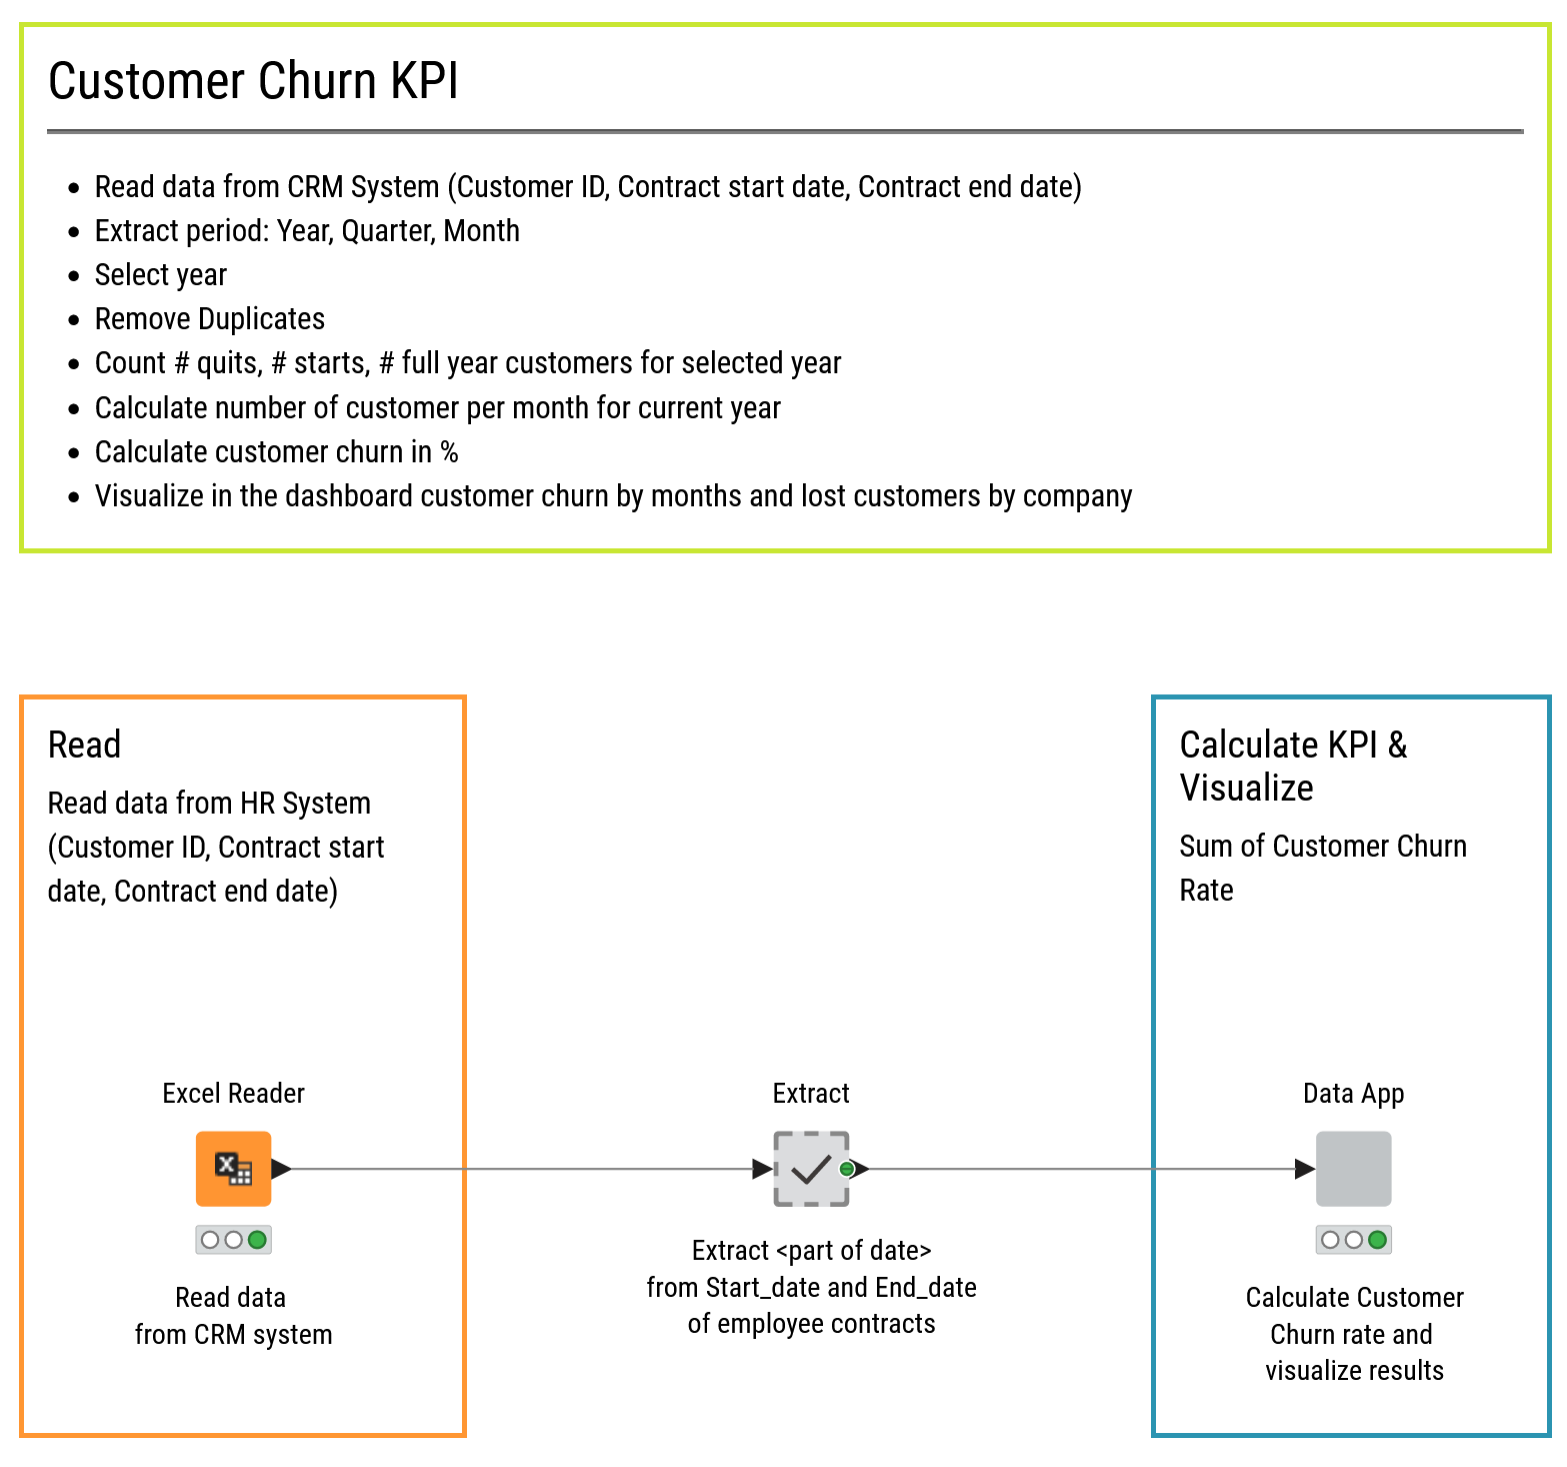
After connecting to the company CRM, the workflow “Customer Churn KPI Monthly” calculates the Customer Churn KPI month after month. Here’s how it works:
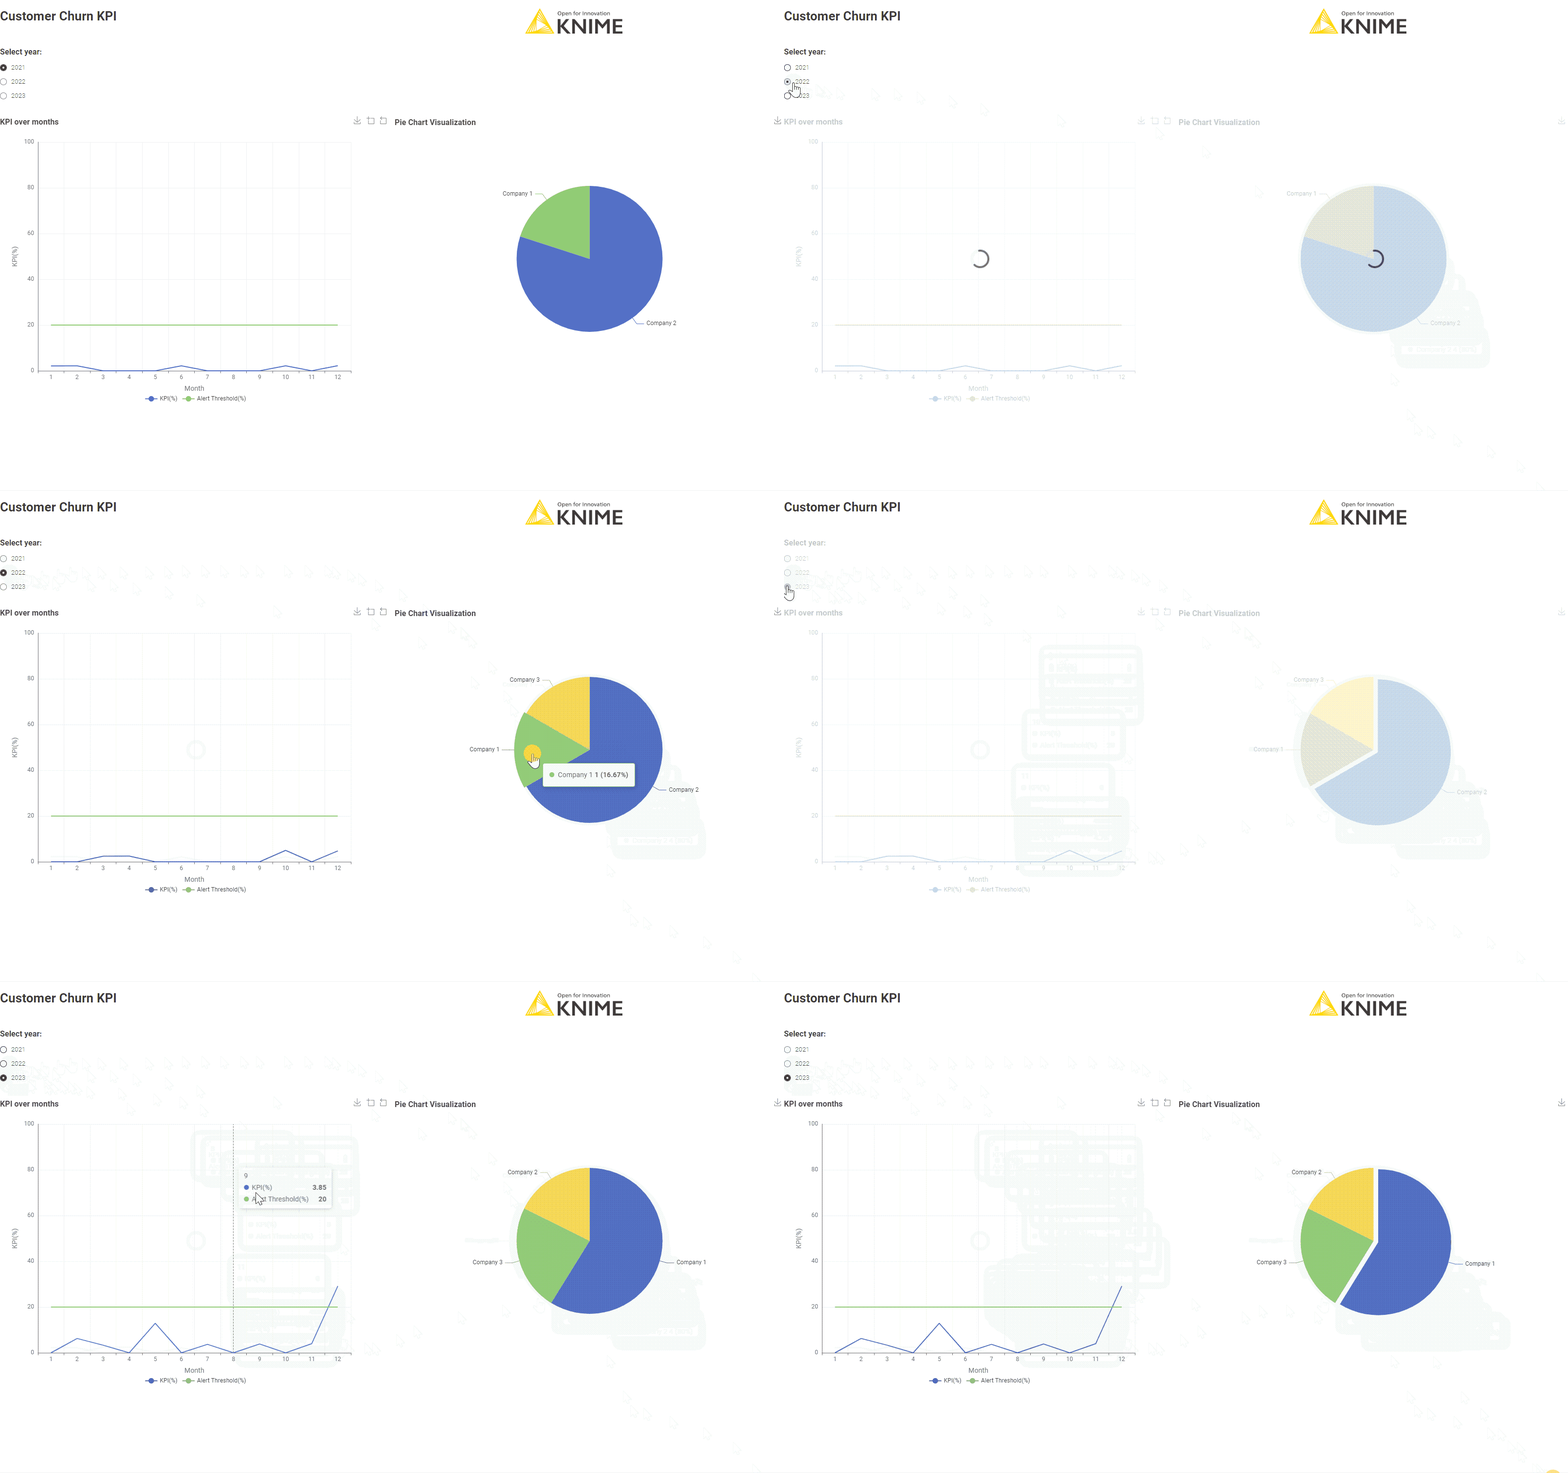
Learn more about calculating customer churn.
5. Employee Turnover KPI
CEOs don’t only look at financial metrics, but also internal metrics. That’s why the next key KPI for CEOs is the Employee Turnover KPI.
The Employee Turnover KPI is calculated over a period P (P = month, quarter, or year) as:
The Employee Turnover KPI is usually monitored to remain below a healthy threshold. Employee turnover is inevitable. However, employee turnover above a given threshold (usually over 10% annually) is considered a warning sign about the company culture and/or business.
The corresponding workflow “Employee Turnover KPI Monthly" is similar to the workflow implementing the Customer Churn KPI. After connecting to the company HR system, the Employee Turnover KPI is calculated according to the formula above.
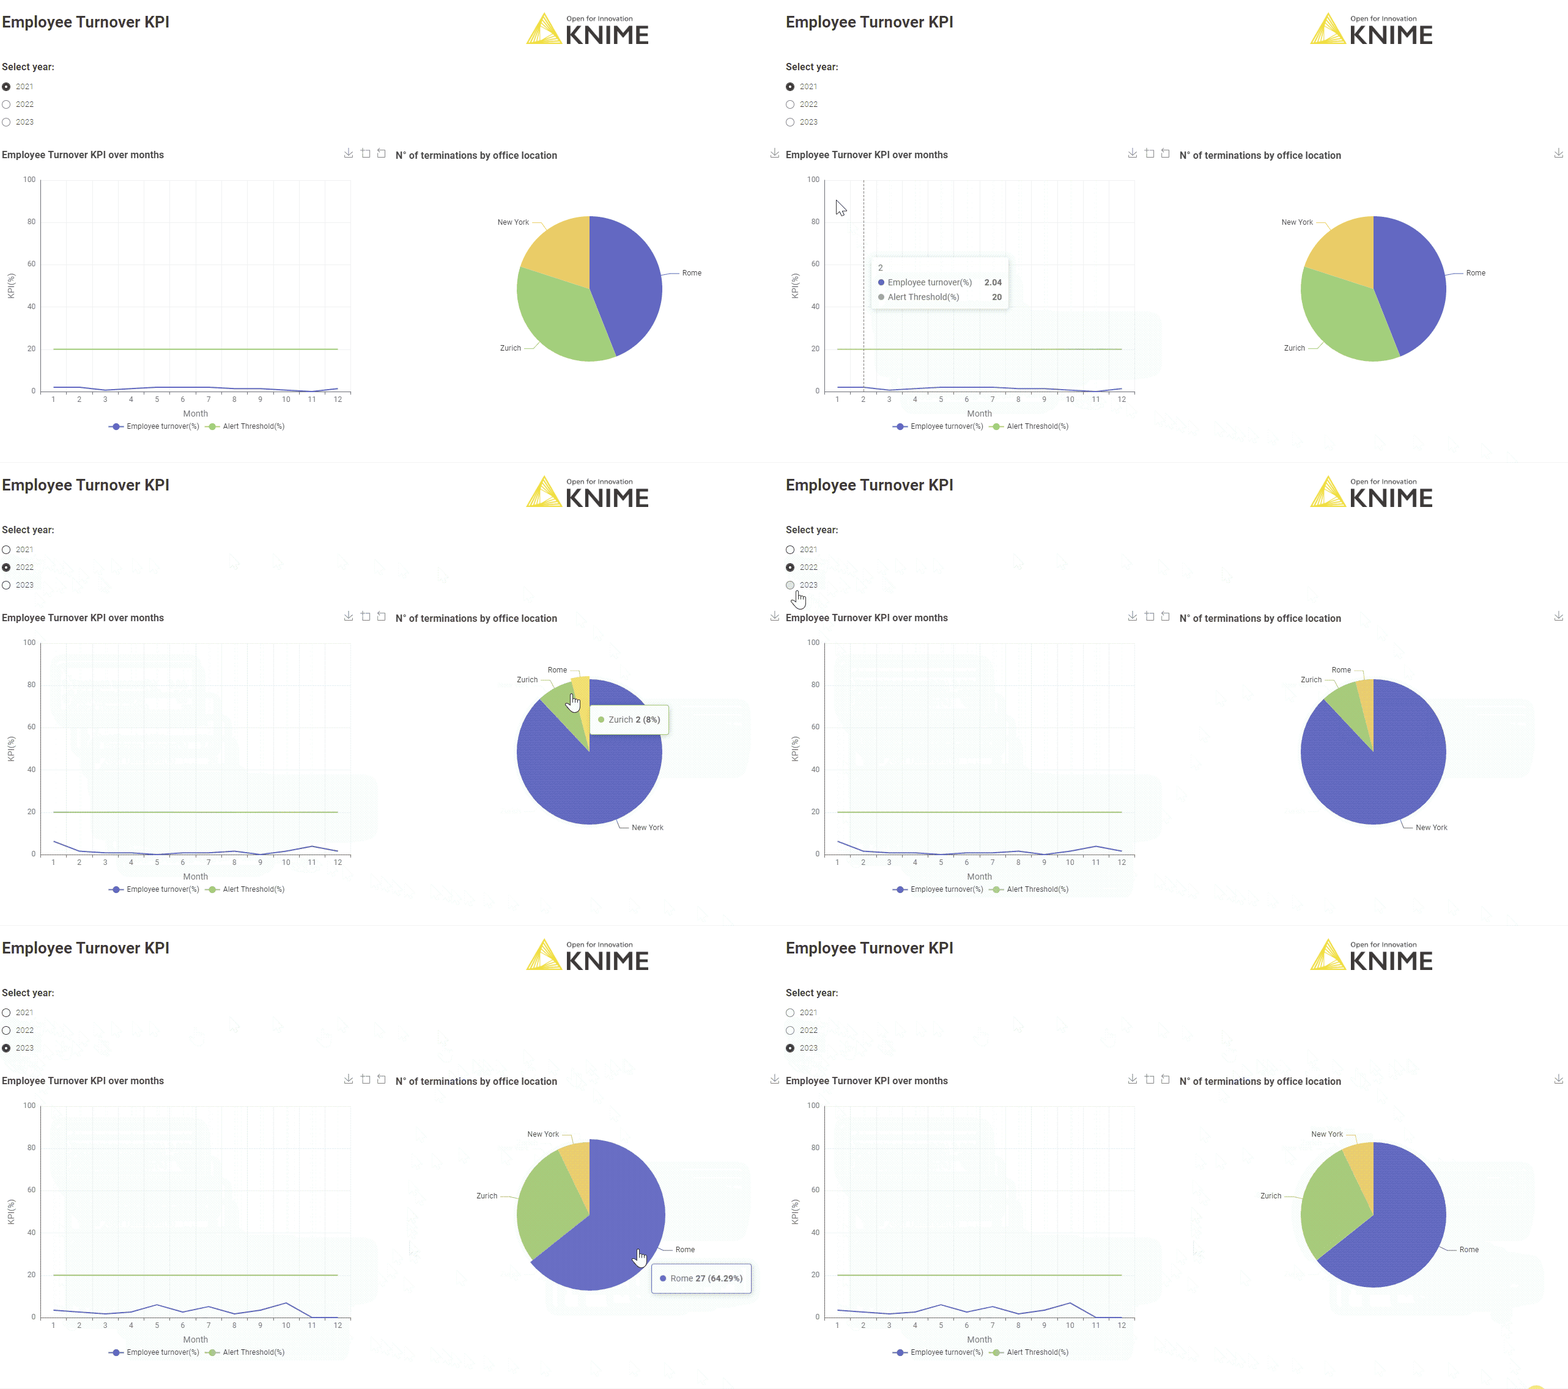
Learn more about calculating your Employee Turnover KPI.
6. Carbon Emissions KPI
Companies are becoming more sensitive to climate change issues and are taking measures to reduce their carbon footprint. In some cases, there may be a regulatory or legal requirement to report on this KPI.
Tracking carbon emissions is not always straightforward and relies on a number of assumptions.
For example, a decision must be made about which CO2 production the company is actually responsible for?
Usually, CO2 emissions are classified according to sources (primary or secondary sources) and/or scopes (scope 1, scope 2, scope 3).
- Primary sources refer to the CO2 generated directly by the company, let’s say via transportation or via the manufacturing plant;
- Secondary sources refer to the CO2 generated by third parties working with the company.
- Scope 1 refers to direct emissions produced by the company’s business;
- Scope 2 refers to purchased services; and
- Scope 3 refers to indirect emissions like employees’ travels.
For this example, we classified primary and secondary sources and limited our KPI to the calculation of primary CO2 emissions.
Once you’ve decided what types of emissions you will calculate, based on source and scope, the next issue is how you will calculate CO2 emissions. For example, I could travel from A to B by car or by train. What is the CO2 I produced in both situations? The distance is the same, but the method of transportation is different, and therefore the CO2 emissions are different, too. And then how am I supposed to convert kilometers travelled to CO2 volumes?
There are so called factors that allow you to convert activities (electricity usage, travel by car or by train, etc…) into CO2 volumes.
So far, no standard factors have been proposed and accepted as general rules. Consulting companies and research institutions usually offer their own. For this calculation we used the coefficients proposed by the UK government in the Greenhouse Gas Reporting: Conversion Factors for 2023.
The CO2 emission KPI can then be represented with the following formula, as the sum across all company operations of consumption (measured in kWH, kilometer, or any other measure) times the corresponding CO2 factor.
Below is the dashboard created to monitor the fictitious company’s CO2 emissions, after taking into account the following sources:
- Energy consumption & HVAC usage
- Employee commuting and travel
- Advertising & marketing research
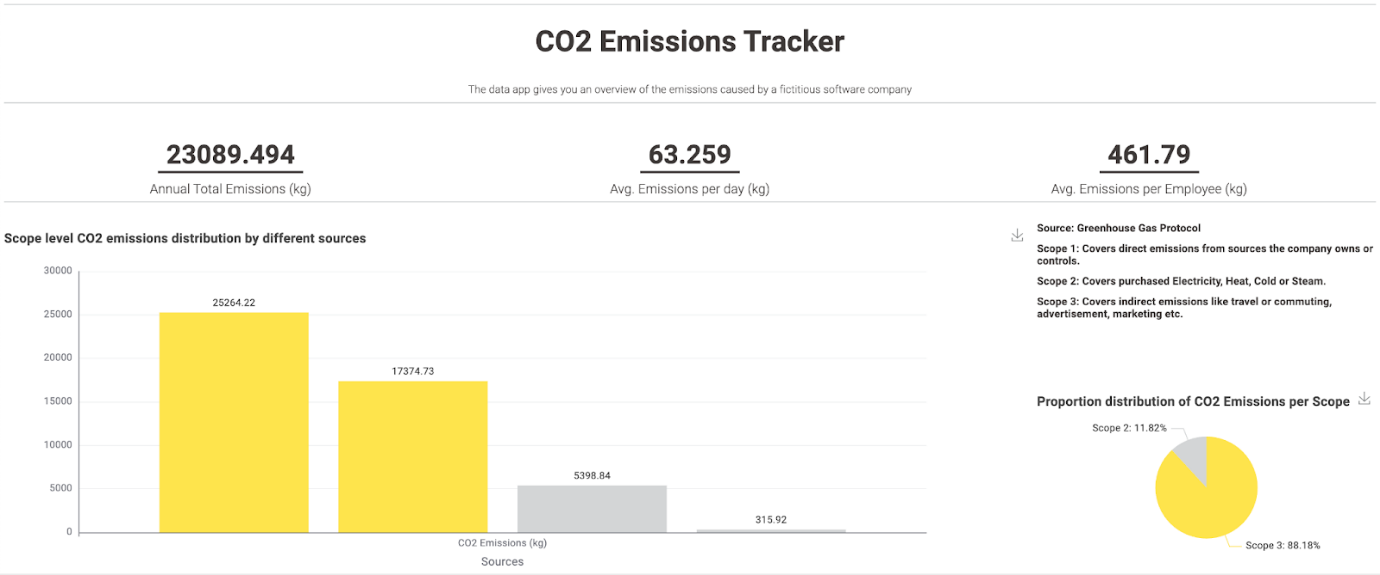
The workflow “CO2 Emission Tracker” generating this dashboard is available for free.
Learn more about how to calculate your CO2 emissions.Displaying all KPIs in a single data app
We’ve calculated six commonly used CEO KPIs. We have seen the math behind them, which part of the business they help monitor, and how to create workflows that allow you to build a calculation once and re-calculate with the latest data in just a click every month.
Did you know you can also combine all 6 KPIs into a single interactive data app for consumption by your CEO or company leaders? This dashboard is created by the workflow “Data App - 6 KPIs for any CEO”, available for download from the KNIME Community Hub. Try it out for an even better way to keep track of your most important KPIs.
