KNIME data apps are interactive, browser-based interfaces built from workflows. They are designed to support real business and operational needs.
Whether you're interpreting revenue growth, auditing purchases and suppliers, reconciling bank statements, or analyzing customer sentiment, KNIME data apps help teams explore, validate, and act on data — all in one place. Each data app example runs in the browser for easy exploration, with no setup required. You can inspect the underlying workflow, customize it for your data, and adapt it to support new use cases.
Here are nine data app examples. Each one demonstrates how interactive workflows can solve practical challenges and deliver real value. You can try them all in your browser to see exactly how they work.
1. Purchases and Suppliers Auditing
Internal audits help organizations monitor purchasing activity, ensure policy compliance, and assess vendor efficiency. This KNIME data app supports audits focused on purchasing and supplier management by highlighting spending levels across departments and suppliers.
The workflow processes internal purchasing data and applies adjustable spending thresholds based on defined standards. It then visualizes two key audit areas in an interactive interface:
- Purchase Limit Checks by Department or Group: You can review which departments or teams exceeded their purchasing limits. Results are displayed in an interactive dashboard, and you can download Excel reports for offline review.
- Supplier Spending Analysis: You can identify suppliers whose spending exceeds defined thresholds. The data app supports both individual and batch report generation, with the option to export selected data to Excel for further analysis.
Relevant Use Cases
This data app is useful for finance, procurement, and internal audit teams aiming to improve oversight and transparency. Use it to:
- Flag departments that exceed purchasing limits
- Detect vendors with unusually high spending
- Standardize internal audit processes
- Export structured reports for compliance and review
- Support procurement planning and policy enforcement
This data app provides a reusable, auditable view of purchasing behavior, supporting more informed decision-making and responsible resource management.
2. KPI Monitoring Dashboard
Staying on top of company performance requires fast access to reliable indicators. This KNIME data app helps track six essential business KPIs by combining automated extraction, centralized visualization, and real-time reporting in one place.
The workflow pulls structured KPI data from a preprocessed SQLite database — or optionally from ERP, CRM, HR, or market intelligence systems.
It covers six key metrics:
- Revenue Growth
- Gross Profit Margin
- Market Share
- Customer Churn
- Employee Turnover
- Carbon Emissions
Each metric is visualized across the past few years. You can explore each KPI in a unified and interactive interface, supporting real-time analysis and faster business decisions. Want to see how it works? This blog post walks through the full workflow.
Relevant Use Cases
This data app supports teams looking to centralize and simplify strategic monitoring. It’s especially useful for:
- Reviewing company health at a glance across departments
- Enabling real-time KPI reporting for board or investor updates
- Supporting strategic planning and quarterly reviews
- Tracking sustainability and people-related indicators alongside financials
- Giving business leaders autonomy in exploring trends without requiring raw data access
This data app reduces manual reporting effort and gives a clear, interactive view of critical metrics without spreadsheets or slide decks.
3. Revenue Growth Tracker
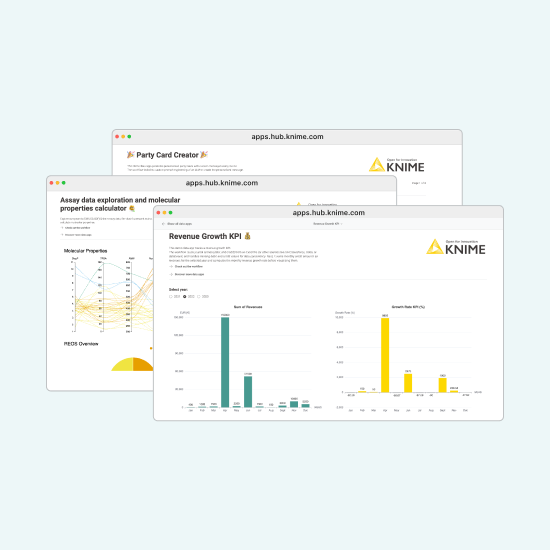
Revenue growth is one of the clearest indicators of a company’s trajectory. This KNIME data app helps you track and understand this KPI over time by calculating and visualizing percentage changes in revenue via a clean, interactive interface.
The workflow calculates revenue growth for a company using journal entries (debit and credit) sourced from an Excel file. You can also access data from systems like SAP, Salesforce, Odoo, or any database. It automatically handles missing values to ensure consistency, and then sums monthly credit amounts to determine revenues. Based on those, it computes and visualizes monthly revenue growth rates for the selected year.
You can explore revenue totals and trends year-over-year in a unified view, making it easier to spot momentum shifts and assess the business impact of recent strategies.
Want to see how it works? This blog post walks through the full workflow.
Relevant Use Cases
This data app is ideal for finance and strategy teams that need to monitor growth and understand its drivers. Use it to:
- Track performance across fiscal periods or product lines
- Identify early signs of slowing or accelerating momentum
- Compare revenue trends across geographies or business units
- Share consistent metrics with stakeholders, backed by raw entries
- Support strategic decisions with up-to-date financial insights
This data app gives you a reliable way to measure, monitor, and communicate revenue growth, without building reports from scratch each time.
4. Bank Reconciliation

Account reconciliation is essential for financial accuracy. It helps ensure that your company’s internal records align with external statements. This KNIME data app focuses on one of the most common types: bank reconciliation.
The workflow compares your internally recorded transactions (e.g., in a cash book) with external data such as bank statements. You can quickly identify and review unmatched entries, confirm that only valid transactions are posted to your general ledger, and uncover issues ranging from manual errors to potential fraud.
The process works by reading two data sources and checking for consistency. You can upload data from spreadsheets, databases, or finance platforms, and the workflow flags discrepancies in an interactive view. This blueprint can be reused across reporting cycles and adapted to various reconciliation scenarios. Want to see how it works? This blog post walks through the full workflow.
Relevant Use Cases
This data app is ideal for finance teams and accountants who need to validate transaction records efficiently. Use it to:
- Reconcile internal cash books with external bank statements
- Flag duplicate, missing, or inconsistent transactions
- Accelerate month-end close and financial reporting
- Provide a clear audit trail with traceable validations
- Standardize reconciliation across departments or subsidiaries
This data app replaces manual comparison work with an automated, interactive process, making reconciliation more scalable, transparent, and reliable.
5. Inventory Valuation
Tracking inventory levels over time is essential for controlling costs and improving operational efficiency. This KNIME data app helps you monitor inventory valuation at the end of each month and highlights when recorded values exceed a defined threshold.
The workflow processes inventory data and compares month-end values to a set threshold — a value that represents the acceptable upper limit of leftover stock. As long as inventory stays below this threshold, performance is considered on track. When values exceed the limit, the app flags deviations for further review.
You can explore valuation trends across selected towns in an interactive view, making it easier to track stock levels over time and identify where inventory may be drifting beyond acceptable levels. Read more in this blog post.
Relevant Use Cases
This data app is useful for supply chain and operations teams managing stock levels. Use it to:
- Track end-of-month inventory valuation across locations
- Compare actual stock levels against defined thresholds
- Identify excess inventory and reduce carrying costs
- Inform planning and procurement cycles
- Align operational reporting with supply chain KPIs
This data app provides a structured way to monitor inventory health and ensure stock levels remain within target ranges.
6. Stockout Monitoring
Maintaining product availability is critical for both customer satisfaction and operational efficiency. This KNIME data app helps businesses monitor and analyze stockout trends across item categories and warehouse locations, supporting better inventory decisions.
The workflow processes historical stockout data from the past two years across multiple warehouses in the US. You can select specific warehouse locations and item categories to view monthly stockout trends in an interactive visualization. The workflow then generates a prediction for current month stockouts based on historical patterns.
By turning stockout data into an exploratory interface, this data app gives operations and logistics teams early signals to prevent supply issues, before they impact customer experience or revenue, similar to how Audi used KNIME to forecast warehouse stock levels and proactively prevent supply chain bottlenecks.Relevant Use Cases
Stockout monitoring helps businesses anticipate shortages, reduce disruptions, and respond proactively. This data app is especially helpful for:
- Flagging potential supply issues before they affect order fulfillment
- Comparing performance across distribution centers
- Supporting inventory and demand planning meetings with data
- Justifying restocking decisions using real-time visibility
- Strengthening operational reporting across logistics or retail teams
This data app makes inventory trends easier to track and act on, supporting proactive operations and smoother customer experiences.
7. Tag Cloud Creation
This KNIME data app turns lyrics into an interactive game. It challenges you to guess the correct song based on a tag cloud generated from its lyrics. In each round, you’ll see a cloud of keywords and be asked to choose from three possible song titles.
You earn 3 points for a correct answer and lose 1 point for a wrong guess. After three rounds, the app displays a personalized results dashboard showing your total score and key stats. You can also view aggregated data across all players.
This data app offers a lightweight example of gamification and tag cloud visualization in KNIME, helping you explore how text data can be transformed into interactive visuals.
Relevant Use Cases
While designed for fun, this data app shows how KNIME workflows can be used for interactive, browser-based experiences with text data. Use it to:
- Demonstrate NLP and tag cloud generation from raw text
- Quickly see visual trends in text-based data such as support tickets, user interviews, or questionnaires.
- Explore examples of gamified interfaces in data apps
- Highlight how workflows can track user inputs and generate custom feedback
- Build internal demos or training tools with a more engaging format
This data app is a practical example of how you can turn workflow logic into an interactive user experience — no coding required.
8. AI Text Generation Interface
This KNIME data app helps you generate text by combining user input with large language model (LLM) capabilities. This specific data app creates a party invitation card by requesting details such as party type, theme, style, language, country, and occasion context — and uses that input to generate a poem or rap with a festive tone. However, you could also use this type of data app for more commercial purposes.
The generated message is displayed as a styled, shareable card with visual formatting and background elements. You can experiment with different combinations to create personalized messages tailored to specific celebrations, from birthdays to team wins.
Relevant Use Cases
This data app is useful for teams looking to create personalized messages or explore generative AI in a lightweight, hands-on format. Use it to:
- Generate engaging messages for internal communications or social posts
- Support HR or admin teams in creating informal, personalized acknowledgments
- Demonstrate how structured inputs can drive controlled generative outputs
- Build small-scale prototypes that combine LLMs with workflow logic
This data app highlights how workflows and generative AI can work together to deliver tailored content.
9. AI Sentiment Analysis Reviewer
Analyzing customer feedback at scale can be challenging when it’s stored in unstructured text. This KNIME data app uses generative AI to analyze customer reviews and extract sentiment, offering a structured view of product feedback. It processes review text using a large language model (LLM) to classify sentiment as positive, negative, or neutral. Optionally, it can also identify the specific aspect being discussed (e.g., battery, display, performance) and explain the reasoning behind the sentiment.
The results are presented in an interactive interface, where you can browse individual reviews, explore aggregated sentiment trends, and view summary statistics across different products or periods.
Relevant Use Cases
This data app is well-suited for product, marketing, or support teams that need to make sense of unstructured customer feedback. Use it to:
- Track sentiment across multiple product categories or models
- Identify recurring issues or standout features mentioned by users
- Compare customer perception before and after a product update
- Add structure to review data for reporting or trend analysis
- Support customer experience teams in identifying pain points quickly
This data app helps turn raw review text into structured insights making it easier to monitor customer feedback at scale.Turning real problems into interactive solutions
Each of these data apps started with a simple question: How can we make this task easier, faster, or more useful for others?
These examples show how KNIME data apps can help you build workflows that are not only automated, but also interactive and accessible — whether you're tracking stockouts, analyzing sentiment, planning events, or even creating personalized messages. data apps turn a workflow into something teams can explore, validate, and reuse, without writing code.
You can try all of these data app examples directly in your browser without any setup.