
“Life is like riding a bicycle. To keep your balance you must keep moving.” Despite its misuse under tons of Instagram pictures, this beautiful quote from Albert Einstein is still relevant today. In addition to physical activity, sustainable and shared mobility have become our weapon against daily traffic and pollution: Terms like shared transport, bike sharing, car sharing are now part of our language, and more people than ever use these services on a daily basis. How often are these services used? How is their usage affected by other factors, such as the quality of the service or the weather conditions?
To answer these questions we need to collect data from a wide range of - typically disjointed - data sources, we also need a bit of imagination...and some patience! As an example, today we will mix together bike sharing data provided by Google BigQuery with weather data stored on Databricks, in order to see if and how weather conditions affect how the bikes are used.
Topic. Multivariate visualization of bike-sharing data vs. weather data
Challenge. Investigate how weather influences usage of bike sharing
Access mode. KNIME Google BigQuery Integration and KNIME Databricks Integration
For those who don’t know these two platforms, BigQuery is the Google response to the Big Data challenge. It is part of the Google Cloud Console and offers the ability to store and query large datasets using SQL-like syntax. Databricks is a cloud-based big data tool. Developed by the Apache Spark group, it offers a wide variety of operations - such as building data pipelines and scaling data science to production - tuning the functionalities offered by the Spark open source software.
Both these platforms are supported by KNIME Analytics platform, from version 4.1 upwards. You can download and install the KNIME BigQuery and the KNIME Databricks Integration from the KNIME Hub.
The Experiment - Austin Bike Share Trips - Weather Data - BigQuery - Databricks
The first dataset, hosted on Google Big Query public data, is the Austin Bike Share Trips. It contains more than 600k bike trips during 2013-2019. For every ride it reports the timestamp, the duration, the station of departure and arrival, plus information about the subscriber. The second, smaller, dataset is the Austin Weather dataset, which is hosted on a Databricks platform. It contains daily weather information for the city of Austin, such as temperature, dew point, humidity, wind, precipitation, as well as adverse weather events.
Google BigQuery
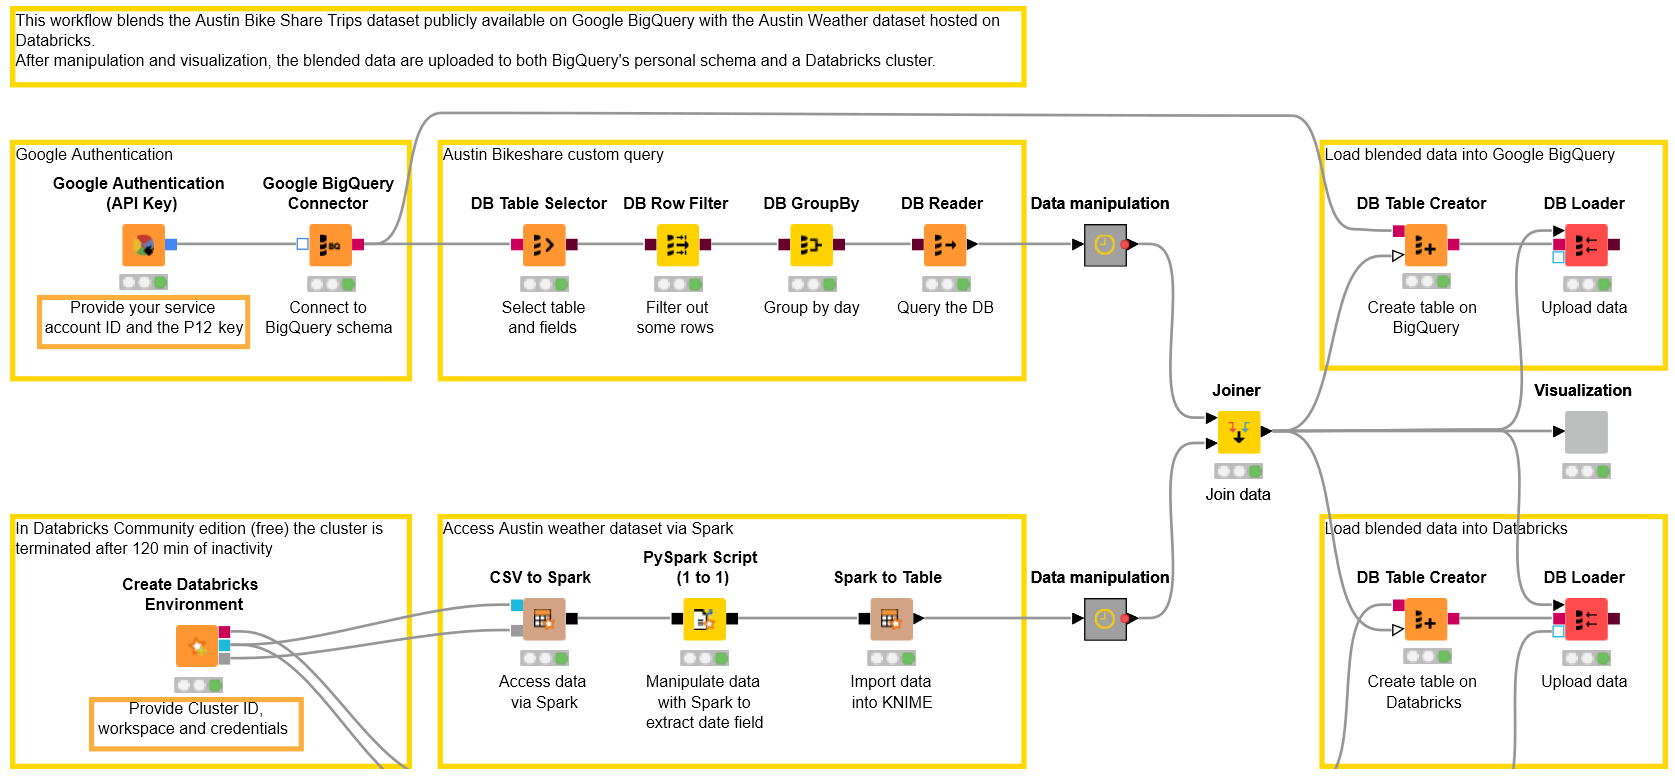
In the upper part of our KNIME workflow (which you can download from the KNIME Hub here) we access the Austin Bike Share Trips dataset hosted on the Google BigQuery platform as a public dataset. In order to execute this part of the workflow you need:
- An active project on Google Cloud Platform
- Credentials and an API key to access your project
- Google BigQuery JDBC driver installed on your KNIME Analytics Platform
- KNIME BigQuery extension and KNIME Google Cloud Storage Connection extension, both available on the KNIME Hub
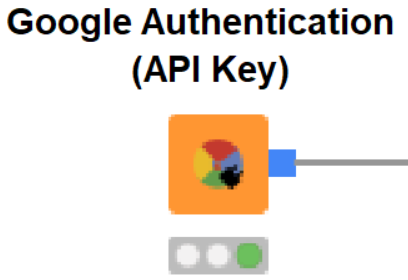
Authentication
With the project credentials we are going to configure the Google Authentication (API Key) node. You will be required to provide your service account email and the P12 authentication file. You can find both on your Google Cloud Platform Project under: APIs & Services -> Credentials
If you are starting from scratch with Google Cloud Platform, we recommend this step-by-step guide that will also show how to create a new project, generate new credentials and install the driver on KNIME Analytics Platform.
Connecting to Google BigQuery
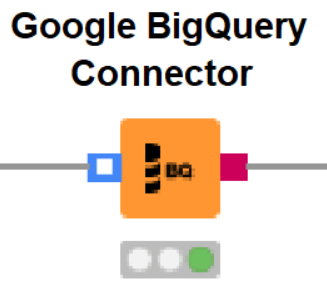
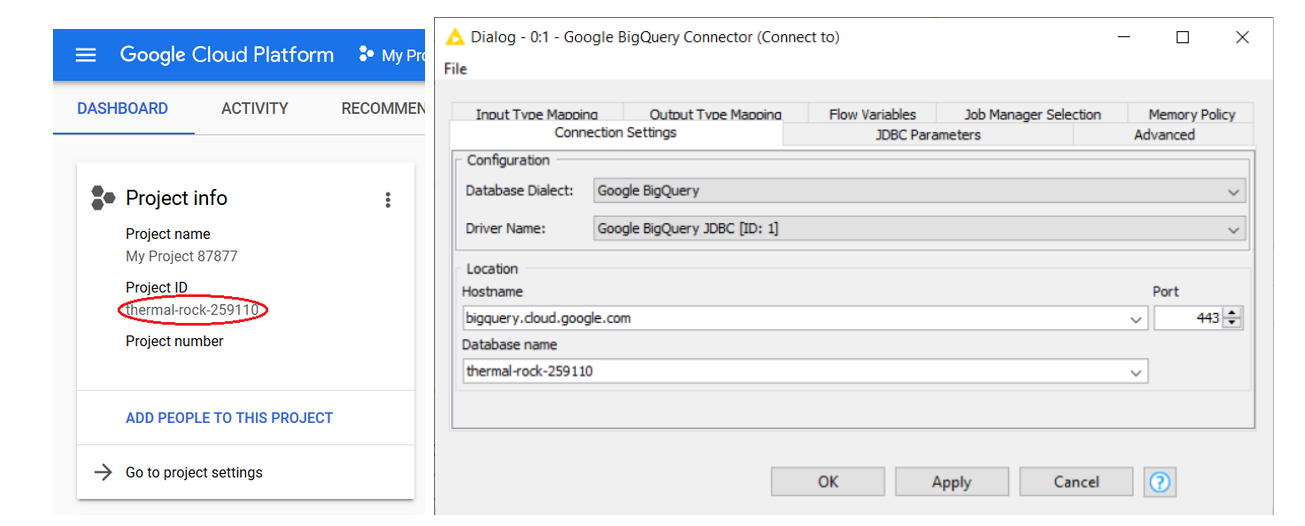
After authentication, the Google BigQuery Connector node provides access to the public BigQuery platform, using the BigQuery JDBC Driver, the hostname (which is bigquery.cloud.google.com) and the Database name, that in this case is your Project ID. You can find the Project ID on your project’s dashboard on Google Cloud Platform (Figure 28.1).
Query
At this point, Google BigQuery has become your remote database and you can use all the DB nodes provided by KNIME Analytics Platform in the DB -> Query folder in the Node Repository panel. DB Query nodes are useful to build and execute powerful queries on the data before they are imported into your workflow. This is particularly useful when, as in this case, we are only interested in downloading a portion of the data and not the entire - huge - dataset.
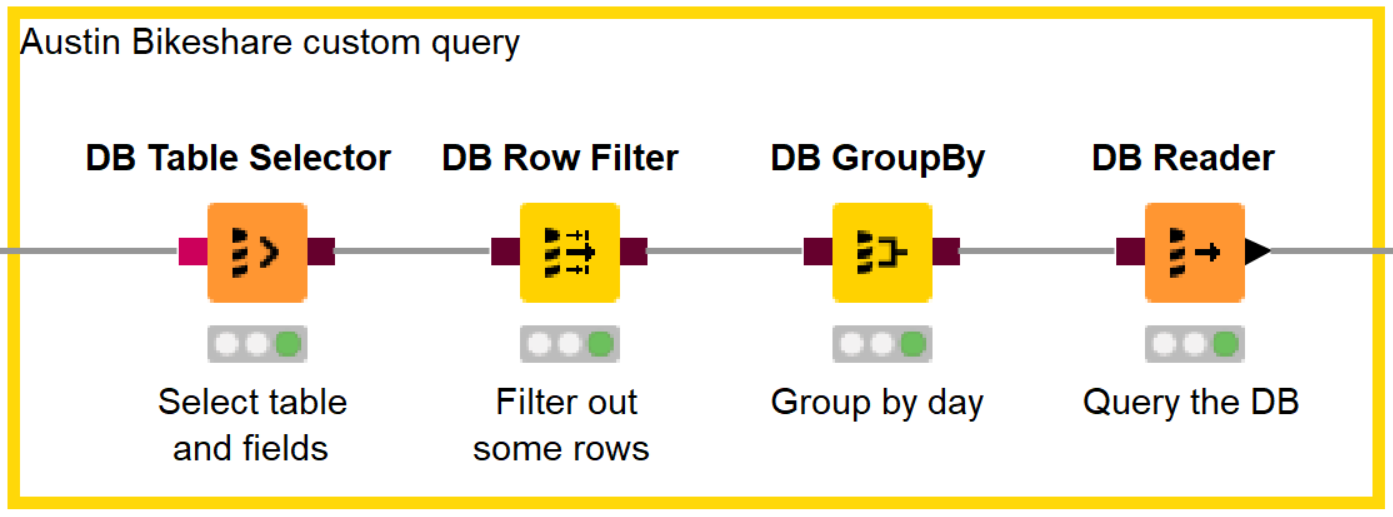
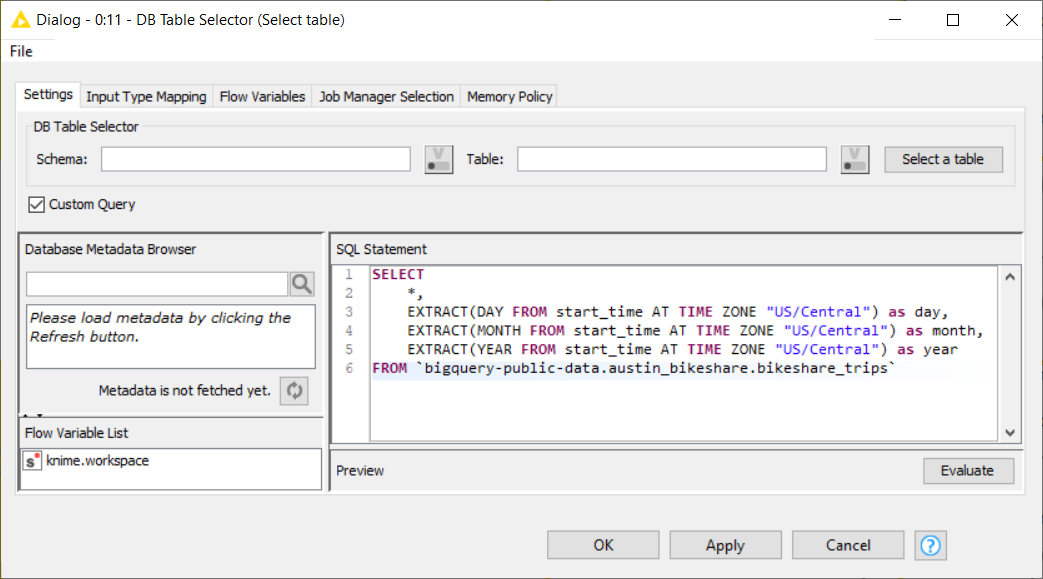
Let’s add a DB Table Selector node, and open the configuration window to write a custom query like the one in Figure 28.3. It will extract some features such as year, month and year fields that we are using further down in the workflow.
When typing SQL statements directly, make sure to use the specific quotation marks (``) required by BigQuery.
When typing SQL statements directly, make sure to use the specific quotation marks (``) required by BigQuery.
We can refine our SQL statement by using a few additional GUI-driven DB nodes. In particular, we added a DB Row Filter to extract only the days in [2013, 2017] year range and a DB GroupBy node to produce the trip count for each day.
Tip: If you feel nostalgic about SQL queries, you can open the result window of every DB node (right click on the node -> last entry) and navigate to the “DB Query” tab to check how the SQL statement looks like so far.
Finally, we append the DB Reader node to import the data locally into the KNIME workflow.
Databricks
The bottom part of the workflow handles the data stored on Databricks. What you need in this section is:
- A running Databricks cluster storing the Austin Weather You can download the csv file from Kaggle and upload it on a Databricks cluster.
- Credentials and cluster ID in order to connect to the Databricks instance
- The official JDBC driver provided by Databricks and installed on KNIME Analytics Platform (recommended)
- KNIME Databricks integration and KNIME Extension for Apache Spark available on the KNIME Hub
Please note that despite the fact that Databricks is a paid service, this part of the experiment is implemented using the Databricks Community Edition, which is free and offers all the functionalities we need for our challenge.
Note. KNIME Analytics Platform provides an open source Apache Hive driver that you can also use to connect to Databricks. However, it is strongly recommended to use the official JDBC driver provided by Databricks.
Connecting to Databricks
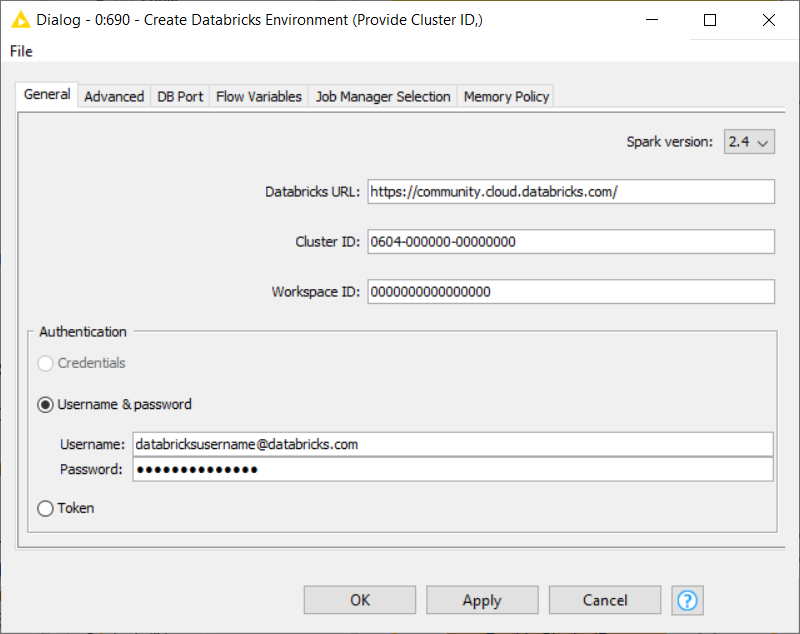
First of all, let’s connect to Databricks adding the Create Databricks Environment node to the workflow. In the configuration window we are asked to provide a number of parameters:
- Databricks URL
- Cluster ID
- Workspace ID
- Authentication
Provide these parameters in the configuration window of the Create Databricks Environment node.
Executing this node, connects KNIME Analytics Platform to the Databricks cluster where the data are stored. The node has three ports, each of them providing a different access to the data:
- Red port: the JDBC connection to connect to KNIME database nodes.
- Blue port: the DBFS connection to connect to the remote file handling nodes as well as the Spark nodes.
- Gray port: Spark context to connect to all Spark nodes. Please check in the Advanced tab of the configuration window that the option “Create Spark context” is enabled in order to activate this port.
In this example we are going to use some basic Spark operations to retrieve the data. Please refer to the KNIME on DataBricks guide, to explore further Databricks operations in KNIME Analytics Platform, plus more detailed instructions on how to configure Databricks for the first time.
Query
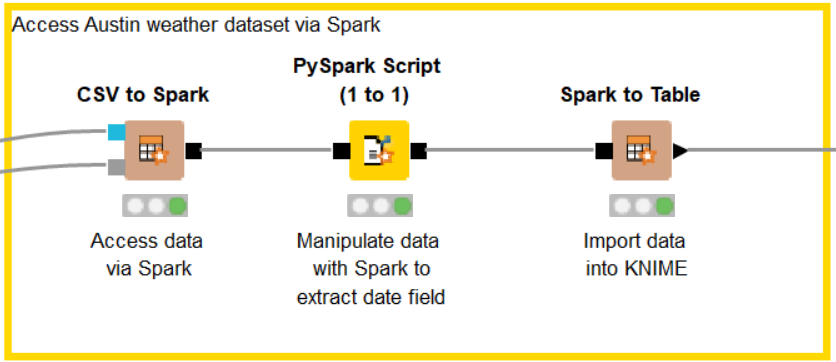
Since we have stored the Austin Weather dataset on the Databricks cluster as a CSV file, let’s add a CSV to Spark node to access it. Double click the node to open the configuration window. Click “Browse” and select the austin_weather.csv from the cluster.
At this point we are ready to use some of the functionalities offered by the Spark nodes. You can find them all in the Node Repository panel under Tools & Services -> Apache Spark, after installing the KNIME Extension for Apache Spark.
Here, we want to extract information regarding the date field. We are going to split the date string into three separate columns: year, month and day. To do so we use the PySpark Script (1 to 1) node and write our simple script directly into the configuration window. After execution, the output port contains the processed Spark data. Finally, a Spark to Table node imports the results into our KNIME workflow.
The Results
In the last steps we extracted and prepared the data to be blended.
Let’s add a Joiner node, select the previously extracted year, month and day fields as the joining columns and let KNIME Analytics Platform do its tricks. After execution, right-click the Joiner node, select Joined table from the menu and have a look at the data, which are now blended.
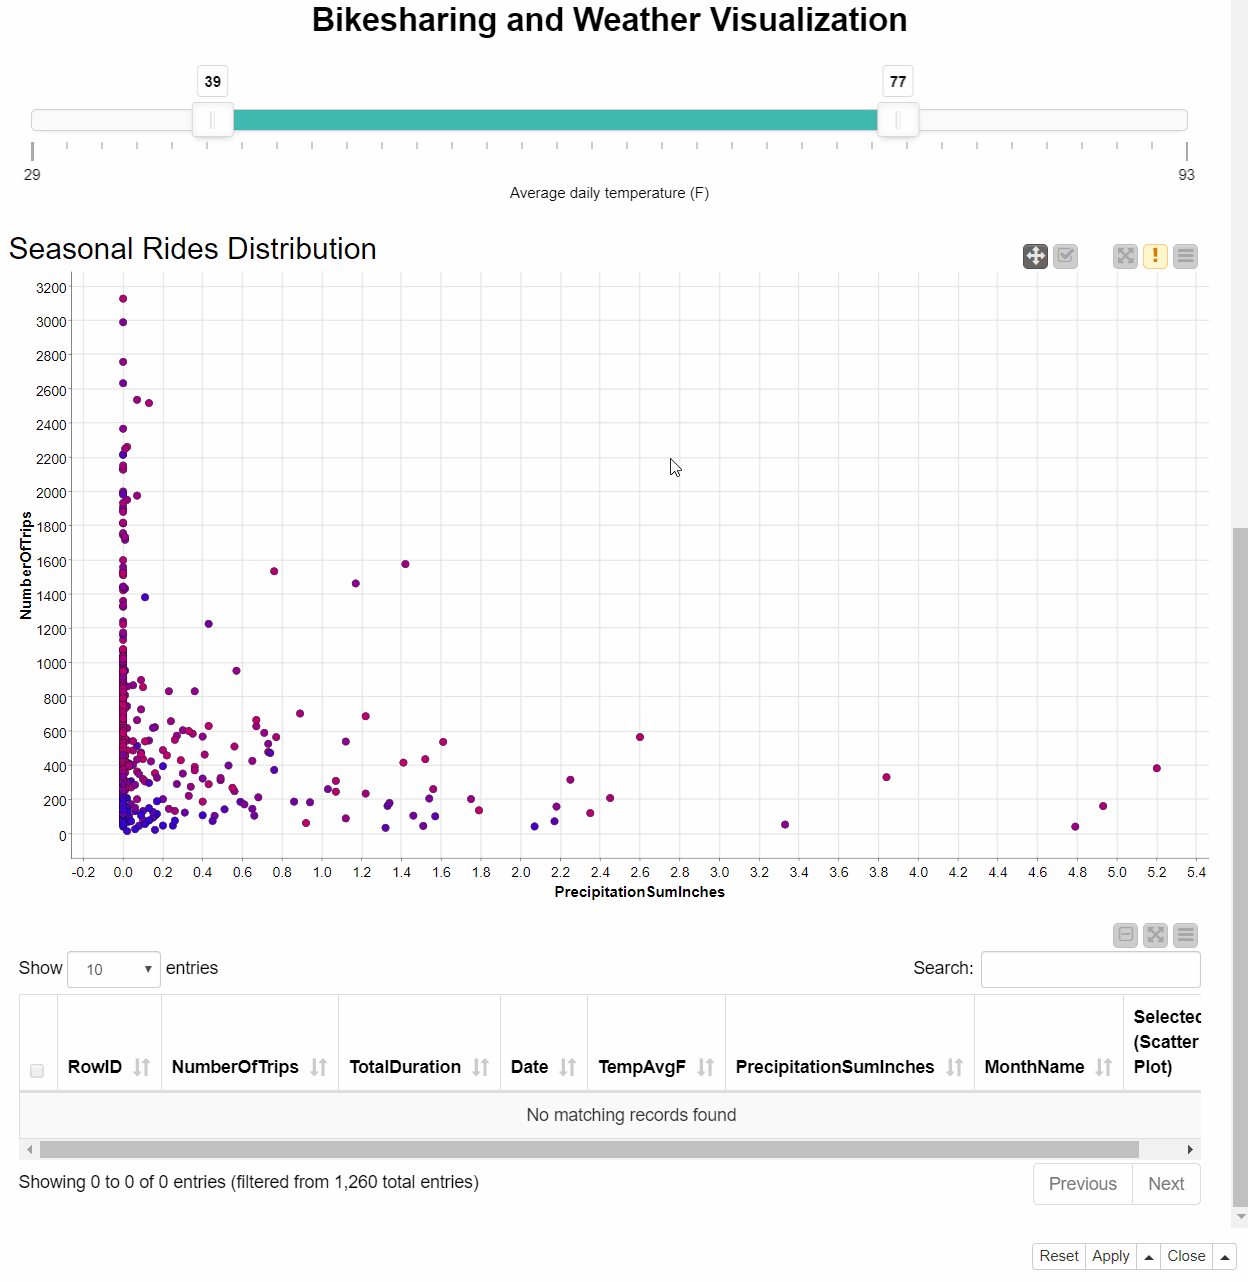
Following the Joiner node in the workflow, the Visualization component builds a dashboard, which includes different charts, such as bar chart, histogram, sunburst chart and the table view and the scatter plot shown in Figure 6. Each dot in the Scatter plot encodes the data of one day. The color of the dot tells us about the average daily temperature: the colder days are blue, while the hotter are red.
The dashboard also offers some level of interactivity to dig into the exploration, such as an interactive slider to remove days according to the temperature level or a table showing only selected dots from the scatter plot. As shown in Figure 28.6, we can also change the configuration of the chart directly from the dashboard, choosing different feature combinations clicking the icon in the upper right corner.
For example, we can get information about the relation between bike rides and rain level, choosing the corresponding features - PrecipitationSumInches for the X axis and NumberOfTrips for the Y. From the resulting scatter plot we can see that during the days with the higher numbers of rides there was hardly any rain or no rain at all: the bad weather conditions might have led people to choose different means of transportation.
Let’s now click the icon again and select Date column for the X axis. The scatter plot updates revealing a seasonal trend of the bike rides. We can explore the details of the data points with the higher number of bike rides by selecting them from the scatter plot and having a look at the Table view. It seems as if the peaks we can see mostly take place during March and October - when biking is probably more pleasant than during rain or at very high or very low temperatures.
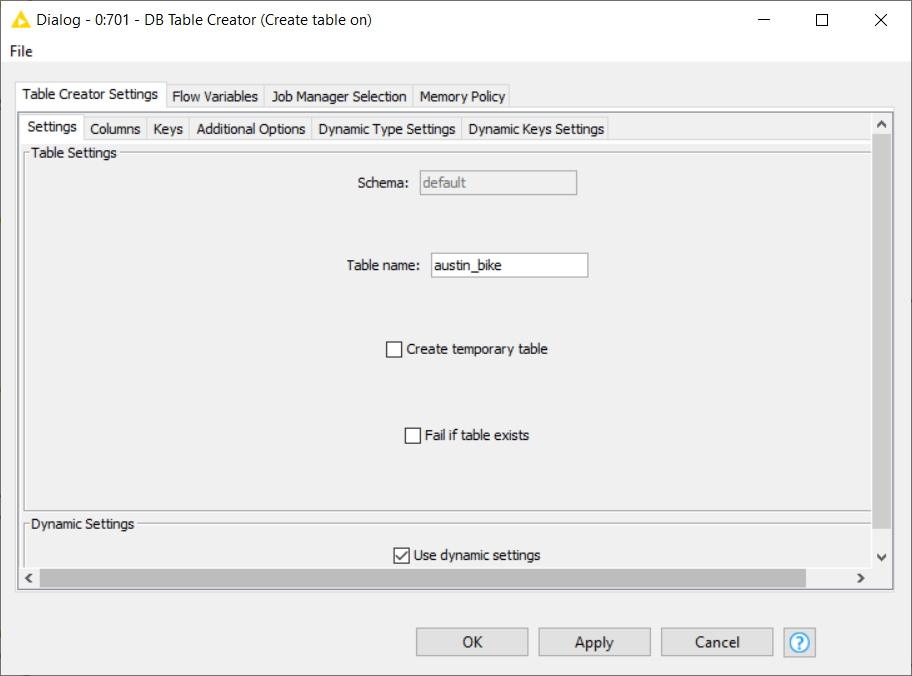
At this point, we might want to upload the blended data back to the platforms, for future uses. In order to do so, let’s add a DB Table Creator to the workflow. We can connect it either to the Google BigQuery Connector or to the DB connection (Red port) of the Create Databricks Environment node.
Note that additional steps such as the creation of a new schema in your personal BigQuery project might be necessary.
- Configure the DB Table Creator node selecting the desired schema and giving a name to the table, then append and configure a DB Loader node to upload the data to the new remote table.
- Note that additional steps such as the creation of a new schema in your personal BigQuery project might be necessary.
- Configure the DB Table Creator node by selecting the desired schema and giving a name to the table. Next, append and configure a DB Loader node to upload the data to the new remote table.
Note. When using BigQuery remember to delete all the space characters from the column names. They would be automatically renamed during table creation and this will create conflict for the next step, since column names will no longer match.
Wrapping up
In this example we have learned how to access and blend two popular cloud services - Google BigQuery and Databricks - using the extensions available in KNIME Analytics Platform. Together with these datasets, we have explored the world of bikesharing and how its usage is intrinsically related to weather conditions.
The full workflow for this experiment is shown in figure 28.8 and is available for download from the KNIME Hub under Google BigQuery meets Databricks.
Download the workflow to blend data from BigQuery and Databricks from the KNIME here.
Author: Emilio Silvestri (KNIME)
Further Resources
The Will They Blend KNIME Blog Series
In this blog series we experiment with the most interesting blends of data and tools. Whether it’s mixing traditional sources with modern data lakes, open-source devops on the cloud with protected internal legacy tools, SQL with noSQL, web-wisdom-of-the-crowd with in-house handwritten notes, or IoT sensor data with idle chatting, we’re curious to find out: will they blend? Want to find out what happens when IBM Watson meets Google News, Hadoop Hive meets Excel, R meets Python, or MS Word meets MongoDB?
Download your own copy of the Will They Blend? The Blog Post Collection - Third Edition from KNIME Press.