As first published in The New Stack.
There is a big push for automation in data science today. Given how complex programming data science applications can be, that is no surprise. It takes years to truly master scripting or programming languages for data analysis — and that’s ignoring that one needs to build actual data science expertise as well. However, code-free solutions can make the nuts and bolts of data science a lot more accessible. This means that the valuable time of data science teams can be spent on actually doing data science so that organizations don’t have to rely on an external, preconfigured, and intransparent data science automation mass product.
This is great news in many respects. Visual, code-free environments open up the world and power of data analytics to more people, and their organizations benefit from a higher level of insight. Visual environments intuitively explain which steps have been performed in what configuration. Whether this amounts to a gut-check for programmers or helps a relative novice gain a better understanding, it is positive. And, in the case of many startups in which teams are stretched quite thin, code-free solutions can be huge time savers.
But, there is a flip side. Directly writing code is and always will be the most versatile way to create new analyses tailored to your organization’s specific needs. Data scientists often want to have access to the latest developments, which calls for a more hands-on approach. To get the most value out of data, experts need to be able to quickly try out a new routine, either written by themselves or by their colleagues.
The beautiful thing about modern data analytics is that, despite what you may think, it doesn’t have to be either/or. You can have the best of both code-free and custom-coded analytics, gaining ease of use and versatility at once. Here’s how.
Choose an open platform
When trying to determine how to bring meaningful data analytics into your organization, there is a lot to consider for sure — and right in the mix should be a visual open source solution. The big draw to open source platforms is that they don’t lock you into any one analytical language, and today’s open source options integrate multiple analytical languages, such as R and Python, while also incorporating visual design of SQL code, for example. It is also easy to grow from what’s available right now to incorporate the innovations of the future.
Additionally, a truly open platform allows you to choose what you and, more importantly, your data scientists are comfortable using. They can collaboratively utilize what they know best without having to learn the intricacies of every other coding paradigm implemented across your organization in order to provide value. This enables a range of possibilities that offers a great deal of customization.
Open source platforms are ideal for bridging the gap between commercial offerings and homegrown solutions to let users decide what, why, and how much they want to code.
How it can work
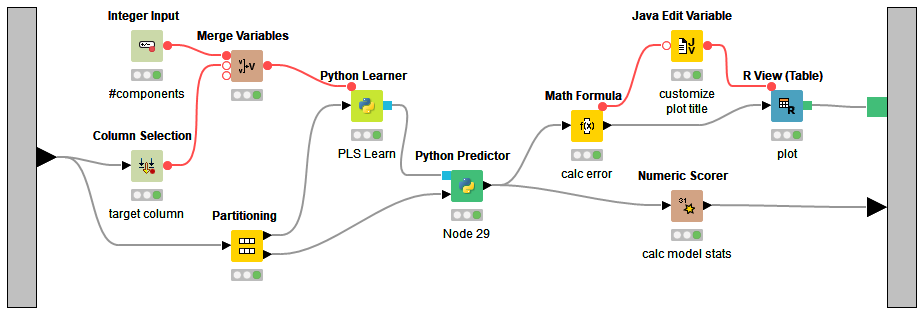
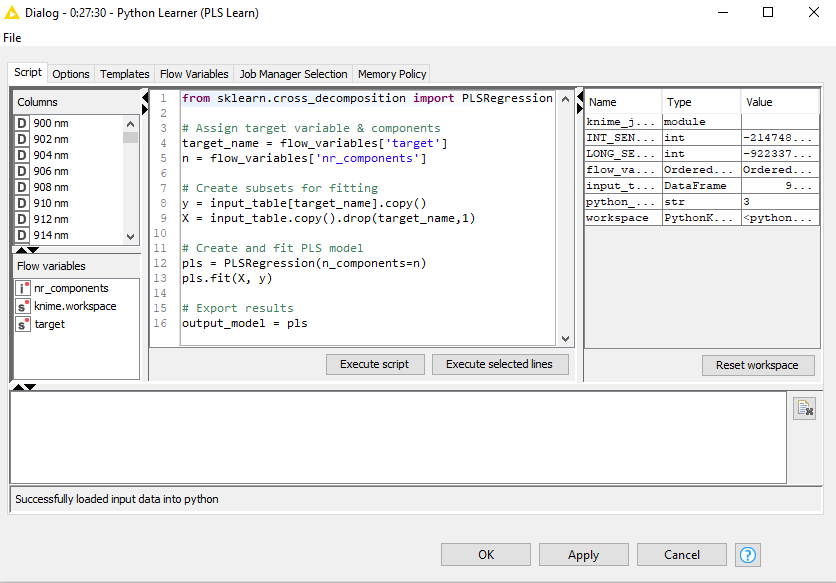
You likely are wondering what an open source data analytics platform could look like in practice. Let’s start with R and Python because they are the most important scripting languages for data analysis. With the right open source platform, one of your data scientists could design a workflow in which R is used to create a graphic and Python is used for the model building, just to pick an example. Those two languages work together in that workflow, which a different user can then pick up and re-use, perhaps never even looking at the underlying code pieces. Models and workflows can grow increasingly complex, but the principle is the same.


Data loading and integration is another area where an open source platform can be useful, and this is the part people don’t really talk about. Experts can write a few lines of SQL faster than putting together modules graphically, but not everyone is sufficiently fluent in SQL to do this. Those that aren’t should still be given the ability to mix and match their data. Visual open source platforms allow them access to the majority of the functionality available via SQL (while remembering the many little nuances of it for different databases).
Another example is big data. The right open source platform will enable workflows that model and control ETL operations natively in your big data environment. They can do this by using a connector to Hadoop, Spark and NoSQL databases, and it works just like running operations in your local MySQL database — only things are executed on your cluster (or in the cloud). And this is just the beginning, providing a mere flavor of how such integration can work with other distributed or cloud environments.
One last but very important example. Instead of building yet another visualization library or tightly coupling pre-existing ones, it’s possible for open source platforms to provide JavaScript nodes that allow users to quickly build new visualizations and then expose them to the user. Complex network representations can be generated using well-known libraries, and users can then display interactive visualizations and ultimately deploy web-based interactive workflow touch points. This is the really good stuff because it enables true guided analytics, meaning human feedback and guidance can be applied whenever needed, even while analysis is being conducted. It’s where interactive exchanges between data scientists, business analysts, and the machines doing the work in the middle function together to yield the best, most specific, relevant data analysis for your business.
Data analytics now and in the future
Data analytics will play an increasingly vital role in businesses moving forward. Speed, power, flexibility, and ease of use are demanded of any solution — and these requirements will grow even more complex as data proliferates at an incredible rate. The decisions you make today will influence the types of analysis and information you can glean tomorrow.
As you move forward, I would advise you to consider the data needs of your organization. Do you need very specific types of data analysis? Do you want to be in control of how that information is analyzed? Consider your team. Do you have an army of data scientists and expert coders, or do you have a shoestring crew — or maybe a healthy mix? As you weigh all of your needs, assets, and potential deficits, consider how a visual open source platform can help you and provide exactly what is required, both now and for the future.
