Does KNIME Analytics Platform provide the necessary functionality for data analytics in Lean Six Sigma projects? At the Accademia Italiana del Sei Sigma (AISS), we took the challenge to find out.
We decided to introduce KNIME Analytics Platform in our Lean Six Sigma courses and projects. The goal was to offer a more complete and up to date educational program to all our industry 4.0 customers. It took one year to assemble the team with the right competencies, to migrate the material from the many existing courses, and to create material for new courses.
I'm Alessandro Polidoro, Certified Black Belt Lean Six Sigma at the Italian Academy of Six Sigma, and this article tells the story of this migration project and how we handled it.
The Players: AISS, Lean Six Sigma, KNIME, and Industry 4.0
Before I start telling the story of this migration, let’s introduce the players: Accademia Italiana del Sei Sigma (AISS), Lean Six Sigma, KNIME Analytics Platform, and Industry 4.0
Accademia Italiana del Sei Sigma (AISS)
![]() Accademia Italiana del Sei Sigma (AISS) is a consulting and educational institution, with the aim of spreading knowledge about the Lean Six Sigma methodology. Founded in 2001, it is currently based in Rome, Italy, and has served more than 200 Lean Six Sigma certifications within the manufacturing industry. Our mission is to provide educational and consulting services for companies to implement the Lean Six Sigma approach in their production line.
Accademia Italiana del Sei Sigma (AISS) is a consulting and educational institution, with the aim of spreading knowledge about the Lean Six Sigma methodology. Founded in 2001, it is currently based in Rome, Italy, and has served more than 200 Lean Six Sigma certifications within the manufacturing industry. Our mission is to provide educational and consulting services for companies to implement the Lean Six Sigma approach in their production line.
Every year we hold a national conference, to learn new methodologies and to celebrate successful projects.
At last year’s conference, in 2024, we set a new goal: to modernize all Lean Six Sigma courses by introducing a more versatile and AI-friendly data analytics tool, KNIME Analytics Platform. And here we are.
Lean Six Sigma
Lean Six Sigma is a management methodology that combines the principles of the Lean strategy and of the Six Sigma approach, to improve organizational performance by reducing waste, variability, and defects.
The “Kaizen” (or lean manufacturing) concept was first introduced in the Toyota Production System (TPS). The “Kaizen” (Japanese: 改善, "improvement") concept focuses on eliminating waste and improving the process flow, advocates for a continuous improvement of all company’s functions, and involves all employees from the CEO to the assembly line workers. Kaizen mainly applies to manufacturing production lines; however, it can also apply to processes, such as purchasing and logistics, therefore bordering into supply chains.
The Six Sigma approach was developed at the Motorola company in the United States in 1986, to compete with the kaizen business model in Japan. The Six Sigma approach aims at reducing variation and defects, by introducing thorough data analytics processes within the production lines.
Since the early 2000s, a combination of the two approaches, called Lean Six Sigma, has dominated the manufacturing industry, especially after the introduction of the Internet of Things (IoT).
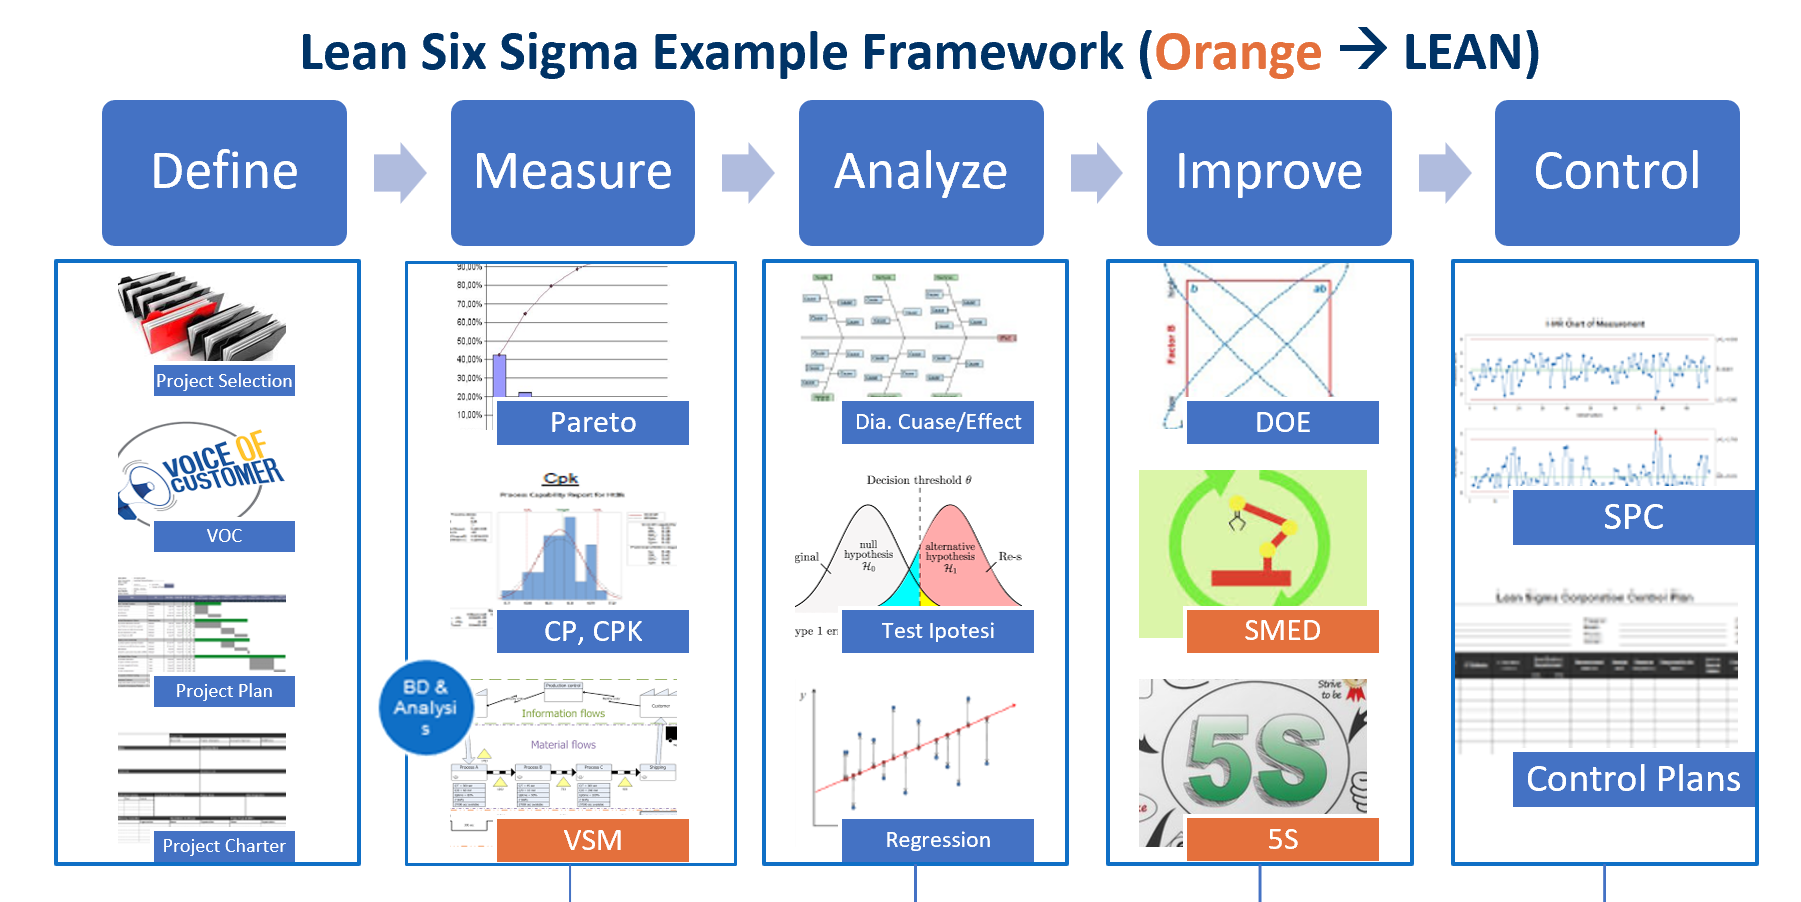
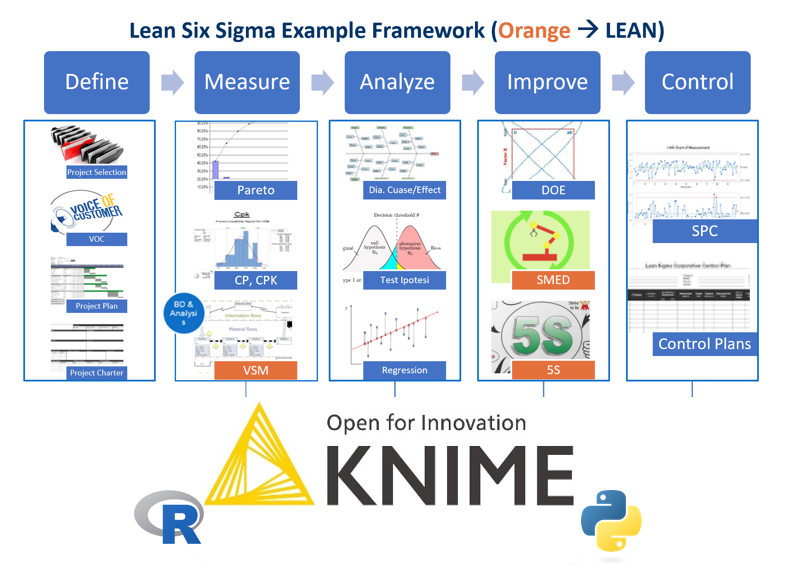
Lean Six Sigma proposes a framework, called DMAIC, of five basic steps around the production process:
- Define. Identify and understand all steps in the production process.
- Measure. Identify the descriptive variables at each step and quantify them.
- Analyze. Investigate, display, and predict the process flow.
- Improve. Remove non-value-added steps and waste, reduce variance.
- Control. Undertake improvement activity in a systematic way.
What is Industry 4.0
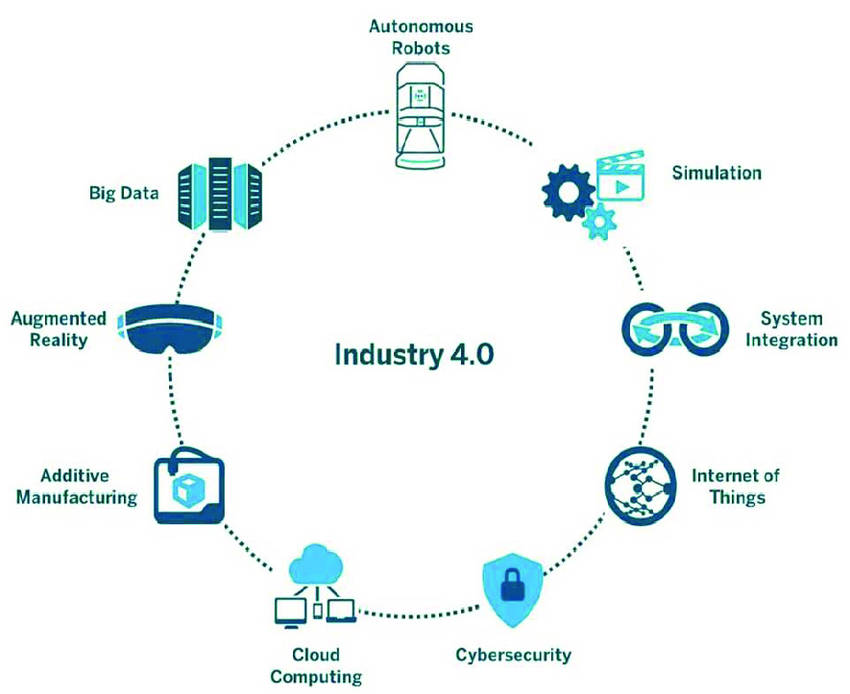
Industry 4.0, also known as the Fourth Industrial Revolution, refers to the ongoing transformation of manufacturing and other industries through the adoption of advanced technologies, like the Internet of Things, artificial intelligence, and cloud computing. This digital revolution aims to improve productivity, efficiency, and flexibility by integrating operations and information technologies.
The technological transformation operated by Industry 4.0 requires new tools that can handle various data sources, like sensors, big data, ERP, cloud resources, and various databases; allow for real-time data-driven decisions to comply with modern competitiveness in SMEs or large companies; and provide access to statistics, machine learning, and artificial intelligence.
KNIME Analytics Platform
KNIME Analytics Platform is a free open-source tool for data analytics.
- It is intuitive to use, thanks to its low code graphical user interface. This friendly-usage framework makes it perfect for quick adoption by non-data-scientists.
- It offers a large coverage of data techniques and algorithms, including connectors to a variety of data sources, statistics, machine learning algorithms, visualization techniques, and other data operations.
- Due to its open-source nature, it can rely on a rich and active community. This is a very helpful feature, for fast learning and quick technical help.
- It is free to use. While this one is not a necessary condition for data analytics, nevertheless it is an attractive one.
- Among the many integrations, KNIME Analytics Platform also integrates with Python and R. This completes the coverage picture, since it expands the native functions of KNIME Analytics Platform with Python and R statistical libraries.
How we migrated our courses to KNIME for Lean Six Sigma
During this past year, we assembled a competent team, and we proceeded with the migration of our courses – the yellow belt course first, the green belt later and finally the black belt course – into KNIME Analytics Platform.
We built:
- Workflows for data analysis
- Data apps for data exploration and project tracking
- Python and R scripts to integrate into KNIME workflows for plots, charts, and special analysis not yet available in KNIME Analytics Platform.
While we have not yet finished the migration of all functions and scripts into components and workflows, the journey is ongoing and full of potential. KNIME Analytics Platform is proving to be a solid foundation to replicate – and in some cases extend – the capabilities traditionally found in other softwares. We are aware that there is still significant work ahead, but the progress made so far is encouraging.
You can find some of the components we have created on the AISS space on the KNIME Community Hub, free to download and use.
Here are explanations of the workflows and data apps for DMAIC: DEFINE, MEASURE, ANALYZE, IMPROVE, and CONTROL.
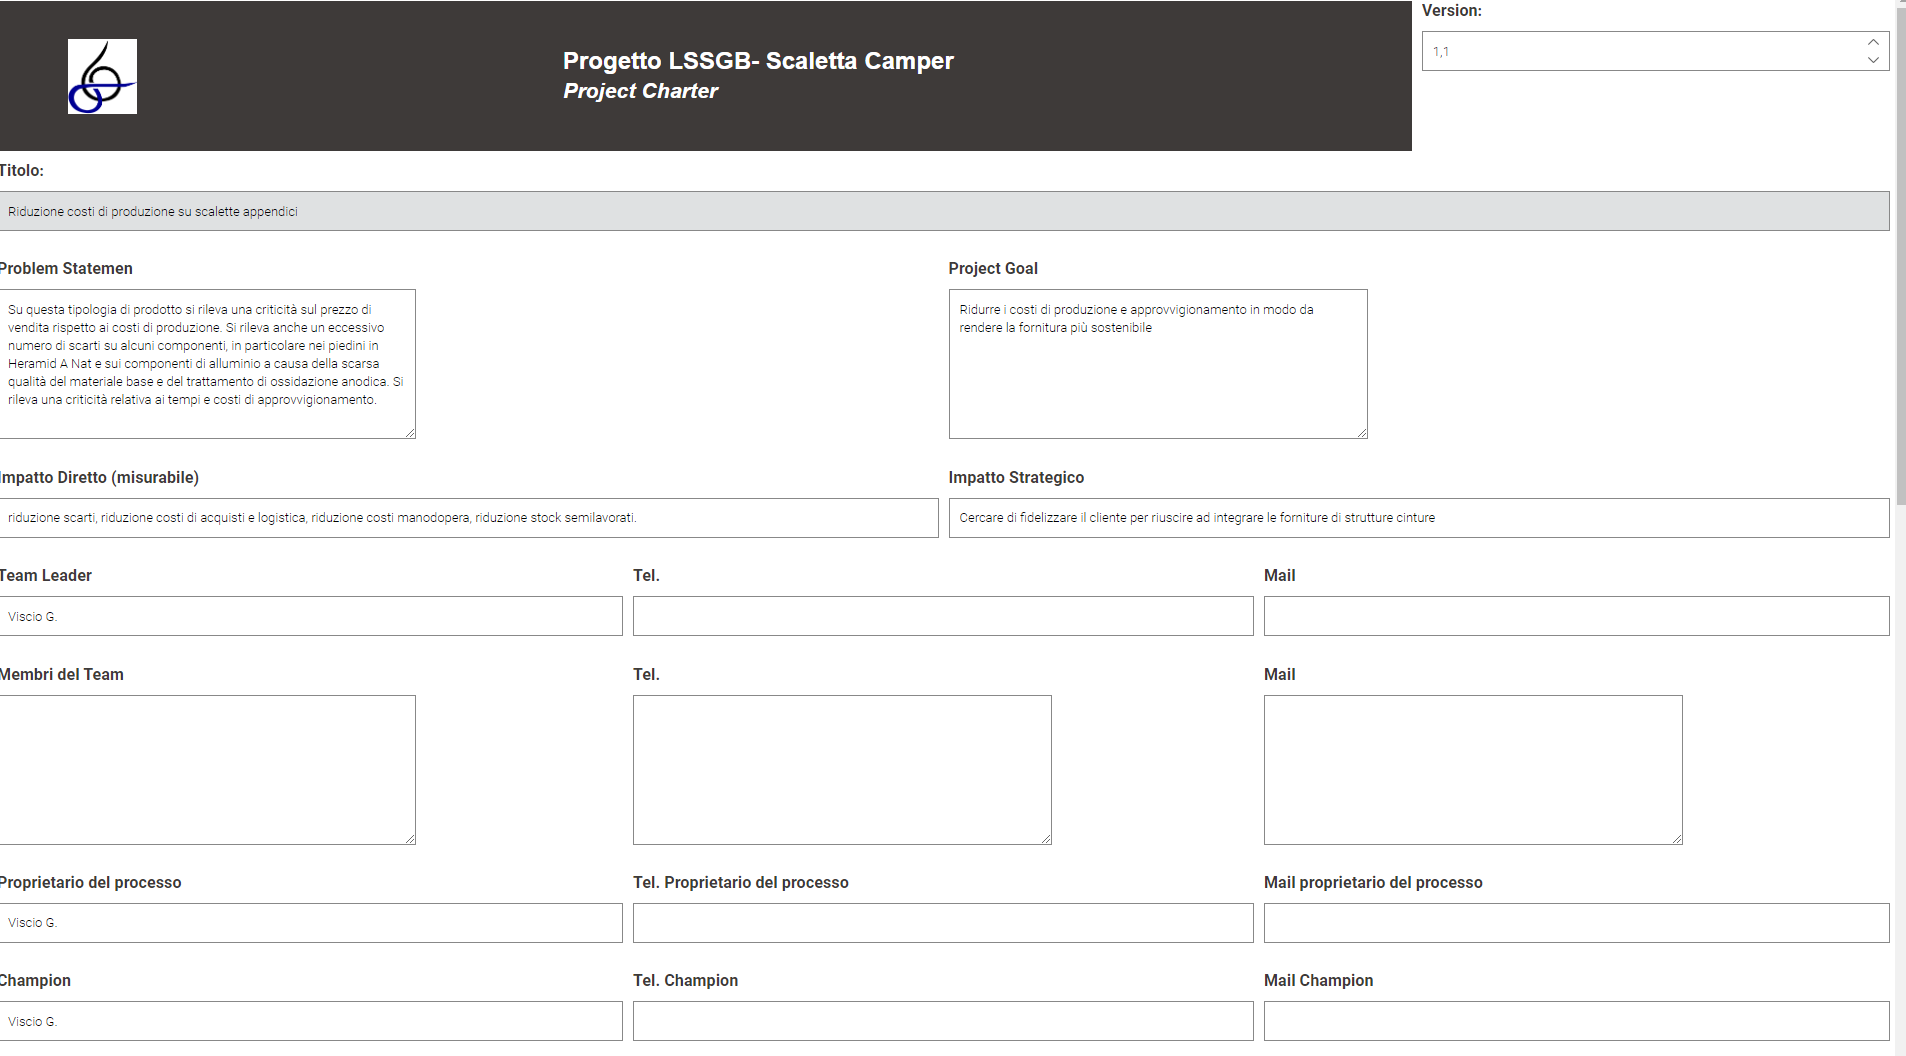
1. DEFINE
In this phase, we need a project tracker tool. We use this at the beginning to collect the project specs and later on to track the project progress. For that, we have implemented a “Project Charter” data app, that through Widget nodes allows us to collect the project specs, and through visualization charts allows us to track the project progress.
2. MEASURE
During this phase, we collect the data, check the data quality, (e.g. missing values, outliers, range, normality, …), clean the data, and finally transform them to better extract the insights.
Connecting to several different data sources is the first step of this phase. Thus, here, we made ample usage of the various connector nodes available in KNIME Analytics Platform (see the KNIME Connectors cheat sheet).
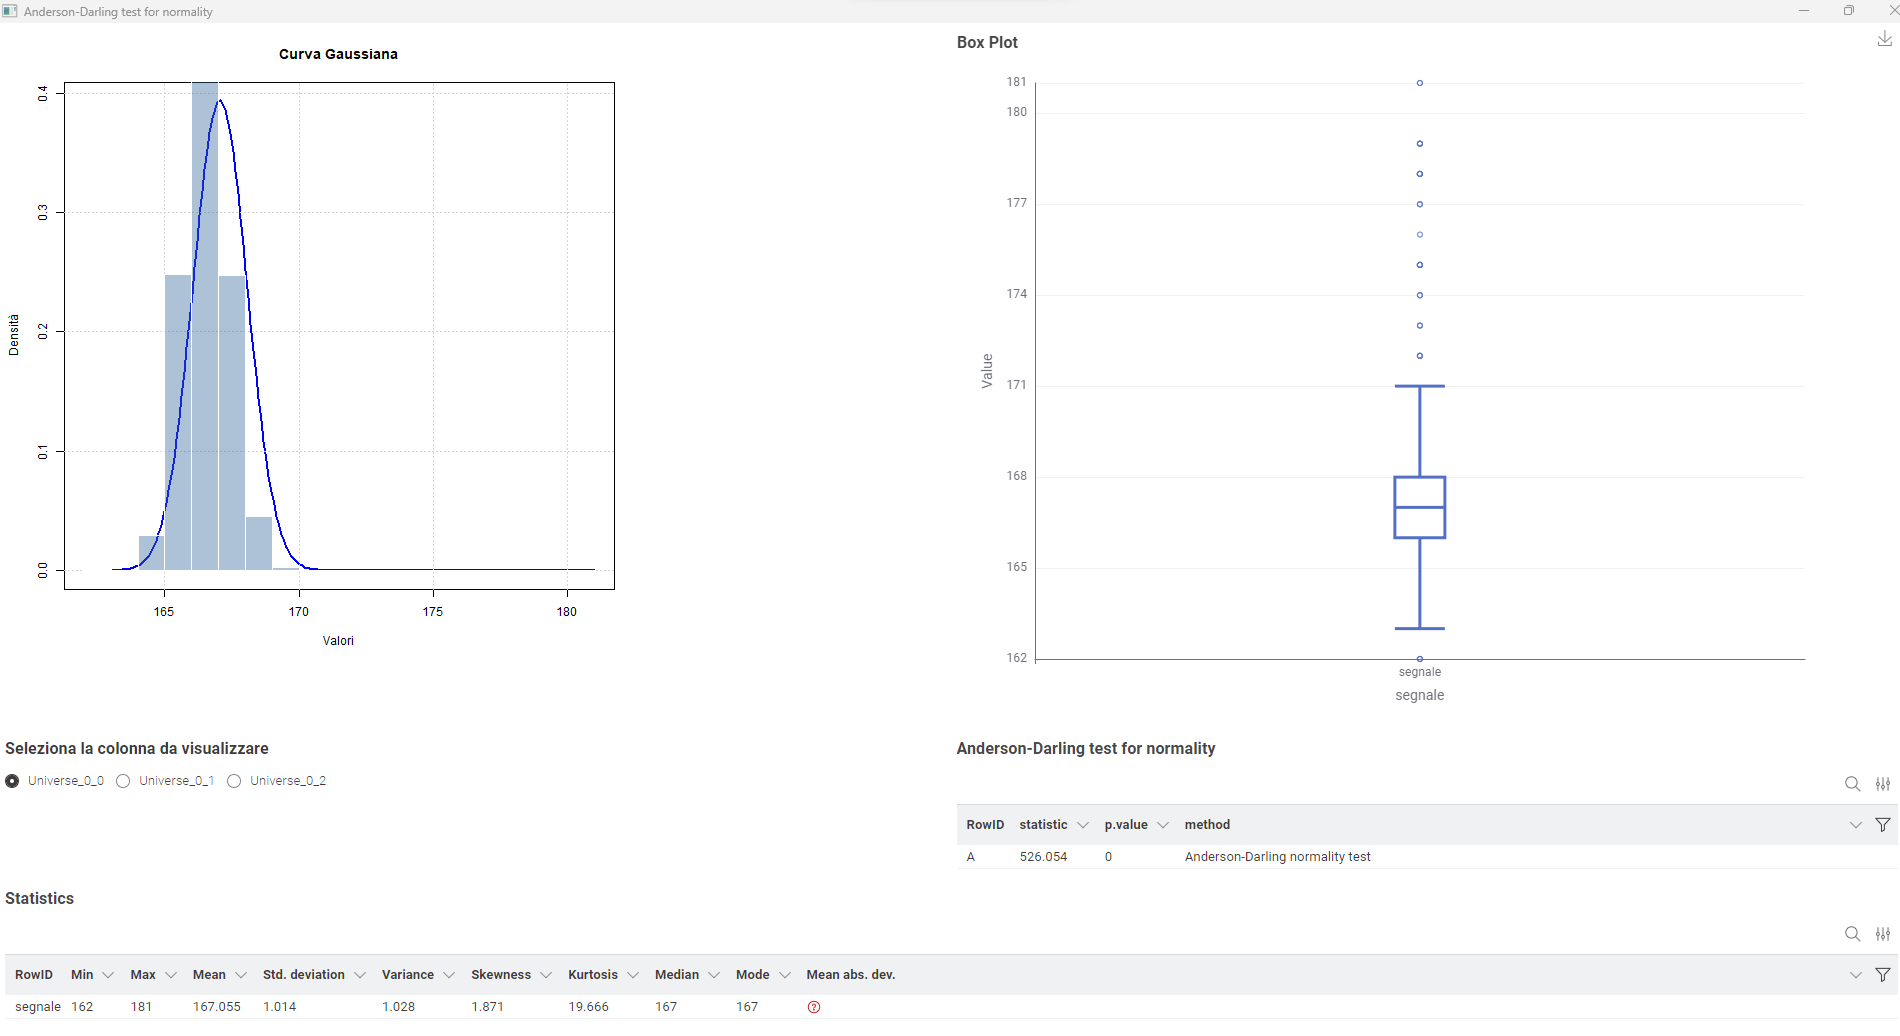
After collecting the data, we need to verify that there are no major quality issues, by checking the range, outliers, and statistics. Here, the Statistics node, the Numeric Outliers node, and other visualization nodes, like the Histogram node or the Box Plot node, play an important role. The statistical tests that are not available in KNIME Analytics Platform have been implemented via Python Script or R Script nodes, like for example a normality test.
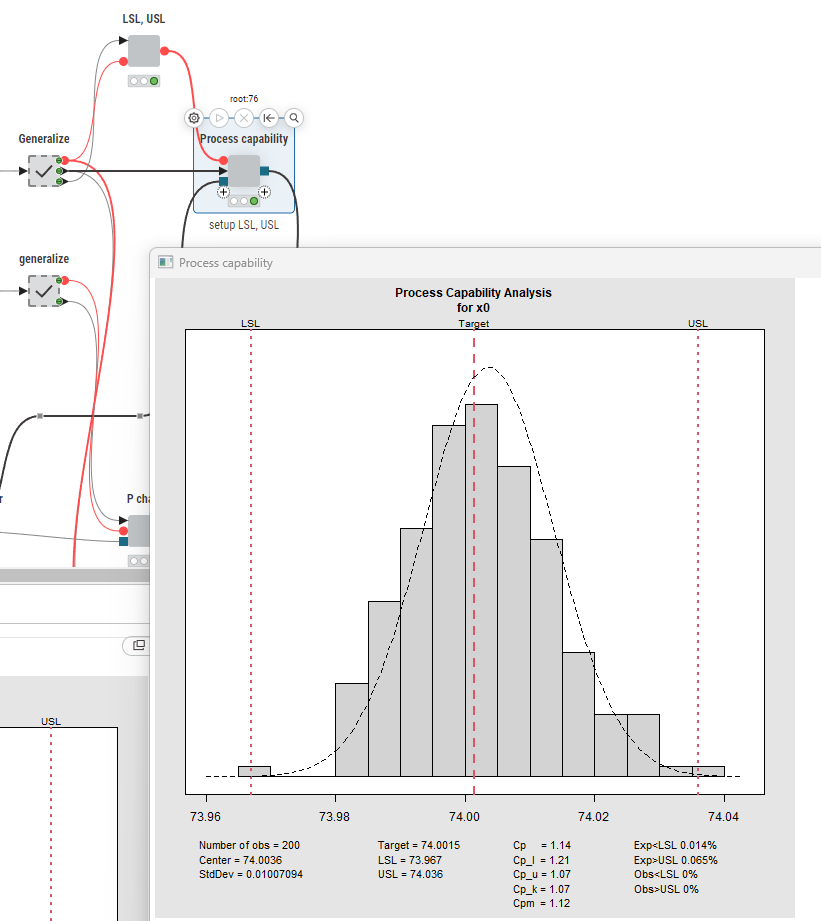
Of course, there is the possibility to execute a complete process capability test:
3. ANALYZE
This is the step where the root causes of defects are analyzed and investigated, the step that uses statistics and data analytics the most. And this is the part where KNIME shines, with:
- Charts and plots for data exploration
- Machine Learning algorithms
- Statistics
- Integration with Python and R
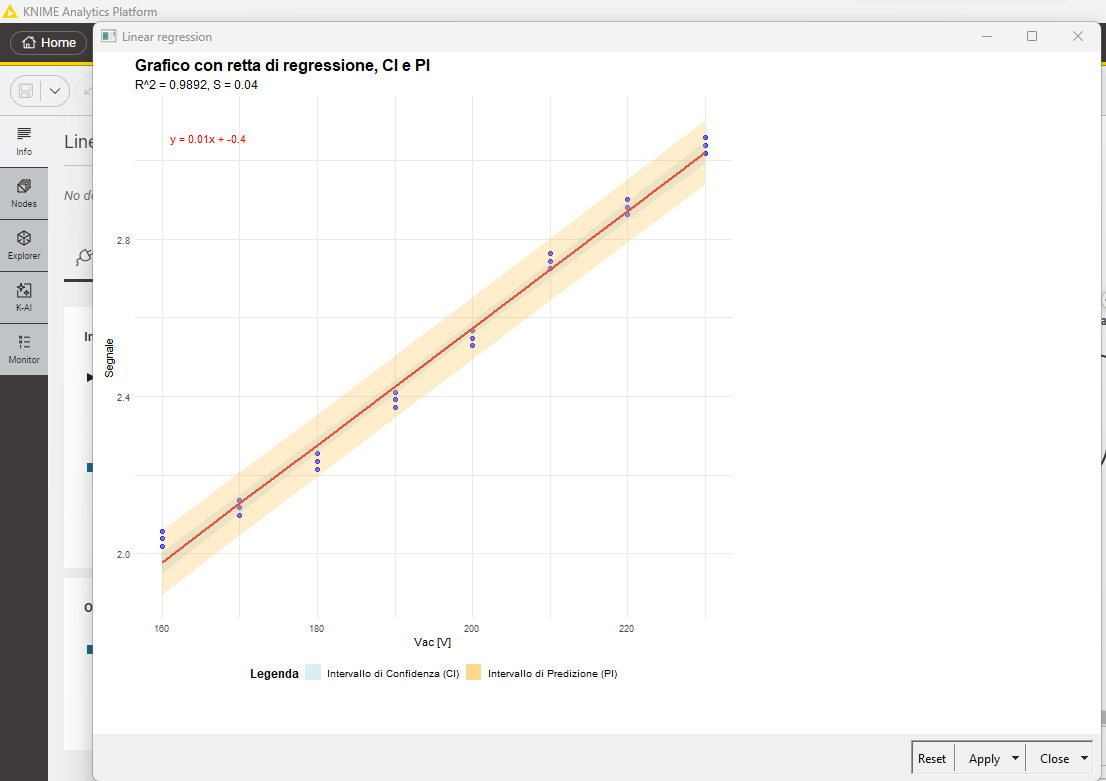
Traditionally, here, regressions are the key to many analyses: simple and multiple regressions, linear and polynomial regressions.
However, at this stage and for prediction, we have also introduced other machine learning algorithms, like random forest, gradient boosted trees, neural networks, deep learning, support vector machine, clustering, time series analysis, and recently, of course, AI.
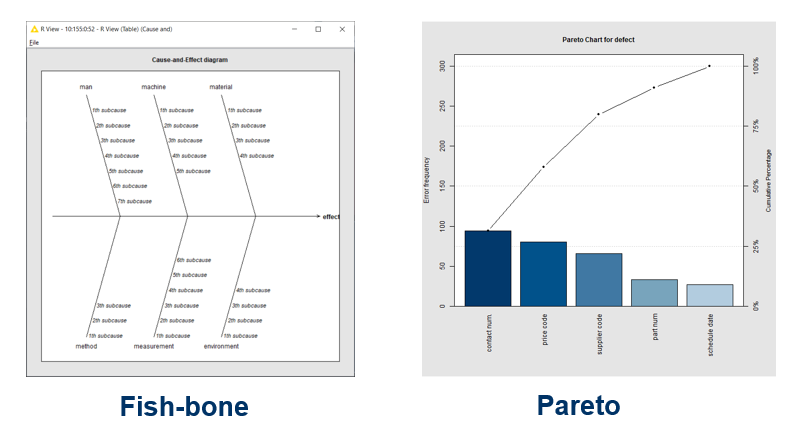
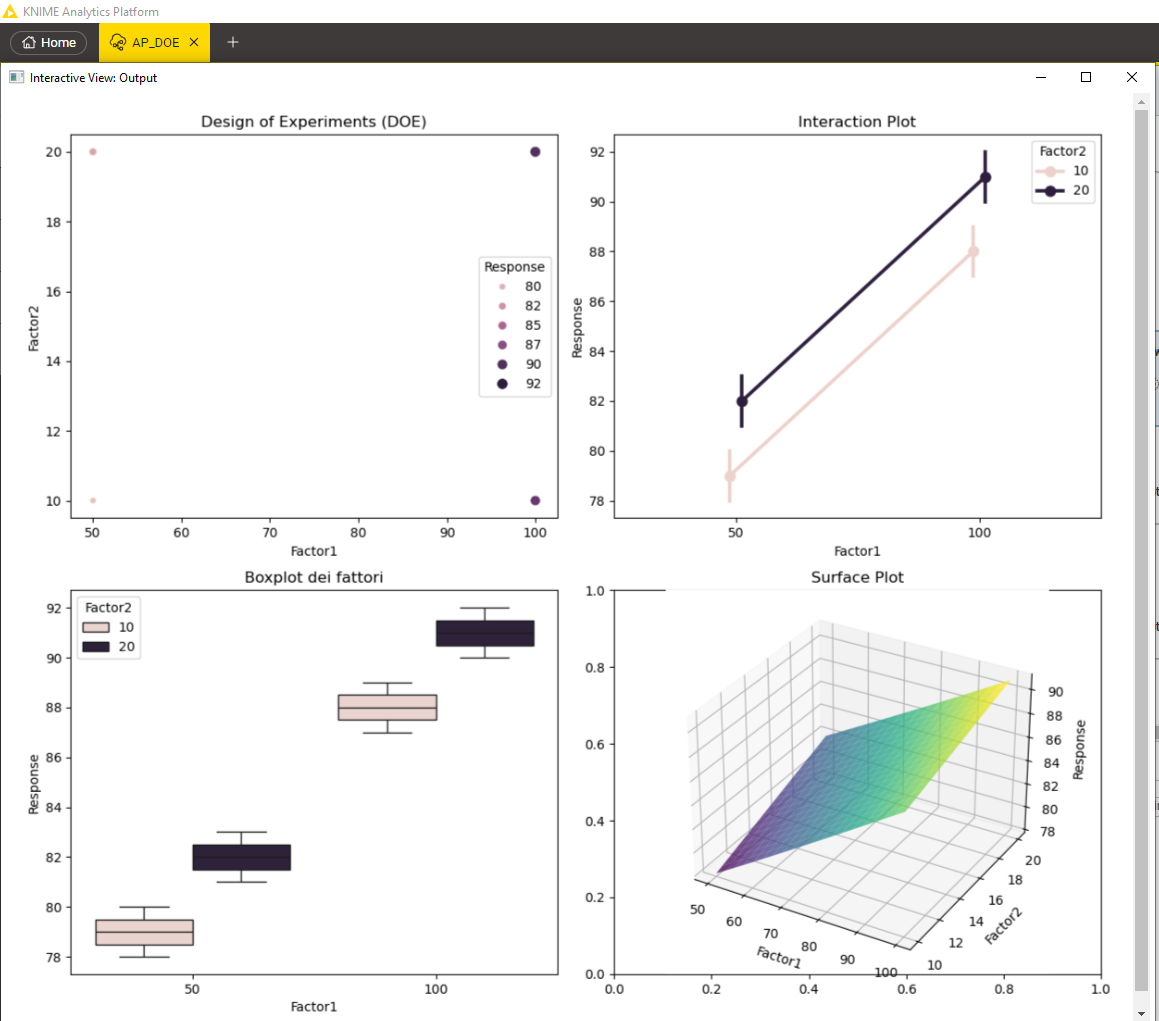
For process visual inspection, we have introduced Pareto charts, Fishbone charts, scatter plots, interaction plots, and many other visualization techniques useful for Design of Experiment (DoE).
As for the previous DMAIC stages, some of these functions are available as native KNIME nodes, some have been constructed as KNIME components, and some have been obtained via Python Script and R Script nodes.
Below the results of a Design of Experiment (DoE) workflow to get insights on the cause-and-effect chain.
Notice that all these interactive views are connected. Selecting a point in the box plot, also selects the same point in the 3-D plot and vice versa. If something is selected or changed in one of the plots, the selection or change is automatically propagated to the other plots of the composite view.
4. IMPROVE & CONTROL
Finally, we defined and implemented control mechanisms, like alarm thresholds, triggers for email sending and REST services, automatic parameter optimization, and more. There are many KNIME nodes for that, either using a rule-based logic or a trained machine learning model.
Lean Six Sigma with KNIME
Does KNIME Analytics Platform provide the necessary tools for data analytics in Lean Six Sigma? Could it be used alongside or as an alternative to commonly adopted statistical software in Six Sigma projects, such as Minitab, JMP, or SigmaXL?
After a year of focused development and testing, our experience suggests that KNIME, especially when combined with Python and R integrations, is capable of supporting many analytical tasks required in Six Sigma initiatives. While the native nodes offer solid coverage for a broad range of analyses, some advanced features may require custom extensions or specific scripting solutions.
We have successfully developed several workflows and components tailored to the DMAIC framework, and we are currently piloting their application in real-world projects. Early results are promising, showing that KNIME can reproduce — and occasionally improve — key functionalities typically handled by traditional software tools.
KNIME stands out as a flexible and powerful open-source platform, with continuous development and strong community support. Rather than replacing specific tools, it offers a complementary and customizable environment for data-driven decision-making in process improvement projects.
A collection of the example workflows and components created for our training activities is available on the AISS space on the KNIME Community Hub.
Explore more resources to use KNIME for LSS
- The AISS (Accademia Italiana del Sei Sigma) website for general information on how to use KNIME for LSS projects (in Italian)
- The AISS space on the KNIME Community Hub for LSS specific nodes and components
You can also watch a webinar by AISS x KNIME to get an introduction to Lean Six Sigma with KNIME.