
To pivot or not to pivot, that is the question.
Did you know that a pivot table allows you to quickly summarize your data based on a group, pivot, and aggregation columns? This summary might include sums, averages, or other statistics, which the pivot table splits the statistics is a meaningful way for different subgroups and draws attention to useful information.
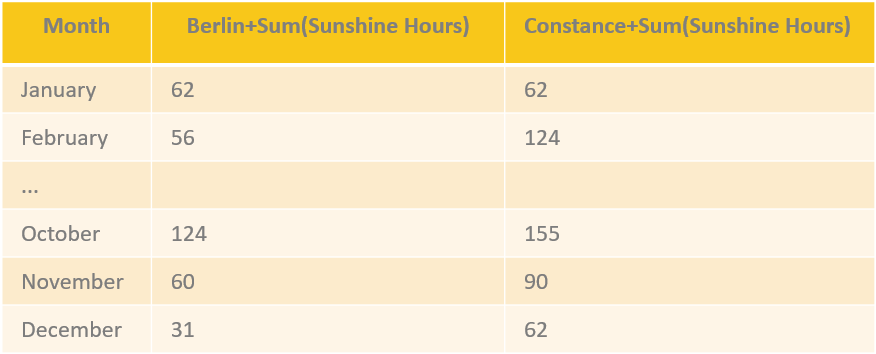
This pivot table, for example, shows the average sunshine hours for each city in each month. This table was constructed by applying the pivoting function to a dataset that contains at least one column for month (group column), one column for city (pivot) and one column for sunshine hours (aggregation column).
Want to learn more about how to pivot in KNIME?
Would you like to know more about how to use the Pivoting node in KNIME Analytics Platform? This vlog features three videos showing you how to use the Pivoting node, how to apply basic aggregation methods, such as sum and count, statistical aggregation methods, and the aggregation methods available for columns of type Date&Time. We also how to apply multiple aggregation methods to one or more aggregation columns.
So, settle down in your chair and get started with the Pivoting Trilogy, starring the Pivoting node.
The Pivoting Node
The video below shows you how to build a pivot table that summarizes data using the Pivoting node. We explain the elements of a pivot table, i.e. groups, pivots, the aggregation method and aggregation column and show how to make these settings in the configuration dialog of the Pivoting node.
Pivoting with Complex Aggregation Methods
This next video shows some advanced layouts of the pivot table using multiple aggregation columns, statistical aggregation methods, and aggregations to columns of type Date&Time. We show you how to apply multiple aggregation methods in the same pivot table, discuss aggregation methods for columns of the type Date&Time; we introduce a new aggregation method: Date range(day), and also the aggregation methods, mean, standard deviation and other statistical measures. Finally we show that some aggregation methods automatically disable the option to include missing values
Pivoting with Multiple Columns
The last video shows some advanced layouts of the pivot table with multiple pivoting and/or grouping columns and how to set the Pivoting node in order to achieve them. We also introduce the new Mode and (Unique) concatenate aggregation methods.
Further Resources
- What’s data aggregation? An explanation is available on this video.
- Examples for using the Pivoting node Download the workflow "Basic and Advanced Usage of the Pivoting Node" from the KNIME Hub
- Pivoting in Databases Download the workflow "Pivoting in Databases" from the KNIME Hub