This is part of a series of articles to show you solutions to common finance tasks related to financial planning, accounting, tax calculations, and auditing problems all implemented with the low-code KNIME Analytics Platform.
Fraudsters are constantly changing their tactics. As a result, fraud datasets are often limited and outdated. That makes it tough to detect fraud.
DBSCAN (Density-based Spatial Clustering of Applications with Noise) is good at detecting fraud because it can identify clusters of varying densities, allowing it to detect anomalies even in highly skewed and noisy datasets. It's these noise points that often correspond to unusual or suspicious transactions that could be fraudulent.
DBSCAN also doesn't require you to specify a number of clusters (i.e. patterns of fraudulent behavior) in advance. This is useful in fraud detection, where the number of clusters may not be known beforehand and can vary over time.
While you can implement DBSCAN in Excel, it's not straightforward - often requiring complex configurations and external plugins such as the one provided through XLSTAT.
The advantage of using KNIME’s integration over Excel is the performance gain you get from index structures which brings the time complexity of the algorithm to O(nlogn) versus a O(n^2) complexity.
In this article, we want to show you how intuitive it is to implement DBSCAN using the low-code KNIME Analytics Platform.
Watch the video for an overview.
What is DBSCAN?
DBSCAN (Density-Based Spatial Clustering of Applications with Noise) is a type of unsupervised learning model that uses a clustering algorithm based on density. It is particularly useful for identifying clusters of varying shapes and sizes in datasets with noise and outliers, making it useful for fraud detection. Unlike other clustering algorithms, DBSCAN does not require specifying the number of clusters in advance, which is helpful when the exact number of fraudulent patterns is unknown.
One of the main drawbacks of DBSCAN is that it is not well-suited for running on very large datasets. The time it takes for training increases significantly as the amount of data grows, which can be a limitation in some scenarios. However, as will be discussed later in this article, we can achieve nearly identical results by taking a small sampling of the input data to minimize the computational load while still effectively identifying fraudulent transactions.
The Task: Identify fraudulent transactions with DBSCAN
Credit card transactions can be categorized into two types: legitimate and fraudulent. The objective here is to accurately identify and flag fraudulent transactions, ensuring that only a small minority of flagged transactions are legitimate. The fraud detection process typically involves a series of manual and automated steps to analyze transaction patterns, customer behavior, and other factors. For our purposes, we will focus solely on the automation aspect of detection by training a model on a dataset and applying it to new transactions to simulate incoming data from an external source.
We will use a popular dataset available on Kaggle called Credit Card Fraud Detection. This dataset comprises real, anonymized transactions made by credit cards in September 2013 by European cardholders. It includes 284,807 transactions over two days, with 492 of them being fraudulent. The dataset illustrates a class imbalance between the ‘good’ (0) and ‘fraudulent’ (1) transactions, where fraudulent transactions account for 0.172% of the data.
The dataset contains 31 columns:
- V1 - V28: numerical input variables from a PCA (Principal Component Analysis) transformation
- Time: seconds elapsed from current transaction to first transaction
- Amount: transaction amount
- Class: ‘1’ means fraud, ‘0’ means good/other
A key feature needed for our training is ‘Class’ as we can use it to score the performance of DBSCAN on the dataset.
The process for creating our classification model follows the steps below. Even if there is data coming from multiple sources, the overall process does not change:
- Create/import a labeled training dataset
- Z-score normalize the data
- Train the model (Create clusters on the data)
- Evaluate model performance
- Import the new, unseen transactions
- Deploy the model and feed the new transactions in
- Notify if any fraudulent transactions are classified
The Workflows: Training a machine learning model to identify fraudulent transactions using DBSCAN
All workflows used in this article are available publicly and free to download on the KNIME Community Hub. You can find the workflows on the KNIME for Finance space under Fraud Detection in the DBSCAN section.
The first workflow covers training our model. You can view and download the training workflow DBSCAN Training from the KNIME Community Hub. With this workflow you can:
- Read training data from a specified data source. In our case, we use data from the Kaggle dataset previously mentioned.
- Data Preprocessing by normalizing and choosing amount of data you want to pass to the DBSCAN clustering algorithm node (a higher percentage = longer time for execution)
- Train DBSCAN with a specified Distance model by using the ‘Numeric Distances’ to pass in the euclidean distance model for DBSCAN to use in the cluster creation
- Mark outliers where NOISE is an indication of a fraudulent transaction
- Evaluate model results by opening the view of the node ‘Scorer’ to check overall accuracy of DBSCAN
- Save the models and table for deployment in the next workflow if you are satisfied with the performance of the model
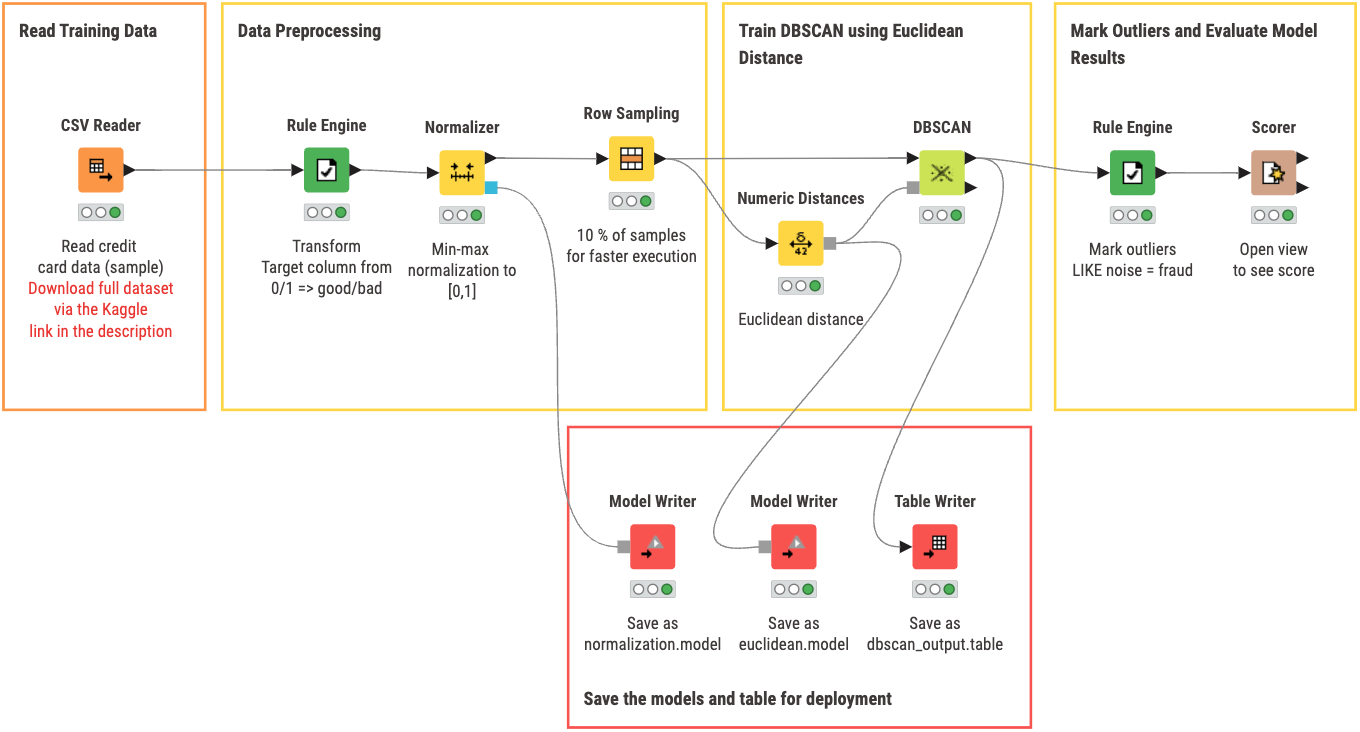
An optional node that is included in the workflow above is the ‘Row Sampling’ node. For our purposes, we do not need to pass in all the data to DBSCAN to speed up node execution. However, as shown later in this post, there is a tangible difference in results if DBSCAN is given more data to work with versus only 10% of initial. For our specific use case, the difference between them is not significant enough to warrant a much longer execution time.
In our second workflow, DBSCAN Deployment, you can:
- Read the models, DBSCAN output, and new data for classification
- Apply the Normalizer to the incoming transaction/new data
- Perform Similarity Search using the saved DBSCAN output and distance model to categorize the transaction
- Mark Outliers classified as noise as a fraudulent/suspicious transaction
- Send an Email to notify if a transaction is fraudulent
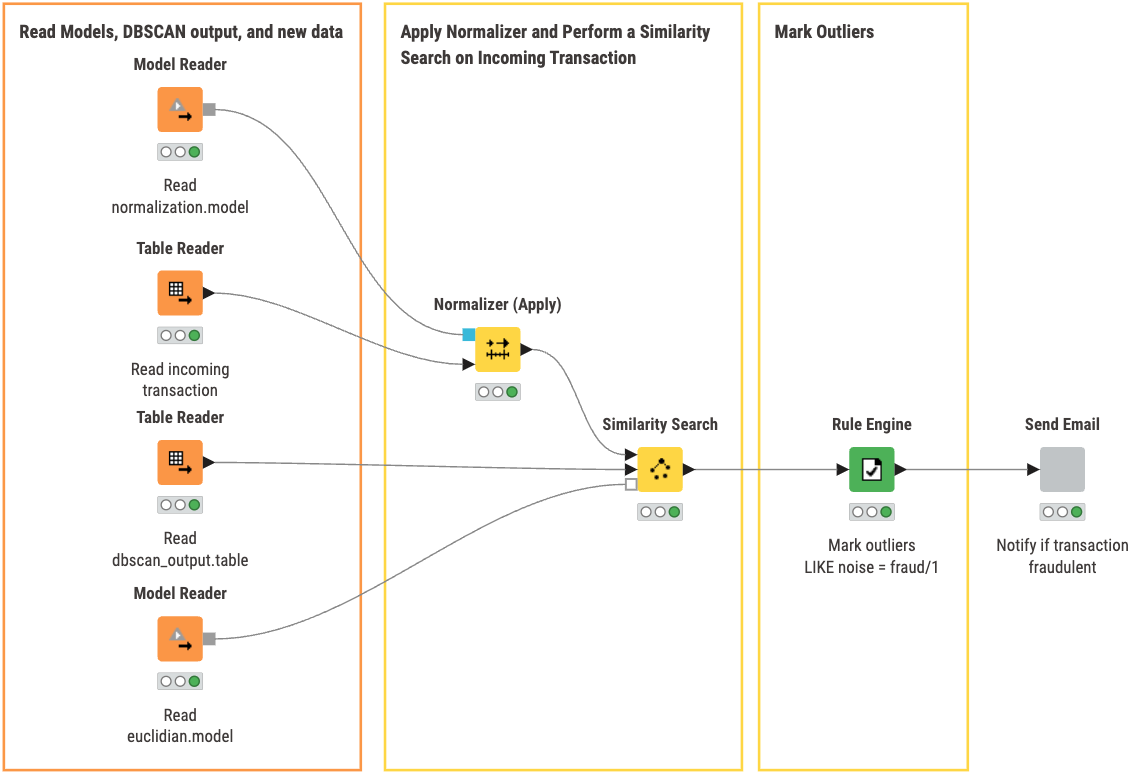
Inside the ‘Send Email’ component, we check whether the transaction is fraudulent or not. If it is, an email is sent to the specified person for follow up.
The Results: A model for classifying transactions with DBSCAN
Let’s go back to the first workflow for a moment. Below is the results we get by opening the view of the ‘Scorer’ node.
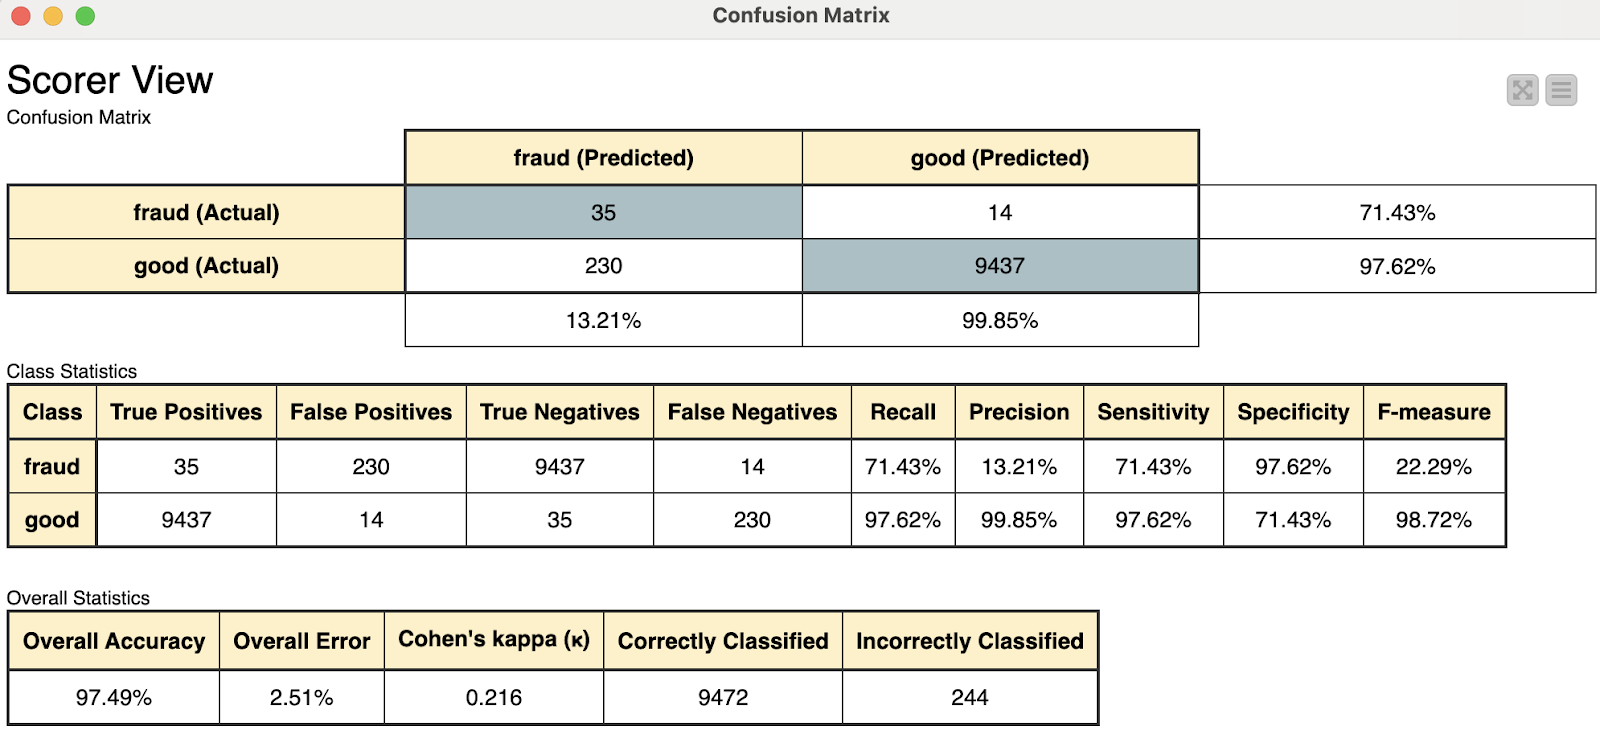
We have two confusion matrices that show us overall results of the model using two different amounts of input for creating the clusters. As shown above, there is approximately a 1% difference between the two results. Although not nearly significant enough to warrant no consideration of the 10% sampling method, it can offer insight into whether or not in the future it will be necessary to train the model on a larger dataset to save time if only marginal improvements are made. To put it into perspective, using 10% row sampling, the execution time was 4-5 seconds, whereas using 100% of our sample data (which is a smaller subset of the full dataset) resulted in around 3 minutes to complete execution. This is about a 3600% increase in time for a little under 1% increase in accuracy!
The new transaction being read in is normalized and passed into the trained model for classification. The new transaction is classified as ‘not fraudulent’ or ‘good’, so our switch statement closes the port to the email.
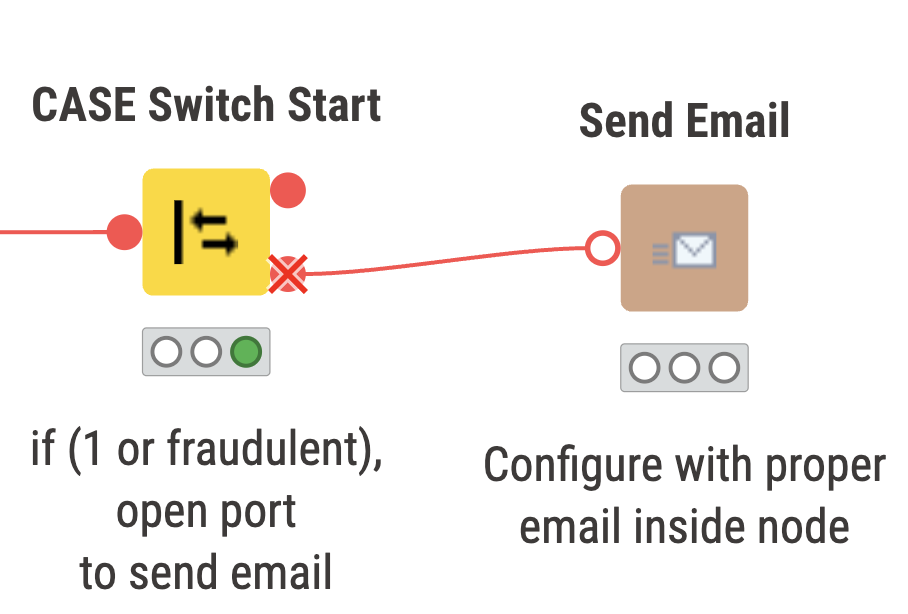
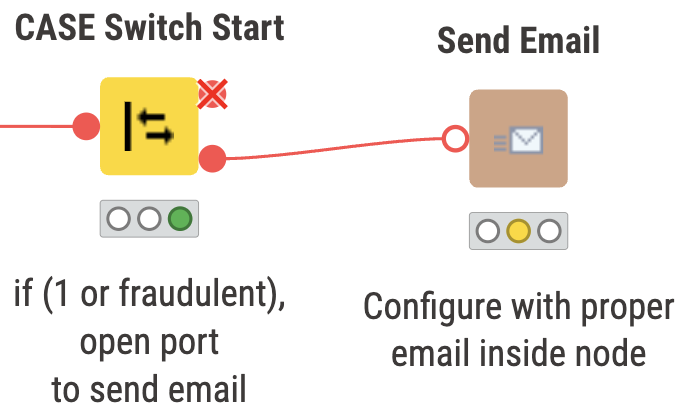
Above we have two snippets of what can be expected to occur depending on the classification of the transaction. On the left, we have a non fraudulent transaction, and on the right the port will open up if the transaction is fraudulent or ‘1’.
KNIME for Finance
KNIME Analytics Platform offers the opportunity for finance professionals to use an advanced clustering technique such as DBSCAN through a low-code, visual, and intuitive user interface.
