
Clustering is an unsupervised machine learning technique that groups similar data points based on their characteristics. The resulting groups, called clusters, represent patterns or structures in the data that may not be immediately obvious.
Clustering is commonly used for data exploration, visualization, prototyping, sampling, and segmentation, and it can produce a single cluster or multiple distinct clusters depending on the data and method used. Unlike classification, clustering does not rely on predefined labels, making it especially useful for discovering previously unknown groups in large or complex datasets.
With recent advances in AI and no-code analytics tools, clustering has become more accessible, allowing non-technical users to apply sophisticated techniques without writing a single line of code.
Types of clustering algorithms
Types of clustering algorithms
There are many clustering algorithms available, each based on different assumptions about how data should be grouped. In this article, we focus on three commonly used methods:
- k-means: groups data into a predefined number of clusters based on similarity
- Hierarchical: builds a hierarchy by iteratively merging or splitting clusters.
- DBSCAN: a density-based method that identifies clusters of arbitrary shape and isolates noise
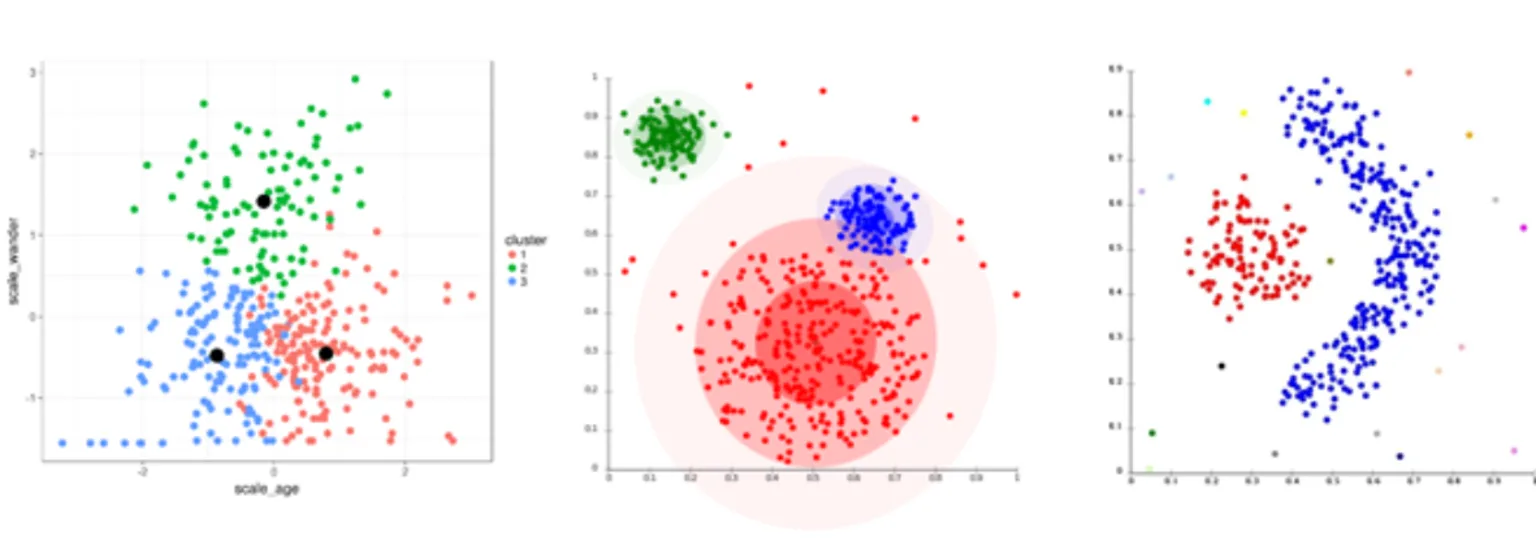
Depending on the algorithm used, the resulting clusters can have very different characteristics, such as shape, size, and density. Clusters may form a hierarchy (for example, when cluster C results from merging clusters A and B), or they may be disjoint, touching, or overlapping.
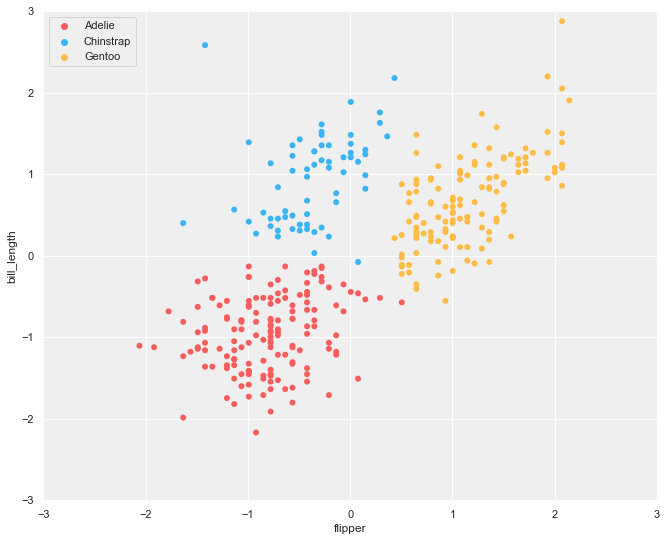
Although each algorithm follows a distinct approach, they can sometimes produce similar results. For instance, when data naturally form well-separated, spherical clusters, both k-means and hierarchical clustering may identify nearly identical groupings.
Let’s take a closer look at how different clustering algorithms produce clusters with different properties.
1. k-Means clustering
K-means clustering is one of the most widely used clustering algorithms. It is a partitioning method that divides the data space into a predefined number of clusters, K. Unlike classification, these clusters do not correspond to known target classes but are discovered directly from the data.
The algorithm begins by randomly selecting K initial cluster centers (see below, left). Each data point is then assigned to the nearest center (see below, right). Once all points are assigned, the cluster centers are recalculated as the centroids of their respective clusters.
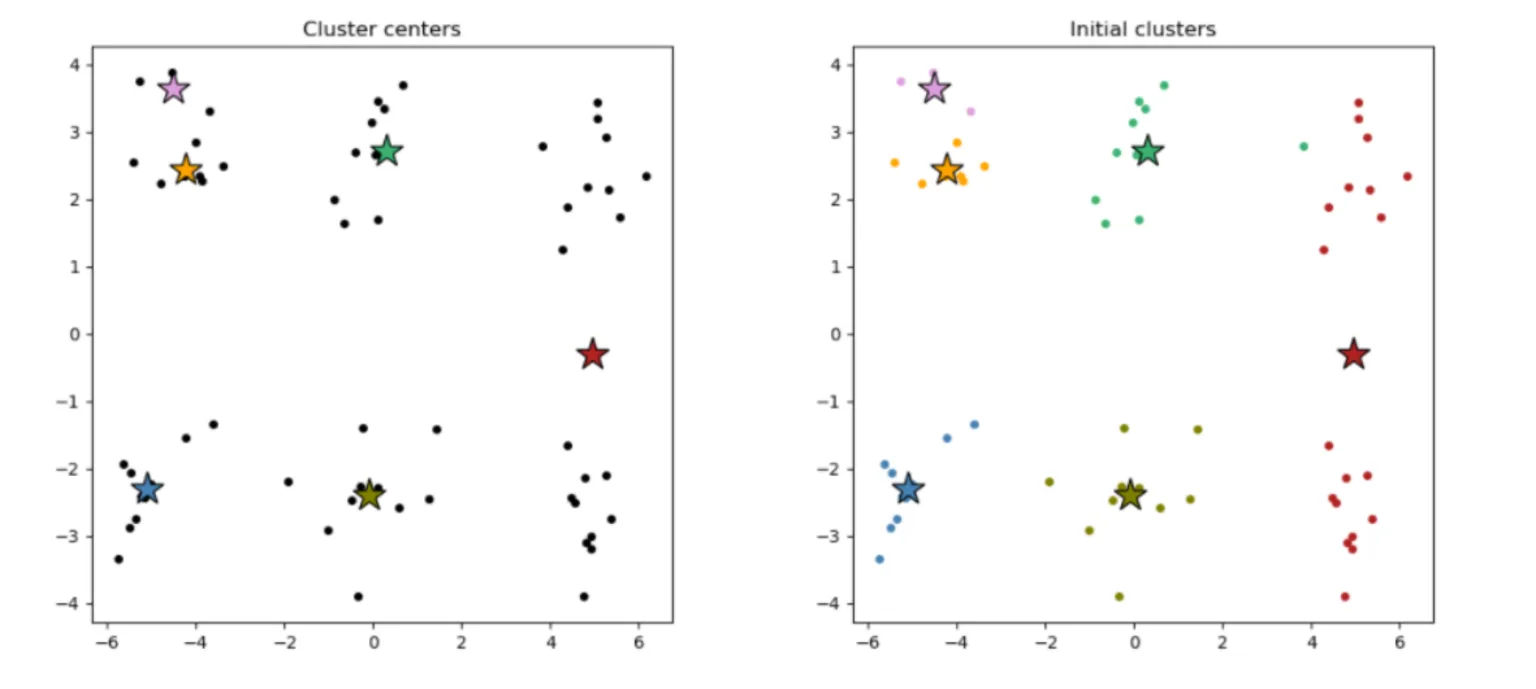
Randomly selected K cluster centers (left) and resulting clusters (right).
This process, assigning points to the nearest center and recalculating centroids, is repeated until the cluster centers no longer change significantly (see below).
k-means performs best when clusters are compact, roughly spherical, and similar in size. Because the algorithm minimizes the distance between data points and their assigned centroids, it struggles with clusters that have complex shapes or have varying densities.
k-means is also sensitive to outliers, which can disproportionately influence centroid positions and reduce clustering quality. For this reason, it is often important to identify and handle outliers before applying the algorithm. Common approaches include removing extreme values, assigning them to a separate cluster, or applying transformations that reduce their influence on distance calculations.
2. Hierarchical clustering
Hierarchical clustering builds clusters by iteratively grouping the closest data points or clusters, forming a hierarchy of increasingly larger clusters. In the beginning, each data point is treated as its own cluster. At each step, the two closest clusters are merged, and this process continues until all data points are combined into a single cluster.
The result is a hierarchy of clusters, which is typically visualized using a dendrogram (see below, left).
A dendrogram shows how data points and clusters are merged at different distances, starting with individual data points at the bottom and ending with one large cluster at the top.
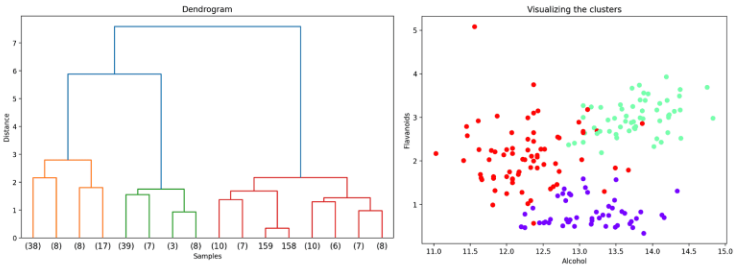
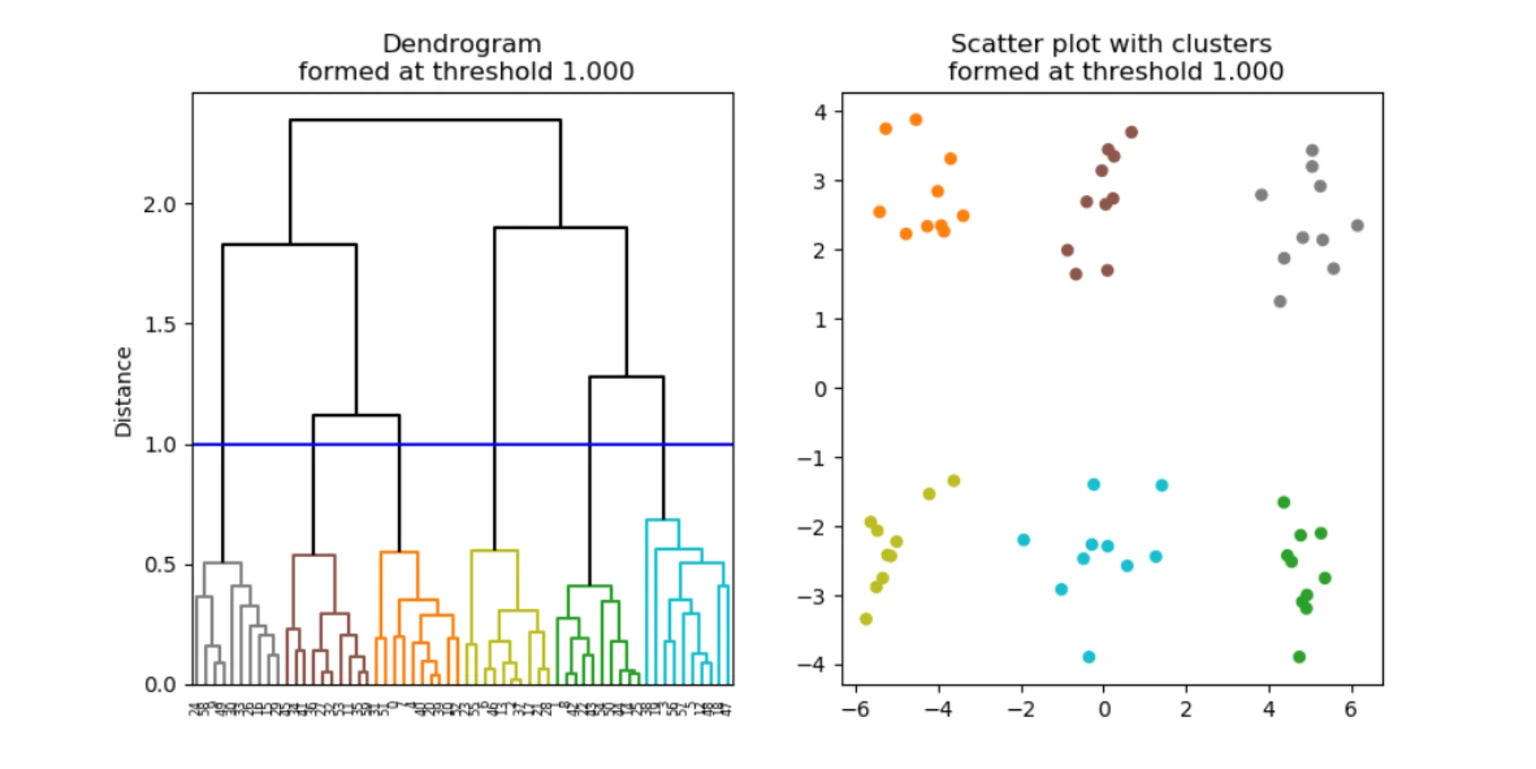
To extract a specific clustering result, a distance cut-off can be applied to the dendrogram. Cutting the dendrogram at a chosen height yields a corresponding number of clusters (see below). This makes hierarchical clustering especially useful for exploratory analysis, as you can examine cluster structures at multiple levels of granularity without rerunning the algorithm. The shape and separation of clusters produced by hierarchical clustering depend on how distances between clusters are defined, which is determined by the linkage method.
Types of linkage methods in hierarchical clustering
Hierarchical clustering commonly uses one of the following linkage methods:
- Single linkage measures the distance between the closest pair of points in two clusters. This method can identify elongated or irregularly shaped clusters, but is prone to forming “chains” of loosely connected points.
- Complete linkage defines the distance between clusters as the distance between their farthest points. This approach tends to produce compact and evenly sized clusters, but may split larger natural groups.
Average linkage calculates the distance between clusters as the average distance between all pairs of points across clusters. This method represents a compromise between single and complete linkage and often provides balanced results.
3. DBSCAN
DBSCAN (Density-Based Spatial Clustering of Applications with Noise) is a density-based clustering algorithm that groups data points located in dense regions of the data space. Points that lie in low-density regions are not assigned to any cluster and are instead treated as noise.
The algorithm begins by examining a data point and identifying its local neighborhood, defined by a distance threshold (ε). If the number of points within this neighborhood exceeds a minimum threshold (minPts), the point is considered a core point, and a new cluster is formed. Neighboring points that also meet the density criterion are added to the cluster, and their neighborhoods are examined in turn.
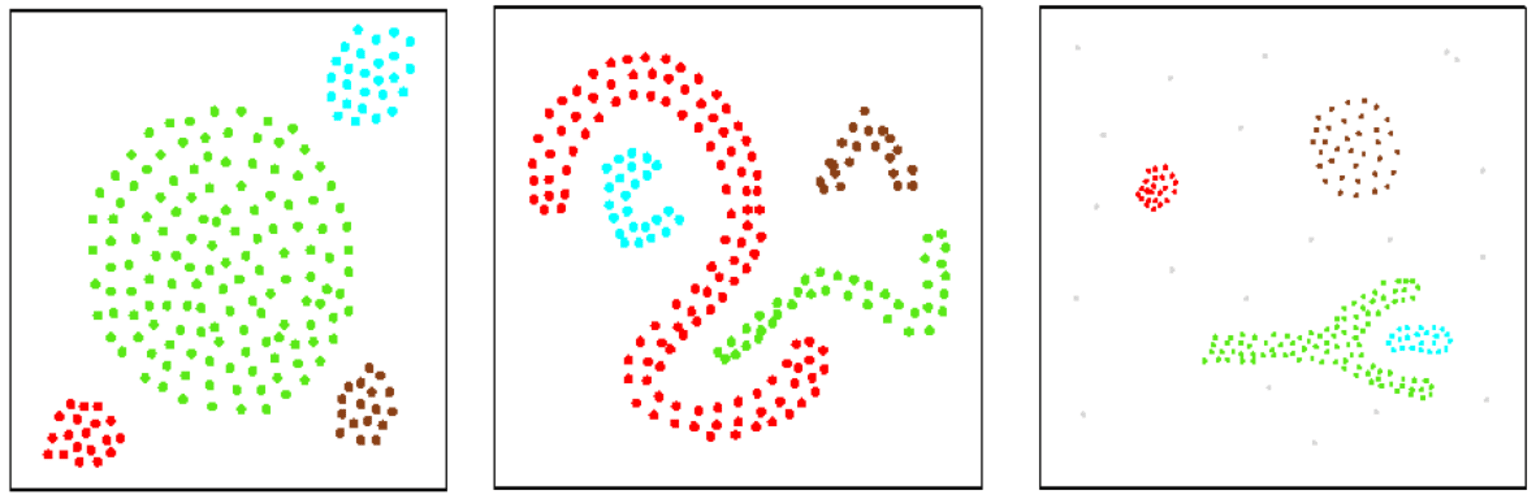
This expansion process continues until no more points can be added to the cluster. DBSCAN then moves on to examine remaining unvisited points, forming additional clusters where density conditions are met, until all points have been processed (see below).
Data points that do not belong to any dense region are labeled as noise. Because DBSCAN relies on local point density rather than distance to a centroid, it can identify clusters of arbitrary shape and is robust to outliers (see below).
How to choose a clustering algorithm
As demonstrated above, different clustering algorithms produce different types of clusters. There is no single method that works well for all data structures or clustering goals. The choice of algorithm depends on factors such as cluster shape, size, density, presence of noise, and interpretability requirements.
Selecting an appropriate clustering method can significantly improve how well patterns in the data are revealed. For example, hierarchical clustering produces a nested structure of clusters, which can be especially useful when analyzing customer behavior in e-commerce. It allows analysts to explore customer segments at different levels of granularity and understand how groups relate to one another.
Once a cluster analysis has been performed, similar data points within a cluster can be summarized using a cluster representative, reducing the size and complexity of the dataset. This enables data reduction, improves computational efficiency, and supports clearer visualization. Clustering can also help identify unusual observations, such as outliers or noise, that behave differently from the majority of the data.
How to apply clustering algorithms without code
KNIME is an intuitive, open-source data analytics tool that enables users to perform cluster analysis, along with many other machine learning and data analytics tasks, without writing code.
Using KNIME’s visual, drag-and-drop interface, you can build, customize, and share clustering workflows with ease. Workflows can be saved and reused across teams, supporting both rapid prototyping and repeatable analysis. While the platform is accessible to beginners, it also offers advanced configuration options and the flexibility to incorporate scripting languages when needed.
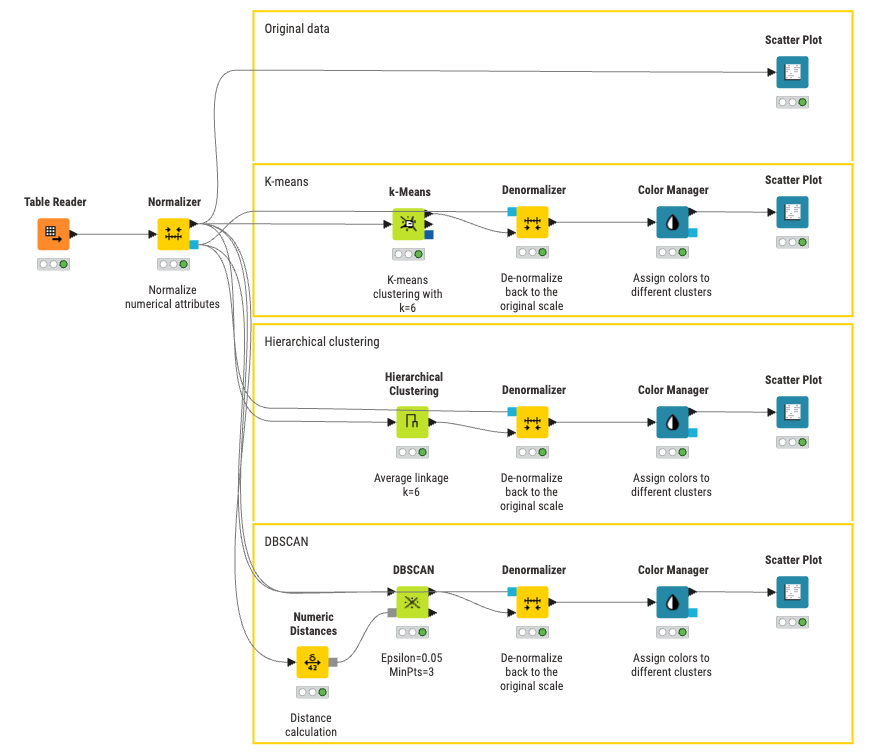
KNIME supports a wide range of clustering algorithms, allowing you to choose the most appropriate method for your data and analysis goals. Above is an example of a KNIME workflow that implements the three clustering algorithms discussed in this article using simulated data.