
It's the backbone of autonomous driving, it's at supermarket self-checkouts, and it's named as one of the trends to power marketing strategies in 2022 (Analytics Insight).
Computer vision is a research field that tries to automate certain visual tasks — e.g. classifying, segmenting, or detecting different objects in images. To achieve this, researchers focus on the automatic extraction of useful information from a single image or a sequence of images. Where entire teams were previously needed to scan networks and websites, computer vision techniques analyze visual data automatically, giving marketers quick insight to create content that will better attract, retain, and ultimately drive profitable customer action.
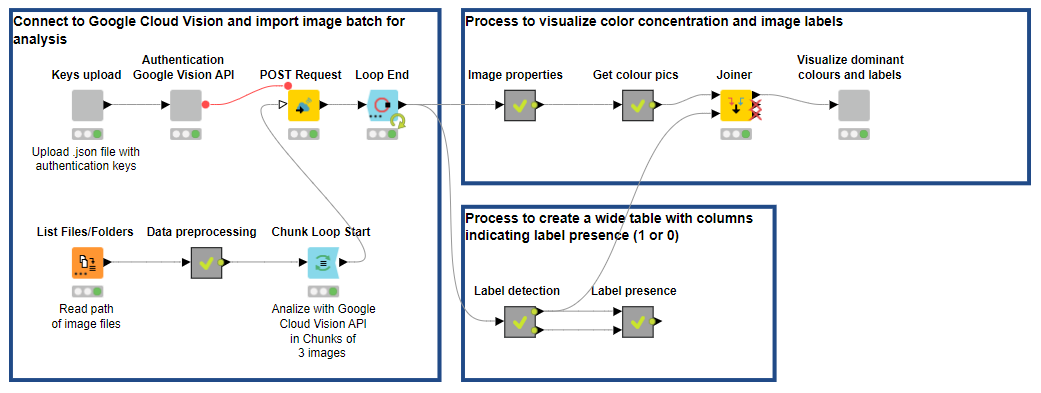
There are different approaches to analyzing image data and extracting features. In this post, we want to walk through an example showing how to integrate and apply a third-party service, namely Google Cloud Vision API, in KNIME Analytics Platform to detect label topicality and extract dominant colors in image data for advertising campaigns.
Note. The workflow is available for free on the KNIME Hub. The Machine Learning and Marketing space on the KNIME Hub contains example workflows of common data science problems in Marketing Analytics. The original task was explained in: F. Villarroel Ordenes & R. Silipo, “Machine learning for marketing on the KNIME Hub: The development of a live repository for marketing applications”, Journal of Business Research 137(1):393-410, DOI: 10.1016/j.jbusres.2021.08.036. Please cite this article, if you use any of the workflows in the repository.
Extract and Visualize Dominant Colors, Label Topicality
In the last decade, Google has consolidated its undisputed position as a leading company in the development of cutting-edge AI technology, research, cloud-based solutions, and on-demand web analytics services that automate complex processes for businesses. One such service is Google Cloud Vision API. It allows users to harness the power of powerful pre-trained machine learning models for a wide range of computer vision tasks to understand images, from image label assignment and property extraction to object and face detection.
It is worth noticing that, while it’s very powerful, Google Cloud Vision API is an automated machine learning model, meaning it offers little-to-no human-computer interaction options. A data scientist can only work on the input data, and after feeding it into the machine, you have little chance of influencing the final model. (Learn about the difference between low code analytics and AutoML in Low Code Data Science Is Not the Same as Automated Machine Learning.)
1. Connect to Google Cloud Vision API
To harness the power of Google Cloud Vision API, we need to first set up a Google Cloud Platform project and obtain service account credentials (read more). To do so:
-
Sign in to your Google Cloud account. If you're new to Google Cloud, you’ll need to create an account.
-
Set up a Cloud Console project:
-
Create or select a project.
-
Enable the Vision API for that project.
-
Create a service account.
-
Download a private key as JSON.
-
You can view and manage these resources at any time in the Cloud Console.
-
Note. When you create a Cloud Console project you have to enter payment details to use the service(s) called via the API (even for the free trial). If you don't do this, you'll incur client-side errors.
To connect to a number of Google services in KNIME Analytics Platform, it is usually enough to use the nodes of the KNIME Google Connectors extension. Thanks to the Google Authentication or Google Authentication (API Key) nodes, you can connect to Google Analytics, Google Storage, Google Sheets, Google Drive, Google Cloud Storage, and Google BigQuery. These nodes, however, do not currently allow you to connect to Google Cloud Vision API. To solve this problem, we can easily create shareable and reusable components to upload private keys as a JSON file and connect to and authenticate Google Cloud Vision.
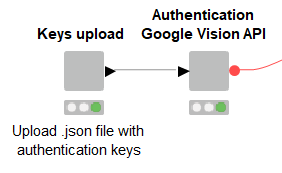
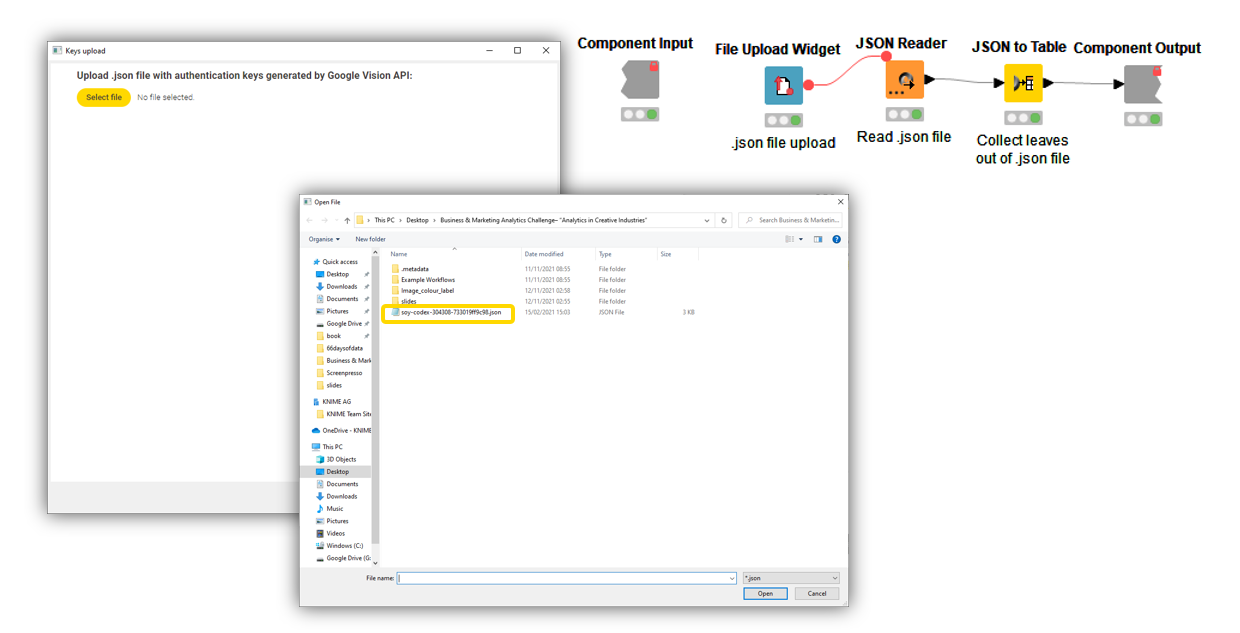
The “Key upload” component allows you to select a JSON file from a local directory, upload it onto KNIME Analytics Platform, and parse it to collect leaves. Although for most applications it is sufficient to copy and paste the keys in the required node, wrapping file ingestion in a component makes the process of selection and upload reusable, faster, less prone to error, and consumable on the KNIME WebPortal (Fig. 2).
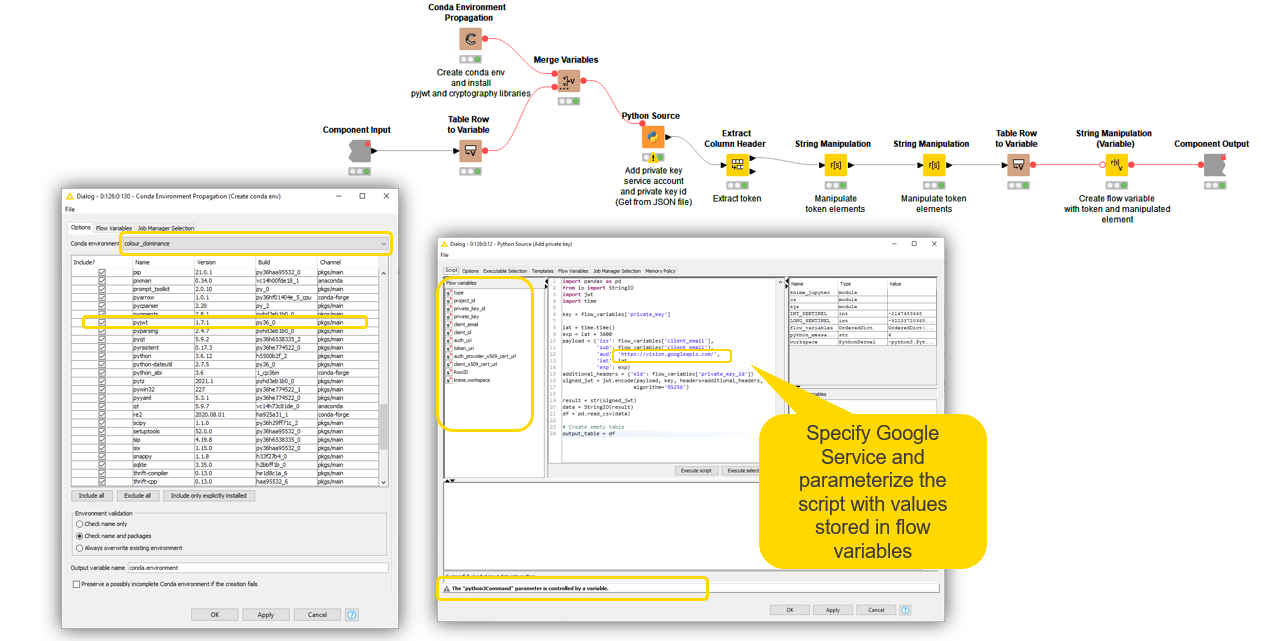
After uploading the private keys, we connect to Google Cloud Vision API and authenticate the service to start using it. The component “Authentication Google Vision API” relies on a simple Python script — parameterized with private keys via flow variables — to generate a JSON web token to send data with optional signature/encryption to Google Vision API. When using a Python script in your KNIME workflows, it’s good practice to include a Conda Environment Prograpation node to ensure workflow portability and the automated installation of all required dependencies, in particular the PyJWT Python library. Once the JSON web token is generated, it’s passed on outside the component as a flow variable.
Tip: Learn more about how to build reusable, reliable, and shareable components.
2. Ingest and Encode Image Data
After completing the authentication, we read the file paths of image data (e.g. shoes, drinks, food) using the List Files/Folders node, and prepare it for the creation of a valid POST request body to call the webservice of Google Cloud Vision.
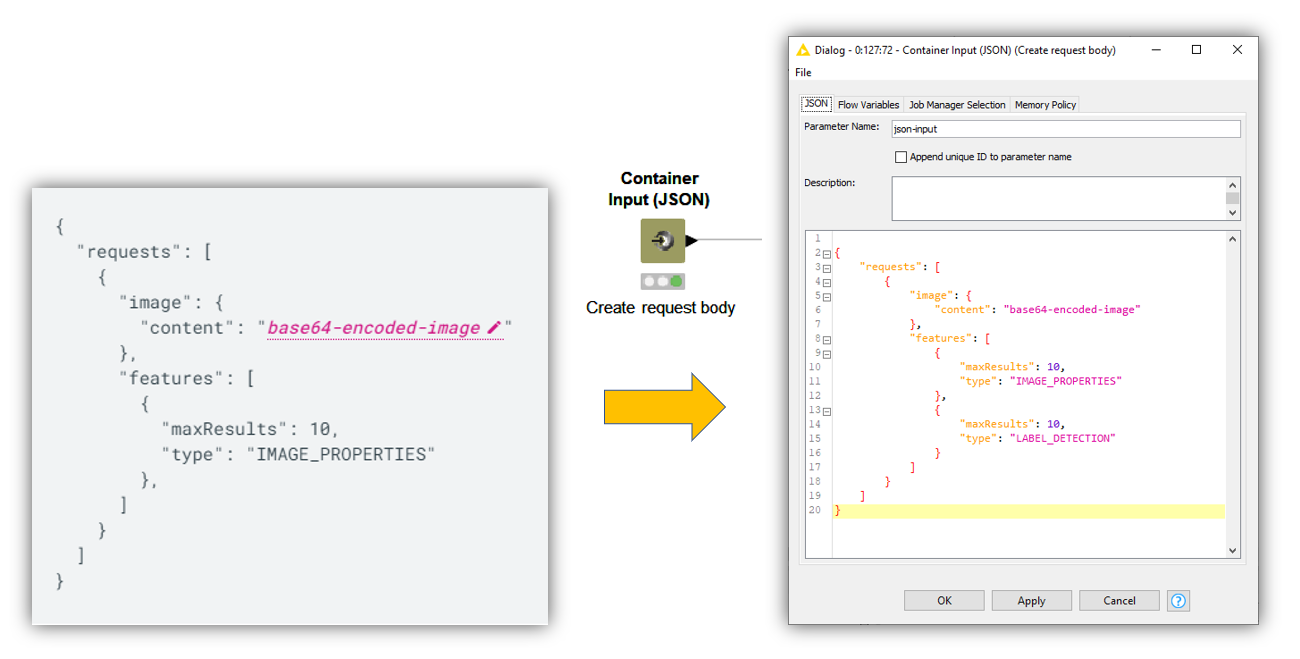
Using the Container Input (JSON) node, we can reproduce the request body structure in JSON format, specifying the image mining type we are interested in (e.g. “IMAGE_PROPERTIES”), the number of max results, and the input image data. The crucial transformation is the encoding of images as a base64 representation. We can do that very easily using the Files to Base64 component, which takes a table of file paths and converts each file to a base64 string.
Wrangling the base64-encoded images back into the JSON request body with the String Manipulation node, we create a column where each row contains a request body to extract features for each input image. We are now ready to call the REST API using the POST Request node.
3. Extract Dominant Colors and Label Topicality
As we already mentioned in earlier sections, we want to mine information about label topicality and dominant colors. Using the POST Request node, we can let Google Cloud Vision annotate image data and return a response in JSON format that we can wrangle to bring it in the shape we want.
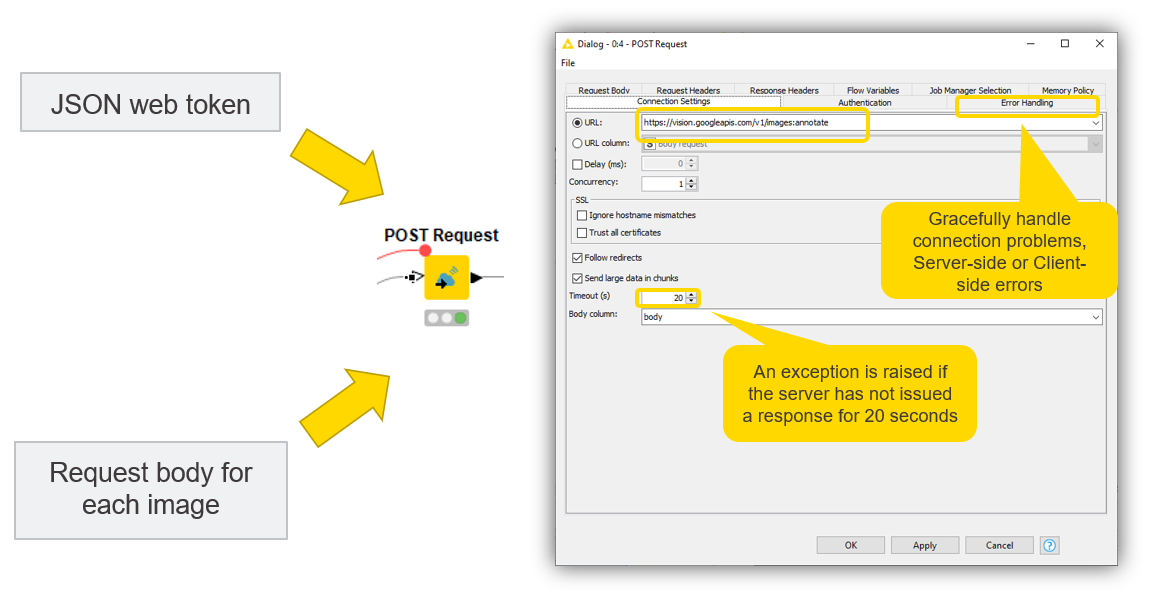
The configurations of the POST Request node are very easy:
-
In the “Connection Settings” tab, specify the URL of the web service and the operation to perform on images: https://vision.googleapis.com/v1/images:annotate.
-
Increase the Timeout time from 2 to 20 seconds in order to extend the server response time to process images.
-
In the “Request Body” tab, point the node to the column containing the JSON request bodies with the encoded images and the image mining types.
-
In the “Request Header” tab, pass on the JSON web token.
-
The “Error Handling” tab handles errors gracefully, and by default outputs missing values if connection problems or client-side or server-side errors arise. Read more about the error-handling capabilities of KNIME’s REST nodes in You can REST easy with KNIME Analytics Platform.
Note. For large image datasets, sending a sole POST request can be computationally expensive and overload the REST API. We can adopt two workarounds: feeding data in chunks using the Chunk Loop Start node and/or checking the box “Send large data in chunks” in the configuration of the POST Request node.
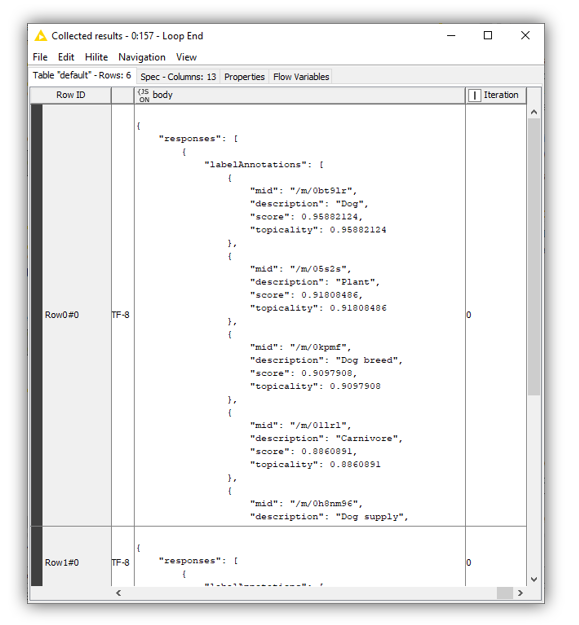
If the request is successful, the server returns a 200 HTTP status code and the response in JSON format (Fig. 7).
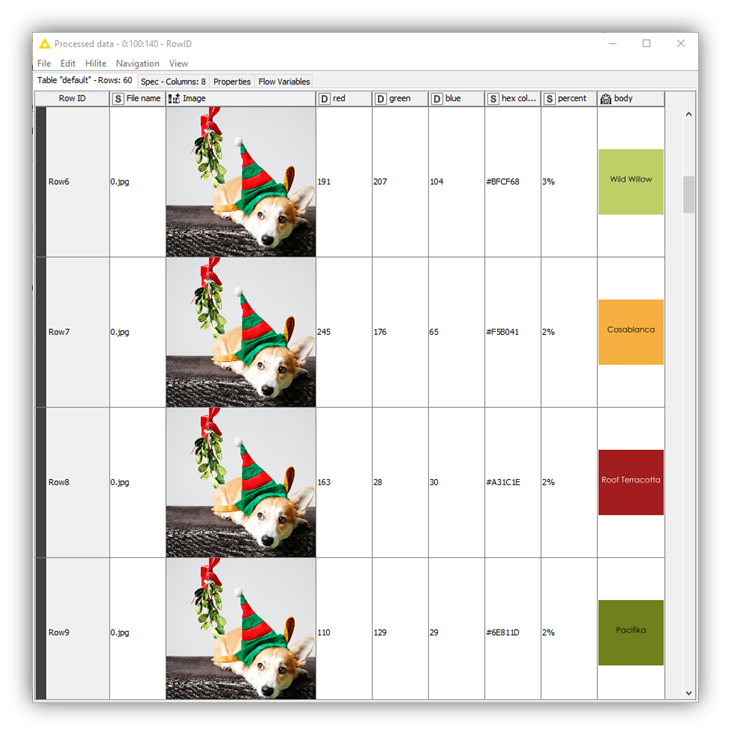
In the “Image properties” and “Label detection” metanodes, we use a bunch of data manipulation nodes — such as the JSON to Table, Unpivoting, and Column Expressions nodes — to parse the JSON response and extract information about dominant colors and label topicality. In particular, using the Math Formula node, we compute dominant color percentages by dividing each score value by the sum of all scores for each image. The Column Expressions node converts RGB colors into the corresponding HEX encoding.
The conversion into HEX-encoded colors is necessary to enrich the table view in Fig. 8 with actual color names that are easier to understand for the human user. To do that, we rely on The Color API. This web service can be consumed via a GET Request that identifies each color unequivocally by its HEX-encoding. The Color API returns an SVG image containing the color name and image. It’s worth mentioning that the retrieved color names are purely subjective and are called as such by the creators of the API.
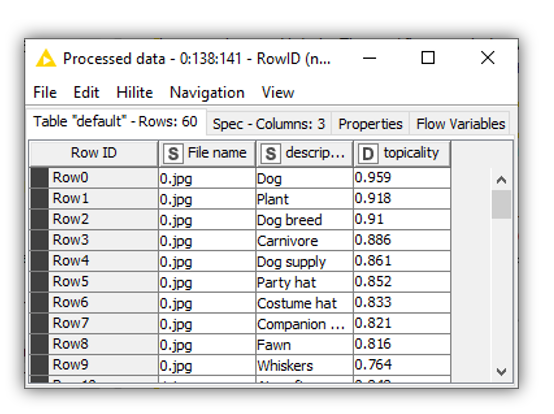
Following a similar JSON parsing procedure, for each image topic labels are extracted and their topicality value sorted in descending order (Fig. 9).
4. Visualize Results with an Interactive Dashboard
Once dominant colors and topic labels have been mined and parsed, content marketers may benefit greatly from the visualization of those features in a dashboard where visual elements can be dynamically selected (Fig. 10).
The key visual elements of the dashboard are three JavaScript View nodes: the Tile View node to select the image, the Pie/Donut Chart node to plot label topicality, and the Generic JavaScript View node to display a Plotly bar chart with different colors and percentage values according to the selected image. The essential touch of interactivity and dynamism in the dashboard is given by the Refresh Button Widget. This node works by producing a series of reactivity events that trigger the re-execution of downstream nodes in a component by conveniently connecting the variable output port to the nodes that the user wishes to re-execute. This means that we can interact more easily with input data in components without leaving the component interactive view, and create dynamic visualizations to make UI even more insightful and enjoyable.
For example, content marketers can use this workflow and the resulting dashboard to identify the two major topic labels in the example image in Fig. 10. Perhaps unsurprisingly, “dog” and “plant” stand out. What is surprising, however, is the most prominent color:red, at 26% dominant. This appears fairly counterintuitive, since red is used only in the ribbon and hat, whereas other colors, such as black or beige, occupy many more pixels.
Understanding why the underlying model determines that red is the dominant color is not easy. The official documentation of Google Cloud Vision API does not provide much information. On the GitHub repository of Google Cloud services, it is possible to find a few possible explanations. The assumption that the color annotator blindly looks at the pixels and assigns a value based on how many pixels have similar colors seems naive. Rather, the model determines the focus of the image, and the color annotator assigns the highest score to that color. Hence, in the example image, the hat is identified as the focus of the image and red as the most prominent color, followed by different shades of black.
Note. The validity of these explanations remains largely unverified by the official provider.
The workflow Extraction of Image Labels and Dominant Colors is available for free on the KNIME Hub.
AutoML Models as Web Services for Ease of Consumption
Image feature mining is a complex task that requires abundant (annotated) data and substantial computational resources to train and deploy versatile machine learning models that perform well across a wide range of subtasks. Additionally, for most tools, you still need to overcome the coding barrier.
Based on this premise, AutoML models for image mining made consumable as web services via REST APIs have flourished and become popular and powerful alternatives to self-built solutions. In that sense, Google Cloud Vision API is probably one of the most innovative technologies currently available, and has reduced considerably implementation costs, delivering fast and scalable alternatives. Yet very often, web services based on AutoML models have two major drawbacks: they offer no room for human-machine interaction (e.g. improvement and/or customization), and their underlying decision-making process remains hard to explain.
While it’s unlikely that these drawbacks will undermine the future success of AutoML models as REST APIs, it’s important to understand their limitations, and assess the best approach for each data task at hand.