This piece is a write-up of a talk delivered by Prof. Wendy Guan, Executive Director of the Center for Geographic Analysis (CGA) at Harvard University.
Geospatial data is invaluable to organizations for site optimization, supply chain planning, environment management, fraud detection and more.
However, accessing and analyzing this data has traditionally required specialized expertise and the use of systems with exceptional processing power. This has blocked geospatial data’s full utilization: an especially unfortunate state of affairs, as geospatial data is also useful in understanding complex problems with regional components like climate change, public health issues, and political conflicts.
The Center for Geographic Analysis (CGA) team at Harvard set out to overcome these problems using KNIME, to make Geospatial Data useful and usable for all.
First, What’s Geospatial Data?
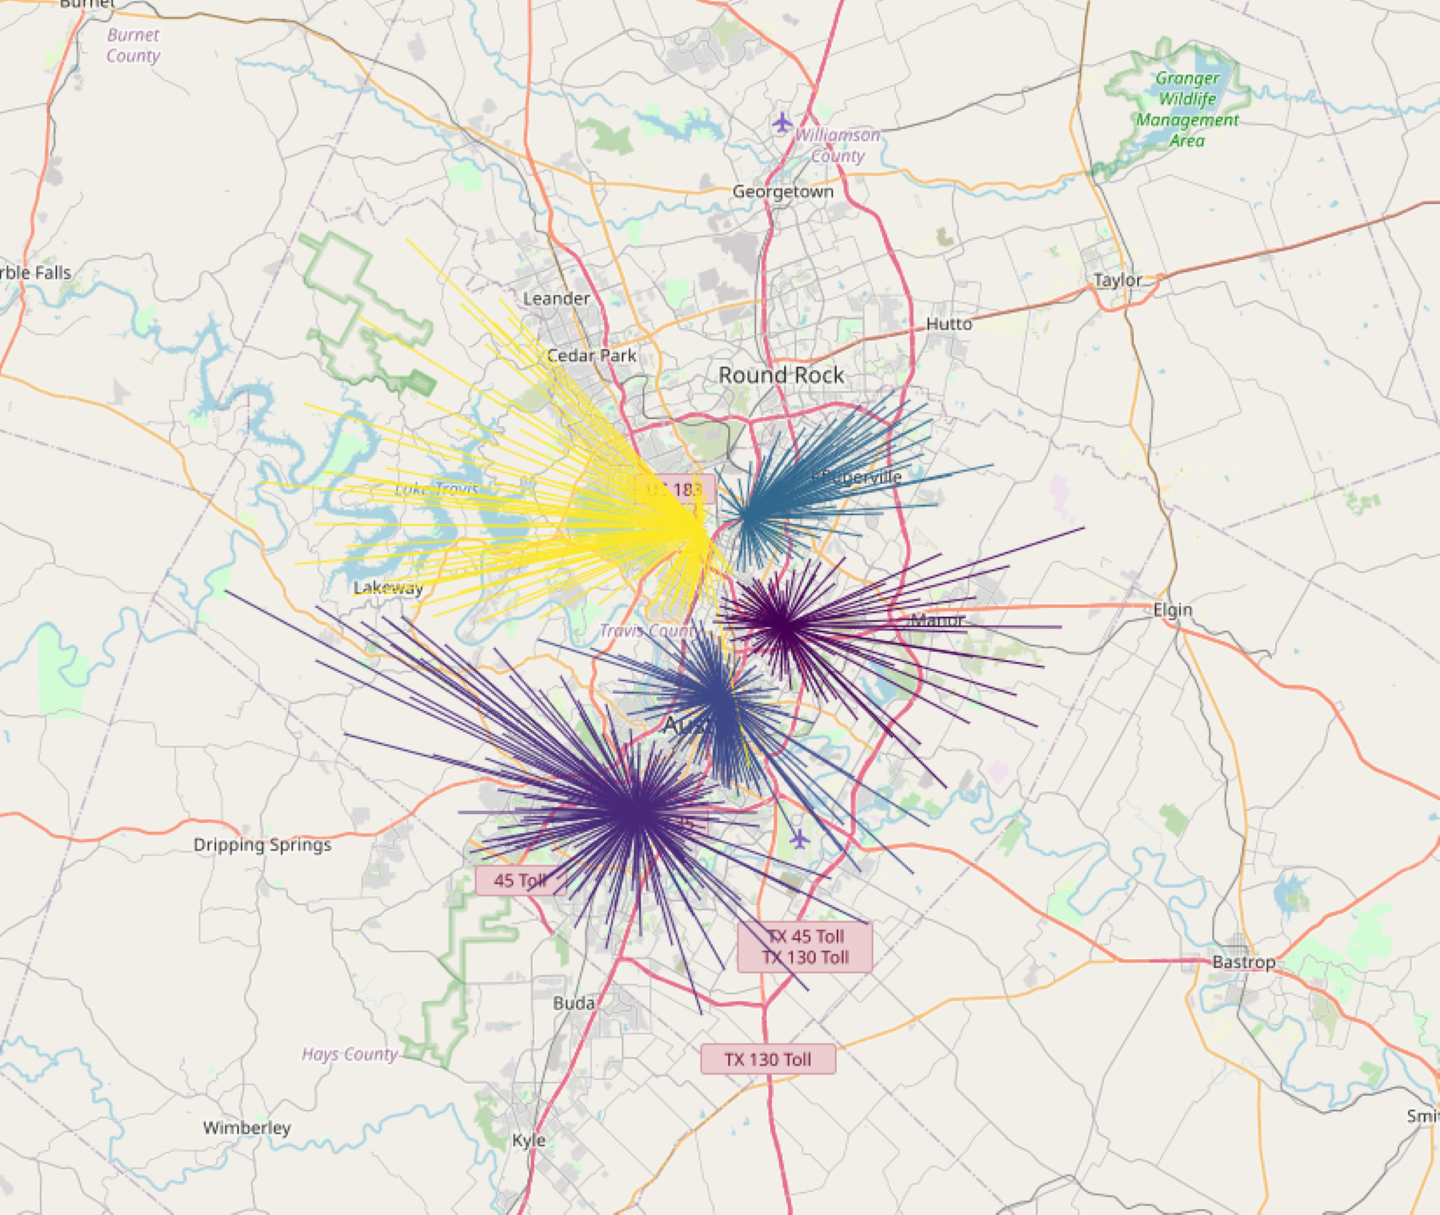
Geospatial data is location data at a specific time. It can be used to uncover connections between variables, as well as identify patterns and trends within the data. By introducing additional dimensions of ‘location’ and ‘time’ to the data being analyzed, it adds multidimensionality to the data science life cycle.
Furthermore, it can provide valuable context and insight that would not be available if only considering traditional, non-spatiotemporal data dimensions. For example, geospatial retail sales data can help to optimally define the location of stores based on the proximity to potential customers; in finance, geospatial data can help identify clusters of suspicious activity, and thus help in fraud detection; or, across the supply chain, geospatial data can be used to optimize the movement of goods and materials by helping companies identify the optimal routes between facilities, thus reducing shipping time.
However, it’s both difficult to process, and difficult to share.
Geospatial Data is Difficult to Process
Effective geospatial data analysis has traditionally come at a cost: it can be difficult to process due to its size and complexity, with geospatial data sets like LiDAR point clouds, satellite imagery, and GIS vector data often being extremely large. A single satellite image can have billions of pixels, for example, and these large data sets require specialized software and significant computational resources for processing and analysis.
Additionally, geospatial data is often distributed across multiple sources, each with its own format and coordinate system, making it difficult to integrate and analyze, as it may require extensive cleaning and preprocessing.
Although government agencies, industries, and academia have supported geodata services (such as Google Earth Engine) to overcome these challenges, these platforms are themselves often high maintenance, and they lack customizability. They also have a high development cost and suffer from slow implementation, meaning problems associated with the processing and management of geospatial data have persisted.
Due to these challenges, many organizations, large and small, rely on specialized geospatial data processing software, and high-performance computing resources to handle the processing and analysis of geospatial data.
The team at Harvard aimed to make geospatial data accessible and available to all. To do so, they summarized that any solution aiming to make geospatial data usable needs to:
-
Have high performance computing power, especially for spatio-temporal processing
-
Provide easy data access, especially as geospatial data is regularly updated.
-
Be able to handle heterogeneous data integration.
-
Offer efficient data analysis and visualization
Geospatial Data has to be Shared to be Useful
A second problem arises in respect to collaboration: geospatial data is most useful when it’s shared among different domains and different kinds of experts for collaboration.
As spatio-temporal data cuts across different domains, different kinds of experts are required to establish relationships between location, time and other phenomena. Not sharing this information hinders other domains, or indeed, individuals who may benefit from knowing more about geospatial data. For example, governments may benefit from more precisely knowing how people from different socioeconomic classes are spread across regions; not knowing this will hinder the adequate provision of public services to support people with different needs.
However, not every domain is filled with data experts, for example, Humanities departments at universities. Nevertheless, sharing geospatial data may result in interesting findings and projects that data experts alone could not themselves identify.
Nevertheless, it might not be shared with different domains for a number of reasons. Firstly, geospatial data may be stored in a number of inaccessible formats, such as raster and vector data, making it difficult for different domains to share, read and use the data. Secondly, the data may require bespoke software to be shared, and not every domain might have access or the specialist knowledge to use this software. Finally, non-data experts might simply not be aware of how to use the data if it is shared.
As such, the Harvard team determined that a solution to these problems would be a platform which enabled collaboration between data and domain experts, by:
-
Making geospatial data easy to access and understand.
-
Using a platform which was intuitive and didn’t require specialist data science knowledge.
-
Enabling non-data experts to become self-sufficient in the use of geospatial data, by focusing on data re-use and reproducibility - allowing them to learn from established blueprints.
As such, the Harvard team determined that it’s even more vital that any solution that aims to use geospatial data also enables collaboration.
Using KNIME to Make Geospatial Data Usable and Useful
The Spatial Data Lab at Harvard solved these problems by using KNIME to work with geospatial data while focusing on reuse and recycling, creating reproducible blueprints for users to download and adapt to their own needs.
The Lab did this by converting geospatial analytics into native KNIME nodes, and then using these to build geospatial workflows in the KNIME Analytics Platform, which are then deployed. This connects to Cloud data streams, and then publishes results on the web portal.
As geospatial data needs to be discovered, explored, analyzed and visualized quickly, the team found KNIME’s low-code/no-code, workflow-based platform to be highly suited to the task, as the data processing pipelines created by workflows can perform complex tasks while being easy to understand and maintain.
Furthermore, as KNIME can work with and integrate data from multiple sources, users could easily access, transform, and combine geospatial data of differing types and from different sources easily. This helped solve the problems of processing power and maintenance.
Additionally, the team were then able to test the model on various devices and extend it with their own code. KNIME's no-code, low-code interface allowed users to easily load and manipulate geospatial data, and then perform various analysis techniques, such as spatial filtering to focus on specific areas of interest, and spatial aggregation to summarize data across a region or area.
As the workflows and results can be shared with different users, this solved the problem of collaboration. It also enables different users to access and reuse the workflow, without having to “go under the hood” and understand the mechanics of the data science of geospatial analytics itself. Not only does this help different domains access and use geospatial data, it also helps promote self-sufficiency in data use, independently of data experts.
Why the Lab Chose KNIME to be the Foundation of the Lab
The Lab chose KNIME, as KNIME:
-
is open source: offering zero startup cost, the total cost of ownership was highly competitive against costly alternatives.
-
can handle the processing challenges: its workflow-based interface makes it possible to carry out complex geospatial analytics quickly.
-
supports collaboration: the platform makes it easy for teams to share work, including with people from different domains.
Furthermore, KNIME:
-
Offers End to End Data Science capabilities: enabling automation from data input, manipulation, visualization, mining, reporting and web-based services
-
Is intuitive: its low-code, no-code environment makes it easy for users of all skill levels to use.
-
Is customizable: it allows data experts to extend their work using Python/ R /Java and other scripting languages.
-
Provides integrated environments for desktop and server versions.
-
Offers a workflow-driven Web Portal service makes for easy-to-use, interoperable, and executable data modeling and reporting.
“We chose KNIME because “KNIME is great”. Most important for us, it’s Open Source, so there’s no upfront cost, and we can do so much with it.” - Wendy Guan, Harvard CGA Team
Making Geospatial Available to All
Some of the main challenges with geospatial analytics are that it often requires specialized skills and tools to perform effectively. This can be a barrier for many organizations, especially those that do not have the resources or expertise to invest in dedicated software and training.
The Spatial Data Lab at Harvard and KNIME are changing this by providing an easy-to-use, intuitive interface that allows anyone to perform geospatial analysis without the need for specialized skills or training. This means that even organizations with limited resources can benefit from the power of geospatial analytics, truly creating steps for geoanalytics for all.
Discover more about KNIME's Geospatial Analytics capabilities: