
ECG – it's the abbreviated term for electrocardiogram, an electrogram that records heartbeats. ECG tests are one of the most commonly performed tests to detect heart problems and monitor heart health: Over 100 million are performed annually in the US alone.
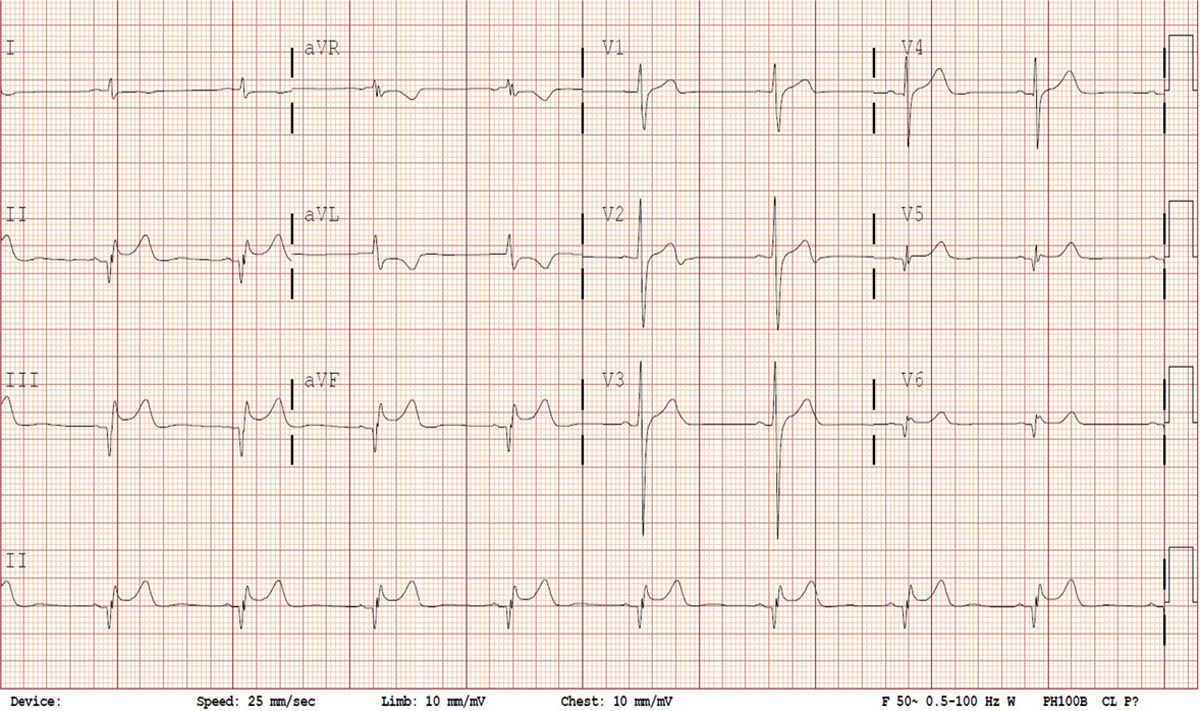
The graph produced is a time series of voltage recorded by electrodes placed on the patient’s skin. The electrodes detect slight changes in the activity of cardiac muscle depolarization, followed by repolarization across every cardiac cycle. The changes in signal pattern correspond with various cardiac abnormalities, deficiencies in blood flow through the heart, or electrolyte disbalance. Fig.1 shows various leads of a sample ECG reading.
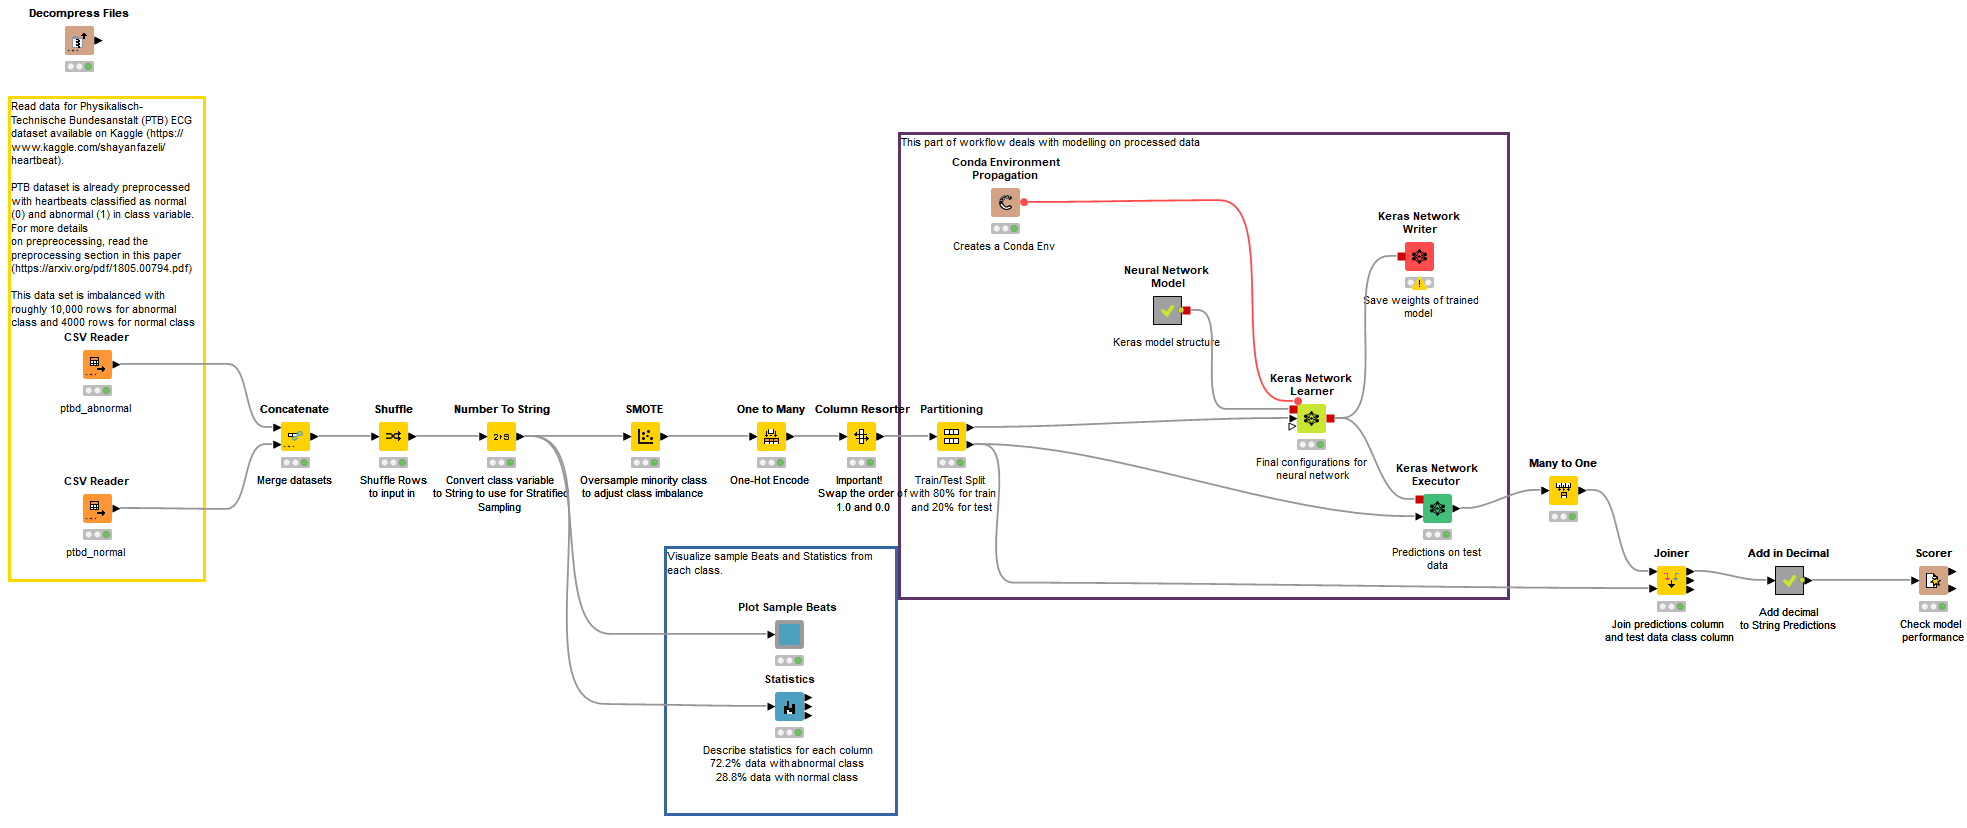
In this blog article, I'd like to give you a walkthrough of an example KNIME workflow that uses deep learning for Electrocardiogram (ECG) classification of normal and abnormal signals. The signals are sampled from Physionet’s ECG Database, which is contributed by Physikalisch-Technische Bundesanstalt (PTB). The preprocessed version of the dataset is available on Kaggle. For my example here, I used the files “ptbdb_abnormal.csv” and “ptbdb_normal.csv.”
Pre-processing of ECG signals
Before we dive further into the analysis, I will talk about the pre-processing techniques used by authors Mohammad Kachuee, Shayan Fazeli, and Majid Sarrafzadeh to provide complete consolidated CSV files. They applied an effective method for pre-processing signals and extracting beats from them.
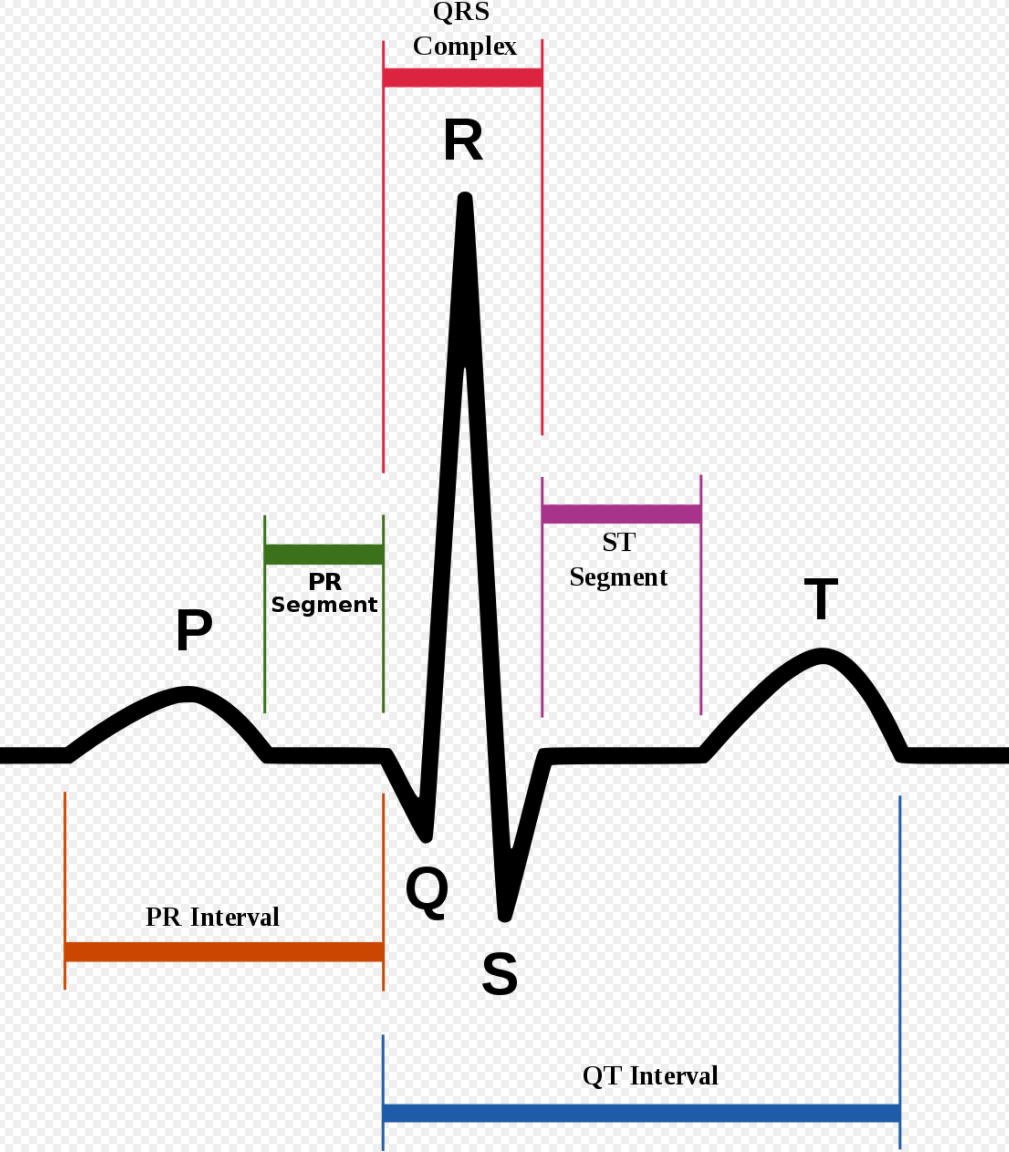
To begin, ECG signals are split into 10-second windows, and their amplitude values are normalized between 0 and 1. First derivative of zero-crossing is applied on each window to find local maximums. Then R-peaks are identified, and a median R-R time interval (T) is extracted for each window. The R peak is essentially the highest peak of an ECG signal. It is identified using wavelet transformation and is part of the QRS-complex, an oscillation corresponding to contraction and expansion of ventricles and atria, respectively (Fig.2).
For each R-peak, a signal of length 1.2T is selected and padded with zeros to produce a complete signal of fixed length. The sample data is visualized in Fig. 3.

There are two files of PTB ECG datasets provided by the authors. One contains abnormal readings with class variable 1 and is named “ptbdb_abnormal.csv,” and the other contains normal readings with class variable 0 and is named “ptbdb_normal.csv.” Each file has 188 columns; the last column is the class variable, and the rest represent the signal length, padded with zeros for fixed length. There are no missing values in each column. However, the dataset in total is imbalanced, where abnormal readings are 10,506 and normal readings are 4,046.
Exploratory Data Analysis
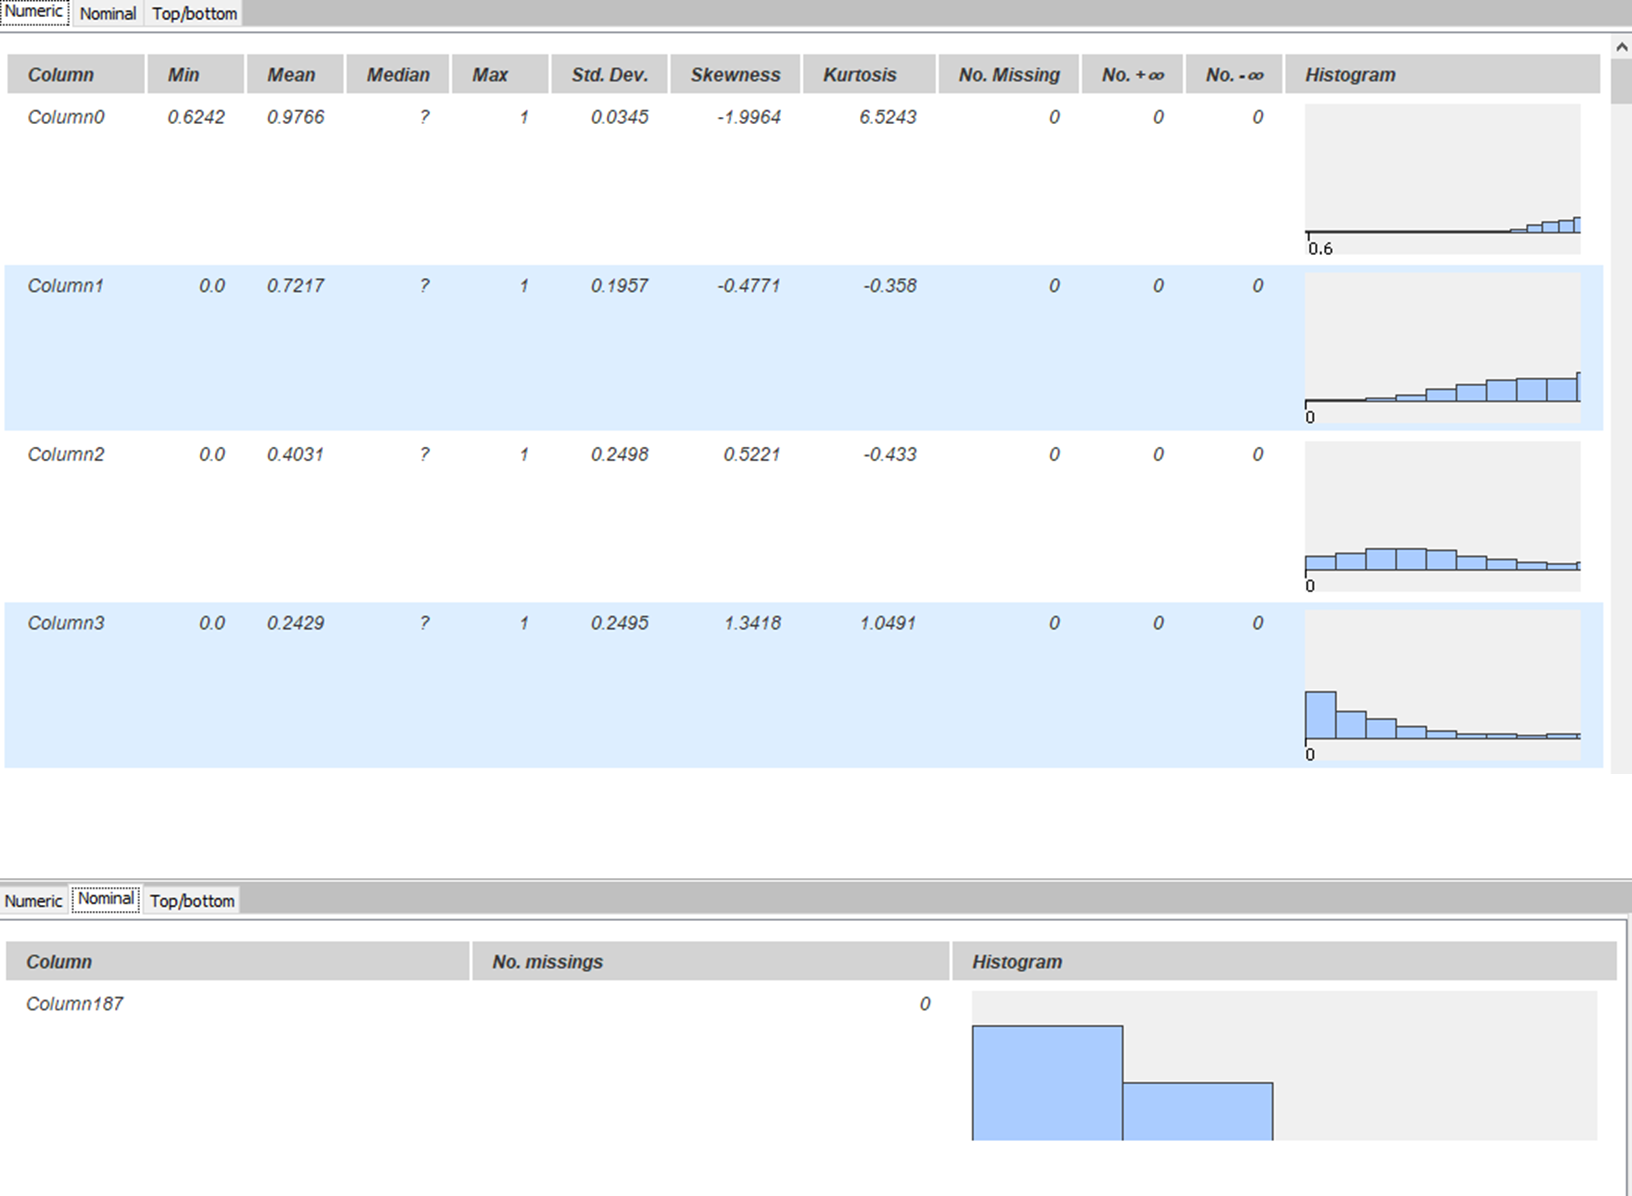
Both datasets were concatenated and shuffled into one table. KNIME provides a “Statistics” node in its KNIME Statistics Nodes extension. This node is used to describe each column and its respective characteristics. As seen in Fig. 4, it can be confirmed that there are no missing values in the table. Histograms in each row show the distribution of values in respective columns. Class imbalance is also visible in the bottom part of the figure.
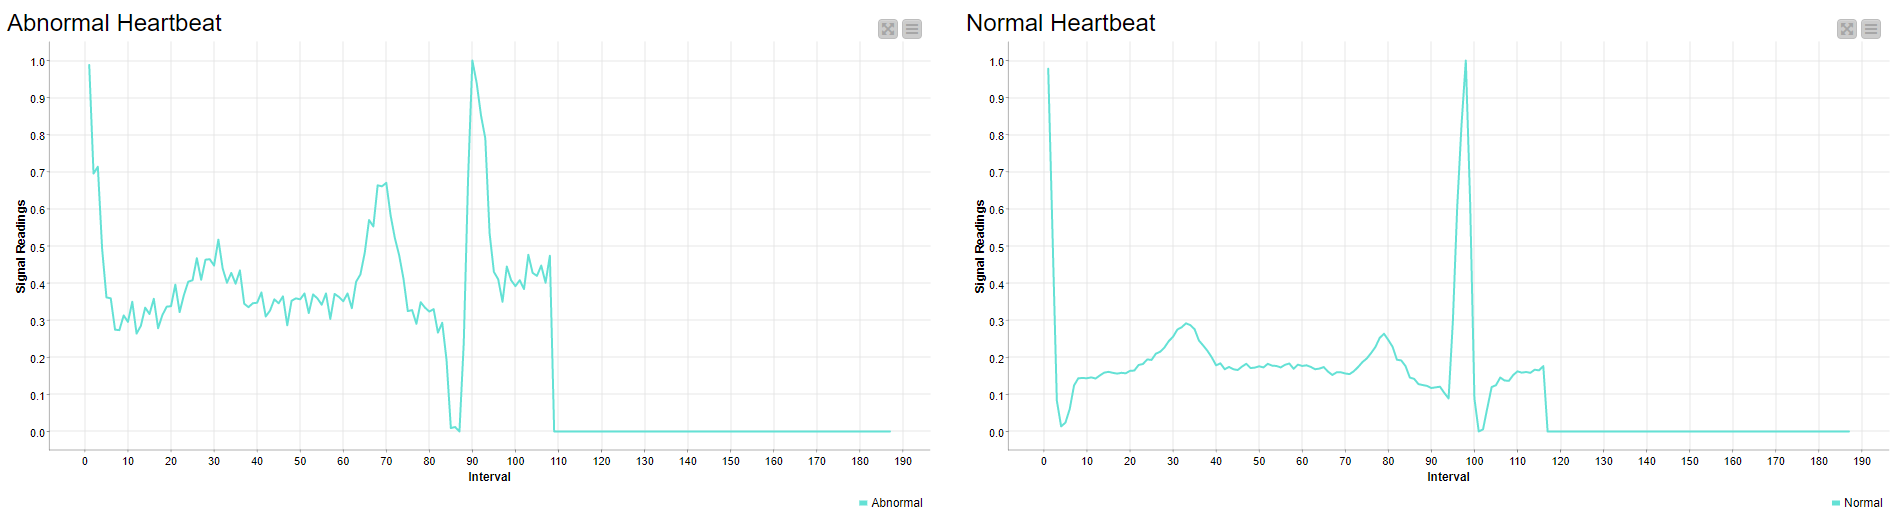
Two beats sampled from each class were also visualized in a line plot, one being the normal and the other the abnormal signal. The abnormal reading has very short peaks and highly fluctuates compared to the normal beat, which is relatively stable and smooth. (Fig. 5)
Modeling
As described in the research paper by the authors of this dataset, a 1-D Convolutional Neural Network (CNN) architecture is trained to classify ECG beats. The original architecture proposed is quite deep, and took almost two hours to train on an 8GB NVIDIA GPU. For this example, I used a small subset of the proposed architecture with three hidden stacks between input and output layer. The Neural Network was created using the KNIME Deep Learning - Keras Integration.
Deep Neural Network
The input layer had the size of (1, 187), representing the 187 columns and one-dimensional series, i.e. the time series as input and output of two units corresponding to each class.
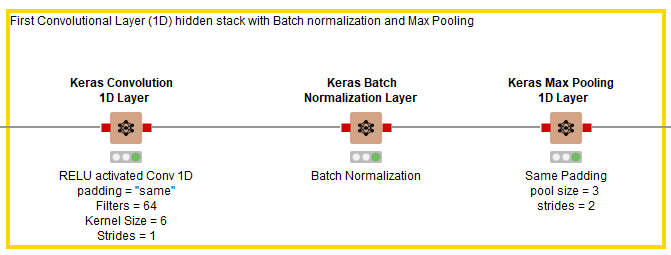
Hidden Stack 1
As shown in Fig. 6, after the input layer, three hidden layers are added in the first stack. The first layer is a Keras Conv1D Layer using RELU as its activation function, 64 filters, a kernel size of 6, strides of 1, and padding set to “same.” It is followed by a Keras Batch Normalization Layer node to speed up the training process, then a Keras Max Pooling Layer with pool size of 3 and strides of 2.
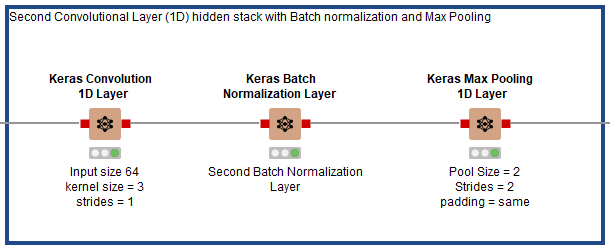
Hidden Stack 2
As shown in Fig. 7, after the first hidden stack in Fig. 6, three hidden layers are added in the second stack. The first layer is a Keras Conv1D Layer using RELU as its activation function, 64 filters, a kernel size of 3, strides of 1, and padding set to “same.” It is followed by a Keras Batch Normalization Layer node, then a Keras Max Pooling Layer with pool size of 3 and strides of 2.
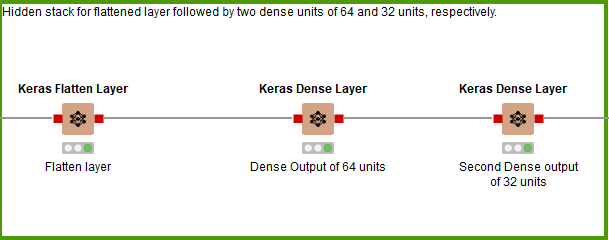
Hidden Stack 3
For the third and final hidden stack (Fig. 8), no more 1D Convolutional Layers are added. Instead it’s a flattened layer, followed by a Dense Layer of 64 units, then a Dense Layer of 32 units before the output layer.
Model Training
Before I describe the training process, know that data in KNIME was slightly preprocessed. This includes adjusting class imbalance by oversampling minority class. After that, the class variable was one hot encoded for the model, and the data was partitioned into 80% for training and 20% for testing.
The Keras Network Learner node is used to train the model. Since we have a binary classification problem, the loss measure used is “Binary Crossentropy.” The model was trained for a total of 10 epochs with an Adam optimizer with relevant parameters, as shown in Fig. 9. The entire training process took 1 minute and 22 seconds.

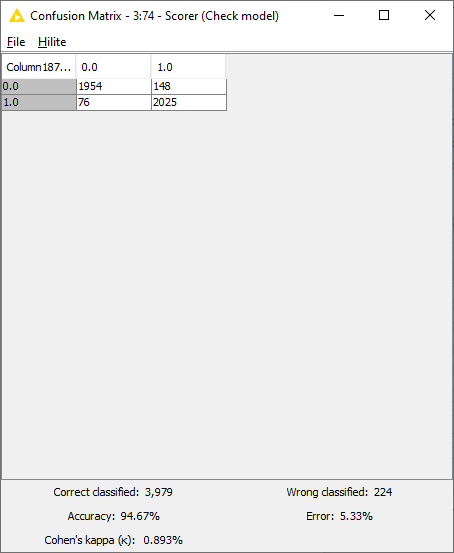
Model Scoring
Predictions were made using the Keras Executor Node. Predictions with maximum probability with respect to each class were picked using the “Many to One” node. Finally the model performance was evaluated using the “Scorer” node. As seen in Fig. 10, the model performed with the accuracy of 94.7%, with 3,979 rows correctly identified and 224 rows incorrectly identified.
ECG Classification with KNIME
ECG classification was performed using a Deep Neural Network composed of 1-Dimensional Convolutional Layers, along with Batch Normalization Layers and Max Pooling Layers. The data provided was picked from Kaggle, and was already pre-processed by the authors, so not much needed to be done in that area. The complete workflow can be found on the KNIME Hub in our public Digital Health space. The workflow group comprising the PTB classification on KNIME Hub is “ECG PTB and MIT-BIH Data Analysis & Modeling.” Fig. 11 shows the main workflow of the ECG classification using PTB dataset.
This part of our analysis catered to the binary classification problem of normal and abnormal beats. In the next part, I will discuss multiclass classification of a different ECG dataset which detects arrhythmia.