
Note that these components are built by and for the community. They have not been officially verified by the KNIME team.
Welcome to our seasonal review of community components! The KNIME community is sharing more components on KNIME Hub every day. Check the current components ranking on KNIME Hub and don’t forget to add your likes – when you look up components on the KNIME Hub, you'll see they are now ranked by likes.
What is a KNIME Component? Well, it is basically a KNIME node built directly in KNIME Analytics Platform with more nodes: no coding required unless you want to! Components are the best and easiest way for KNIME users to share functionalities with more users!
To learn more about how to build components, here are a few useful links:
- Component Building Cheat Sheet offers you a graphical overview of all the KNIME features you need, plus a few examples!
- Component Building Documentation shows a practical how-to guide which goes in more detail.
- Best Practices for Component Building offers insightful tips and tricks when building components that are reliable and reusable just like actual KNIME nodes!
Let's now look at the collection of components built by community members we scouted for this season. Don’t forget to drop a like on the KNIME Hub.
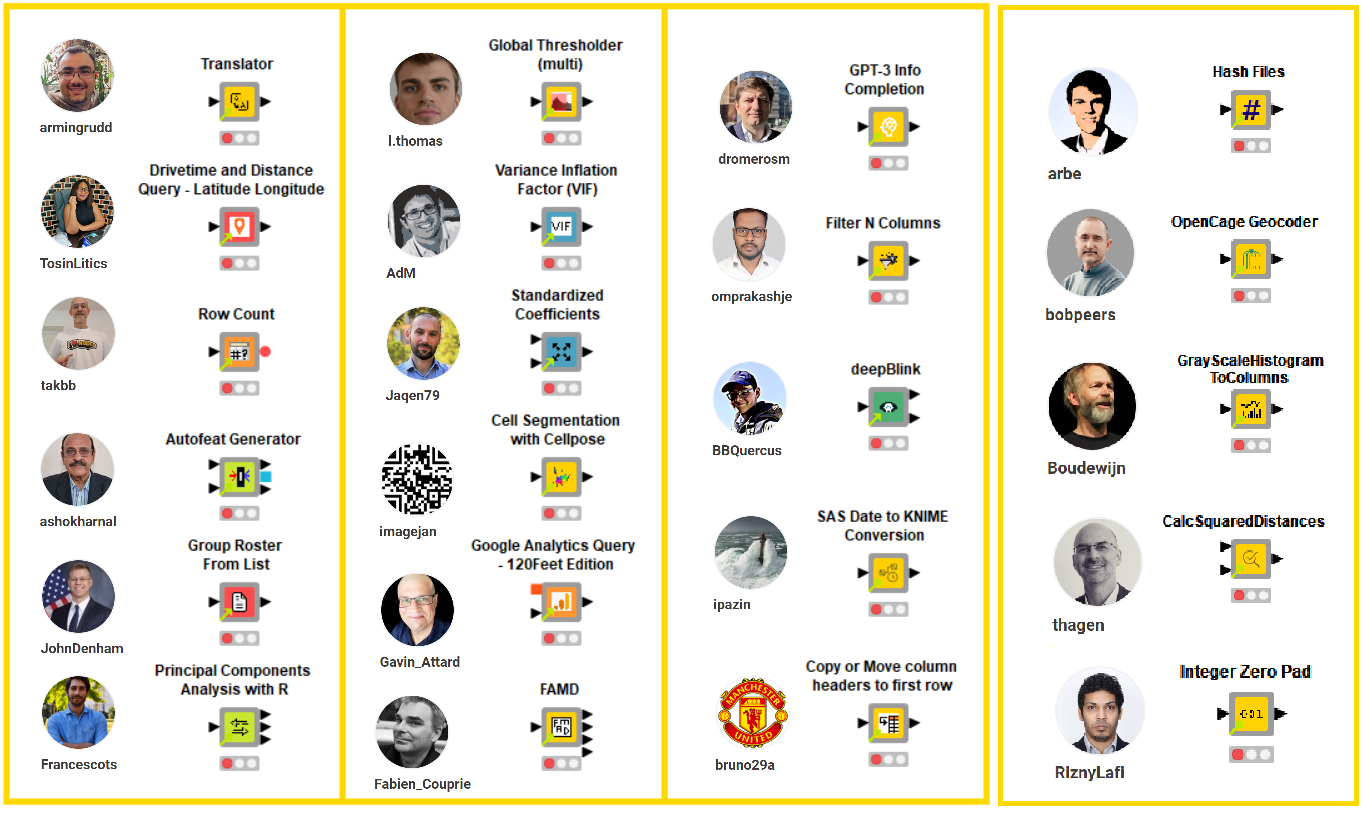
Hash Files by Arne Beckhaus
Arne (@arbe) built the Hash Files component to apply a cryptographic hash function on a list of files via a Java Snippet node. The components takes as input a list of file paths and generates unique fingerprints, taking into account the content in bytes inside each file. Consider using this component to differentiate unique files from duplicates and to safely store them using encrypted unique ids as file names.
Arne provided us with two example workflows: the Find Duplicate Files in Folder workflow, which shows how to load a list of files from a local folder to find duplicates, while the Write and Find Duplicate Files workflow shows how to test the component generating .txt files before applying the component.
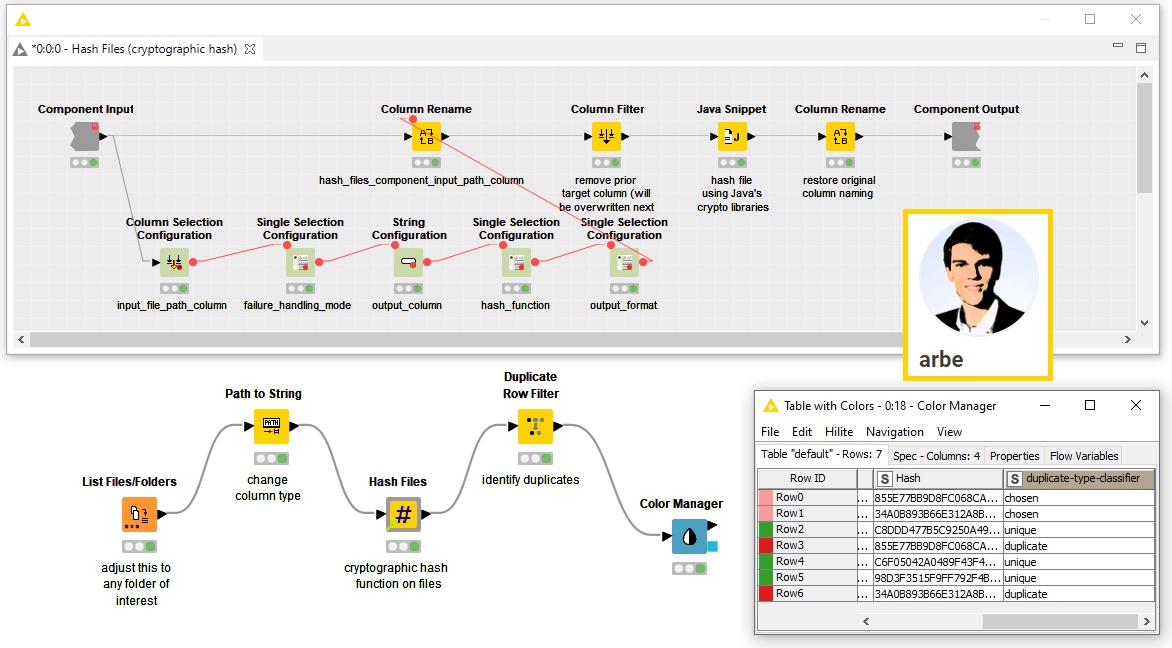
GrayScaleHistogramToColumns by Boudewijn van Langerak
Boudewijn (@boudewijn) built the GrayScaleHistogramToColumns component to analyze microscopy images and generate gray-scale image histograms, a graphic representation of images tonal distribution.
To achieve this Boudewijn adopted the KNIME Image Processing Extension to convert the image into black and white, then he nested the HistogramToColumns component (another component he has built). The nested component adopts a Java Snippet node to convert the image to values to be then visualized via the Histogram node. Have a look at a simple example workflow to see this component in action, or download a more complex workflow where both components are adopted to perform Color Deconvolution with the ImageJ Integration.
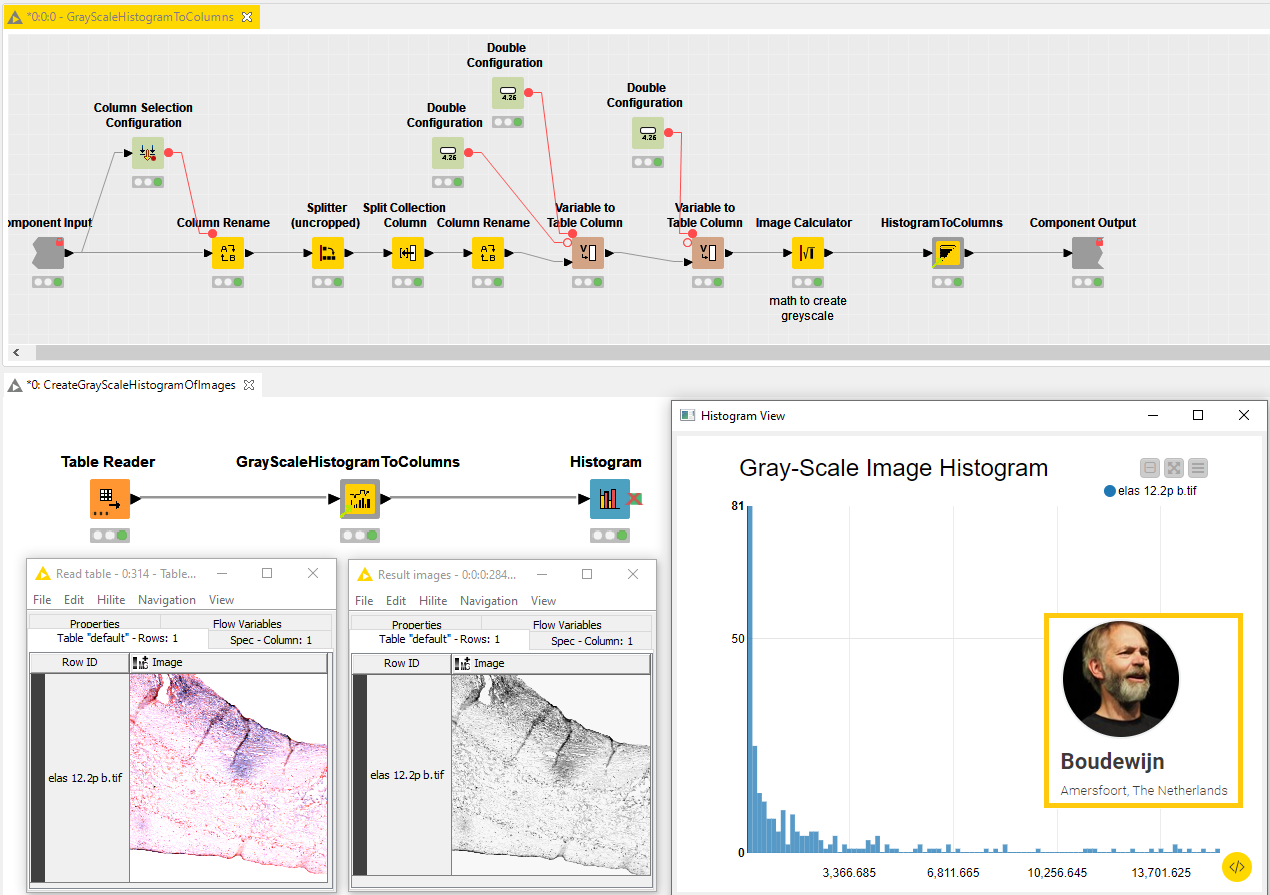
OpenCage Geocoder by Bob Peers
Bob (@bobpeers) built the OpenCage Geocoder component to query an API service via a GET Request node with names of locations and receive in return GPS coordinates. Geocoding is useful to enrich any dataset where addresses can be converted to numerical latitude and longitude values.
Use this component to visualize locations on a geographical map – via the verified component Dot Map – as shown in this example workflow provided by Bob. Note that to execute the component you need to sign up on the Open Cage Data website. By starting a free trial you can get up to 2,500 requests/day! Read more about this in Bob’s blog article in the Low Code Journal for Advanced Data Science.
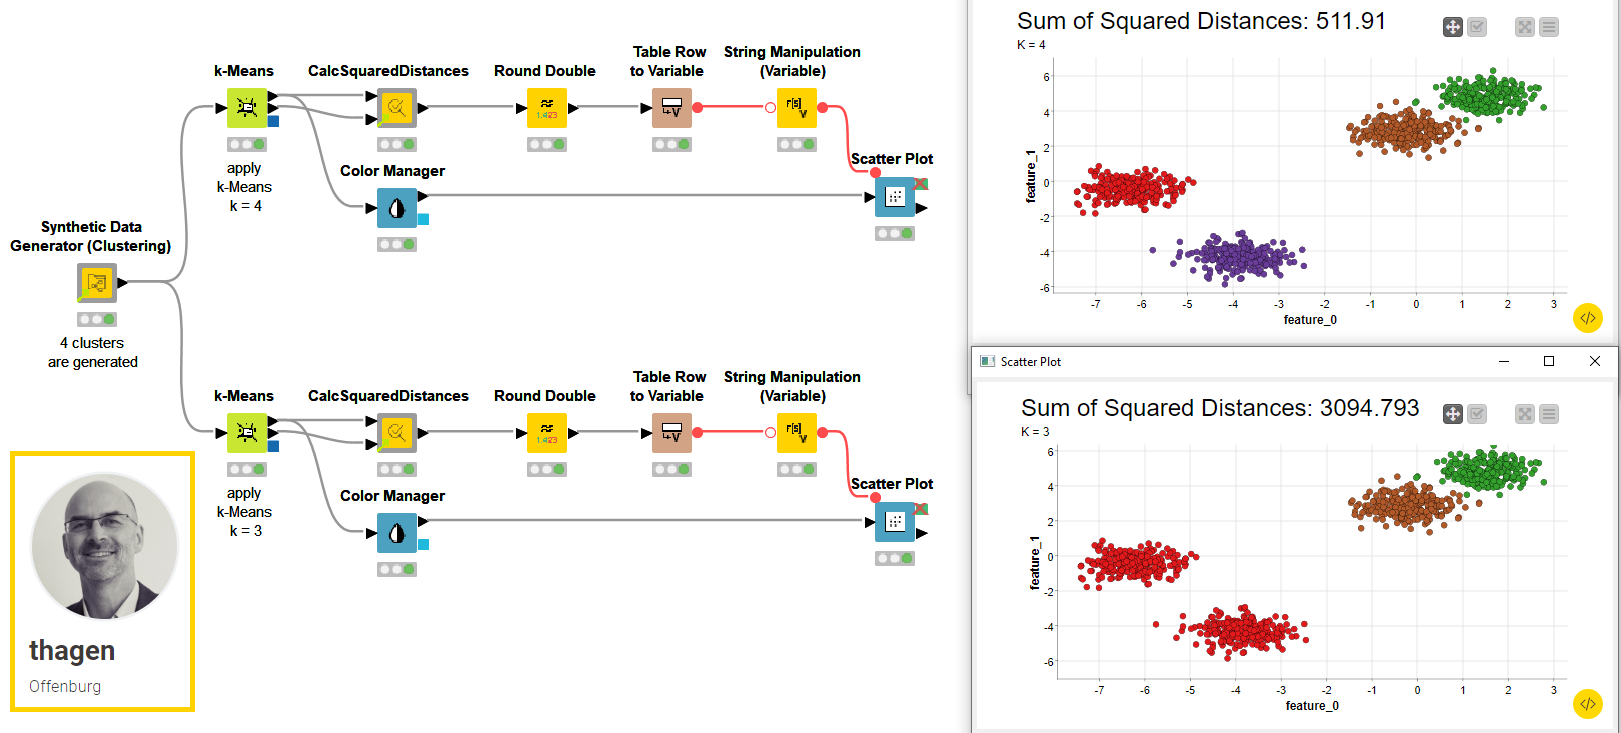
CalcSquaredDistances by Tobias Hagen
Tobias (@thagen) built the CalcSquaredDistances component to measure the performance of a clustering model trained with the k-means algorithm. Connect both outputs of the k-means node to the component inputs to score the proposed performance metric on the model.
To achieve this, the component is measuring the squared distance from each labeled data point to the center of its cluster via a Java Snippet node. The component then sums all these distances and outputs the value. You can use this output to compare different k-means models trained on the same data sample. The smaller the output value, the less spread out the clusters are, the better the model. The component can be adopted to optimize the parameter k of the clustering algorithm, as Tobias shows in an example workflow with a Parameter Optimization Loop. The example below shows instead how to compare two k-means models manually.
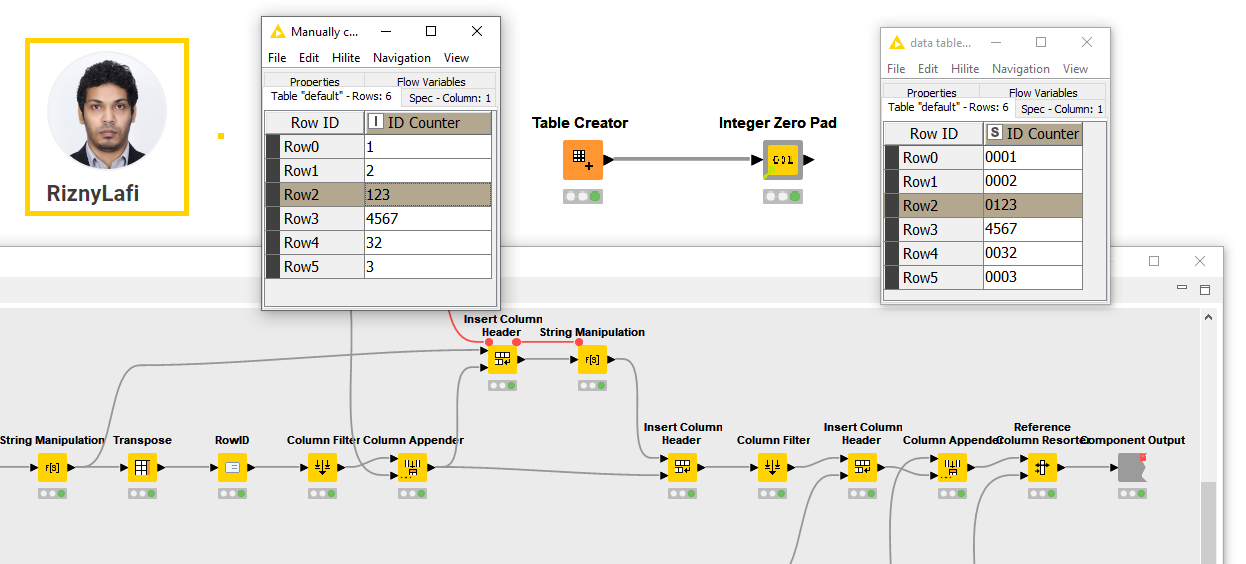
Integer Zero Pad by Rizny Lafi
Rizny (@riznylafi) built the Integer Zero Pad component to flexibly apply zero padding to a single Number (integer) column and convert it to a String column. The component can flexibly add the right amount of zeros to each cell, based on provided settings. This technique can be used to easily style an integer column that represents an id or rank, or for some complex techniques where data needs to be encoded in some special way. Check the example workflow we built to automatically configure the component on the maximum number of digits in the input column.
More Community Components Coming!
We hope you enjoyed the Community Components Summer 2022 Collection! We are planning another collection of community components for this Fall. Do you have a component on KNIME Hub that you would like to see referenced in the next collection? Send an email to upskilling@knime.com.