
Since proteins are important for cell metabolism, identifying the levels of potentially modified proteins is a common task in medical bioinformatics and its subfield of proteomics. Most often, the goal is to find changes in the proteome that are associated with a disease or a treatment. Relative differences in protein levels hint at certain signaling pathways, which are disturbed in cancers. In drug development, relative protein quantification helps in validating the effect of a drug on the protein target. In this, as well as in a future article, we will step-wise propose a KNIME workflow for protein identification and quantification from mass spectrometry analysis where we analyze a reference dataset with known concentrations of proteins.
Mass spectrometry (MS) is an analytical technique that is able to simultaneously capture the sequences and quantities of proteins expressed in a cell in a high-throughput fashion. A mass spectrometer ionizes molecules to infer their mass based on their behavior in an electric or magnetic field. It outputs so-called mass spectra—a set of mass-to-intensity pairs, essentially looking like haystacks and often represented in needle plots.
Due to complex signals of intact proteins, researchers often resort to measuring pieces of proteins (i.e. peptides) through pre-MS-digestion. Even among those smaller molecules, many of them have the same mass and can barely be distinguished in a mass spectrometer alone. Thus, for proteomics, a mass spectrometer is almost always coupled to a liquid chromatography column such that peptides with different physicochemical properties but potentially the same mass are measured at different time points.
In this blog post, we focus on the identification of protein sequences through database search by comparing in-silico generated theoretical spectra from a protein database against the measured ones. In a follow-up blog post, we will then focus on their relative quantification.
The OpenMS KNIME plugin
To analyze mass spectrometry data in KNIME, there are at least three options:
- Write R or python scripts with your favorite MS package
- Call your beloved command-line tool with the External Tool node
- Use the nodes provided by the OpenMS KNIME plugin (find it on the KNIME Hub here) with additional documentation here.
The advantage of using the nodes provided by the OpenMS KNIME plugin is their almost native integration into KNIME through dozens of nodes that call efficient C++ tools. This includes a configuration dialogue to manually edit the settings or pass flow variables, easy installation, updating and sharing via the KNIME community update site, and exporting nodes to convert the usually XML-based MS data into KNIME tables.
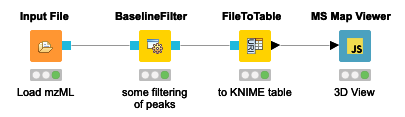
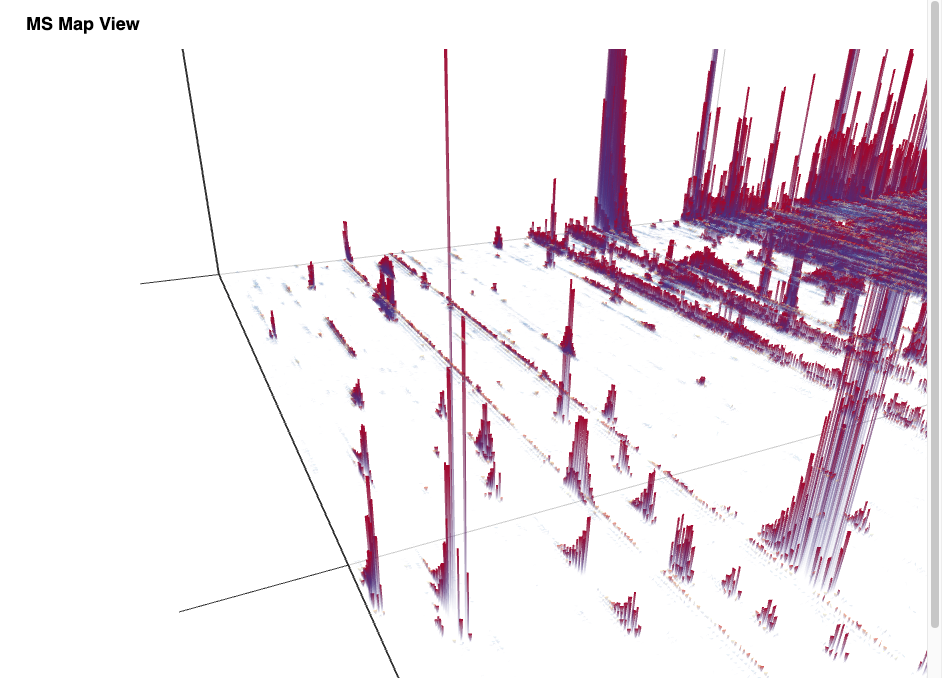
The simple workflow in Figure 1 allows one to visualize the stacked mass spectra from a seemingly cryptic mzML format in an interactive 3D View (Figure 2) in just one step in KNIME. This gives us a first glimpse of the data. However, for efficiency, it is advised to process data through file ports or file cells for as long as possible as it can be compressed and only the parts needed for a certain step loaded into memory. In general, the visualization of millions of data points is a demanding task and therefore should be used on specific regions of interest by applying filter nodes first.
Peptide Identification
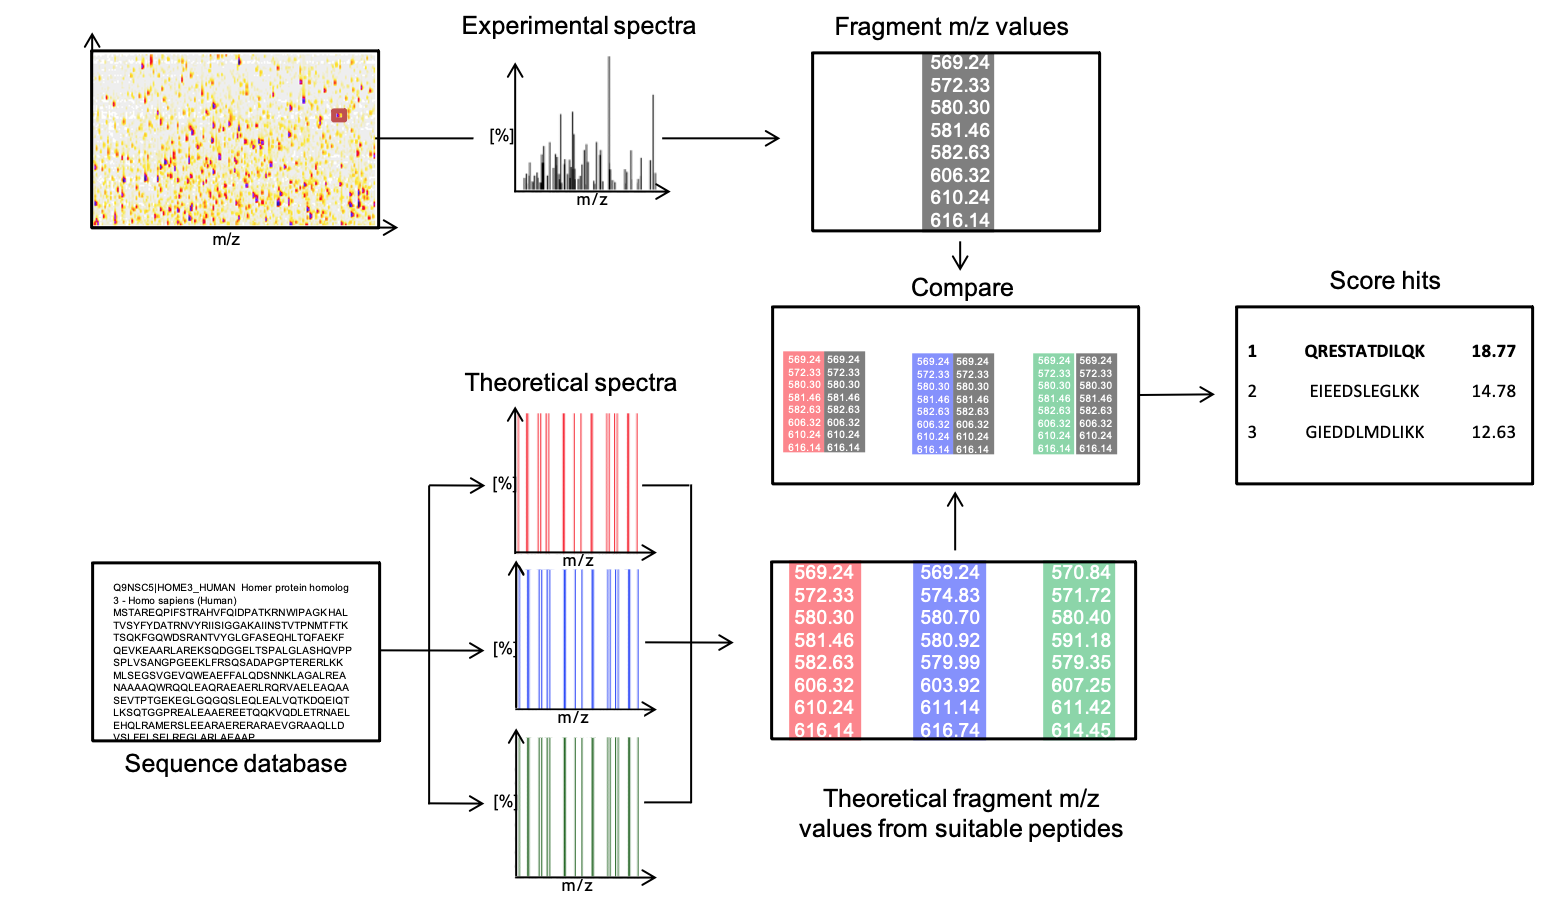
After the mass of a peptide has been measured, we are usually interested in its sequence. For this, a few times per second, additional rounds of MS measurements are performed that result in the mass spectra of fragments.
One of several established methods to reconstruct the amino acid sequence from such a fragment mass spectrum is database search. Thereby, fragment spectra are compared against a set of expected theoretical spectra from an artificially digested protein database (Figure 3).
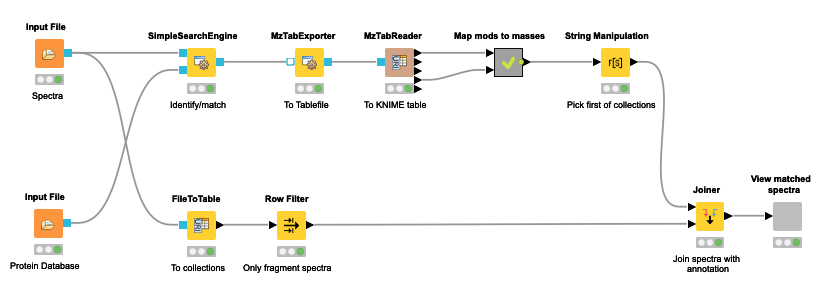
The OpenMS nodes in KNIME support this through their search engine adapters or their own SimpleSearchEngine as shown in the following mini-workflow on Figure 4 which is available on the KNIME Hub.
The resulting view (Figure 5) allows browsing through the best match for each spectrum and allows the manual inspection of the quality of the match.
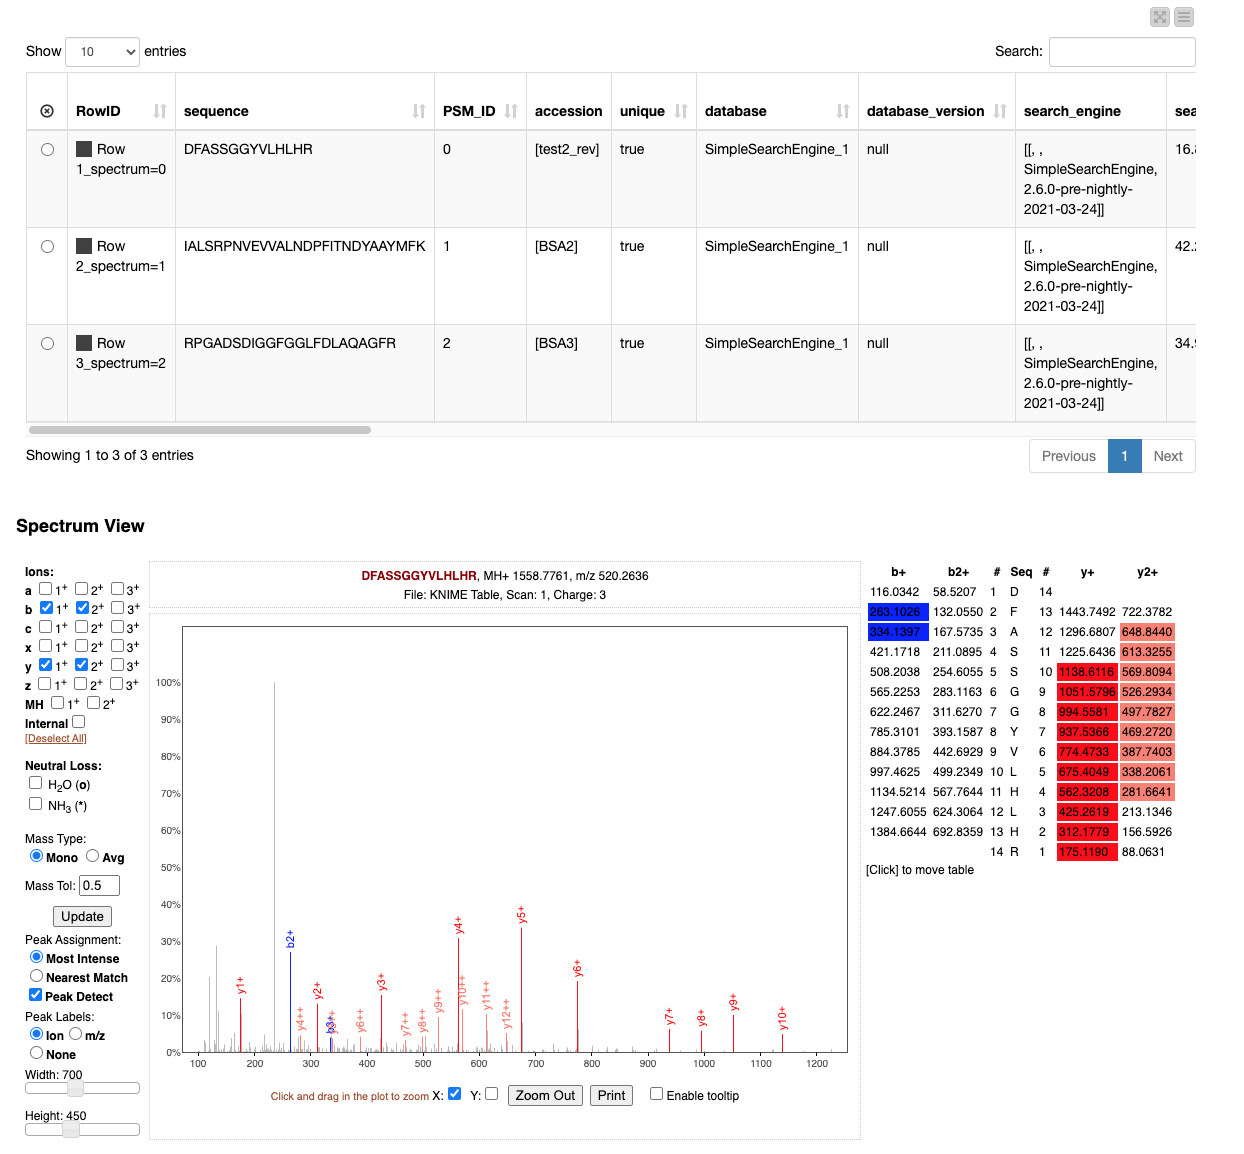
For example, when testing out the workflow, try to identify the large unidentified and therefore grey peak by considering e.g. more rare ion types on the left-hand side of the “Spectrum View” frame in the Interactive View of the “View matched spectra” component.
Re-scoring and confidence estimation
Scoring theoretical spectra from a database against observed spectra is an error-prone algorithmic technique due to incomplete matches, chimeric spectra (with fragments of multiple peptides), unknown modifications, or an erroneous or incomplete candidate database. In most cases, database search reports at least one result for a spectrum, even if the peptide in question was not in the database. Therefore one should
- use additional orthogonal features of a peptide-spectrum match to improve their ranking and
- estimate the confidence of a match or a set of chosen matches (even among the best hits).
For both, it is handy to look at the distribution of scores and other features for matches against known false sequences, so-called decoys. The first step helps in the discrimination of false matches from true matches against the real, so-called target sequences. The second step helps in estimating a false discovery rate among the top matches that we want to report. Decoys are either provided in the input database or can be generated and appended on the fly, usually one for each original protein by e.g. reversing the sequences of its peptides.
Multiple database search engines
Since peptide database search is such a fundamental problem in MS-based proteomics, many different algorithms and tools have been developed. Each with a more or less different approach and a unique scoring system. Therefore the predictions of the best matches for each spectrum may be complemented by using multiple search engines and building a consensus. One such consensus approach is implemented in the ConsensusID node. For this to work, however, scores need to be comparable across search engines and re-scoring needs to be performed first.
To ease the usage of multiple search engines in proteomics, we have developed a set of KNIME components that wrap the most important parameters in each step as well as the internal if-else logic. A full identification workflow can be found on the KNIME Hub with some exemplary visualizations to evaluate the agreement of different search engines on the fragment spectra in the input dataset. In the included dataset (a measured protein sample of bovine serum albumin) we are looking for peptides from the protein with the accession P02769|ALBU_BOVIN.

Investigate and Compare Protein Content Yourself
That's it for today. We showed that you can actually find the needle in the haystack aka identify peptides from fragment mass spectra based on a protein database with KNIME! This enables us to directly investigate and compare the protein content of a cell in a qualitative way.
Feel free to play around with the demo workflows. All the workflows mentioned in this article can be downloaded from the openms-team space on the KNIME Hub. Some things to try:
- Look at the distribution of real/target peptides vs. fake/decoy peptides. If targets do not have a bump at good scores, you will have a hard time reliably distinguish true positives from false positives. This might indicate bad tolerance settings or wrong/missing modifications.
- Try to adapt the workflow to investigate agreement not only for the top hit but for e.g. the top 5 of each search engine (start by changing the top_hits parameter of the Search Engine Combination component).
- Inspect the results in an external viewer like TOPPView.
- Have a look at another workflow that tries to achieve a similar task but with sequencing data of RNA transcripts.
Stay tuned for a second part of this blog post where we try to combine identification and quantification to find significantly deregulated proteins in more complex mass-spectrometry experiments.