In this blog series we experiment with the most interesting blends of data and tools. Whether it’s mixing traditional sources with modern data lakes, open-source devops on the cloud with protected internal legacy tools, SQL with noSQL, web-wisdom-of-the-crowd with in-house handwritten notes, or IoT sensor data with idle chatting, we’re curious to find out: will they blend? Want to find out what happens when IBM Watson meets Google News, Hadoop Hive meets Excel, R meets Python, or MS Word meets MongoDB?
An Automotive Challenge: How's the Engine Doing?
In today’s challenge we are driving around the automotive world, experimenting with measurement data. Our new engine is undergoing tests and we want to compare its performances with the temperature reached. A very sophisticated and standardized sensor measures the speed of the motor and the turbine, producing an MDF file with the measurements. At the same time, another sensor keeps track of the temperature publishing those values on a Kafka Topic. How can we merge and compare these different data?
Introducing MDF and Apache Kafka
MDF
MDF was originally developed as a proprietary format for the automotive industry. Thanks to its stability and versatility, in 2009 a new ASAM working group released the first standardised version of the ASAM MDF file format, since then adopted as standard de facto in the field of measurement and calibration. It allows easy store and read measurements data and the related meta information.
Apache Kafka
Apache Kafka is an open source streaming platform able to deal with real time data feeds. Many sensor devices (called Producer) can be configured to publish their measurement data regarding a certain Topic to a Kafka Cluster. The data will then be read by the Consumers subscribed to that topic. If you are interested, here is a complete overview of the Kafka world.
In an ideal world...
...all our devices would speak the same language and be able to communicate with each other. But if you have ever worked with raw sensor data you would probably know that this is not the case: different sampling rates, data formats, ranges, units of measurement… There are many differences within the data that can make this process tricky and unfunny.
Luckily, with KNIME Analytics Platform this becomes a child’s play!
Topic. Analyze automotive related sensor data
Challenge. Blend sensor measurements in MDF file format and from a Kafka Cluster
Access Mode. KNIME MDF Integration and KNIME Extension for Apache Kafka (Preview)
The Experiment
First, let’s focus on the MDF measurements. In order to read the sample.mdf file attached to the workflow, we use the new MDF Reader node. The node comes with the KNIME MDF Integration that you can download from the KNIME Hub.
This node is based on the asammdf Python library, therefore you will need to set up the KNIME Python Integration. Refer to the KNIME Python Integration Installation Guide for more details.
The MDF Reader node offers a variety of settings to deal with the MDF file format:
- In the option tab of the configuration window, select the MDF file (you can use absolute or relative path)
- In the Channel Selection menu mark the channels that you want to focus on.
In this example we will read both channels available. MDF file is organized in binary blocks, and a channel is a binary block that stores information about the measured signal and how the signal values are stored. Another important binary block is the data block that contains the signal values.
Move to the Advanced Settings tab and explore further options:
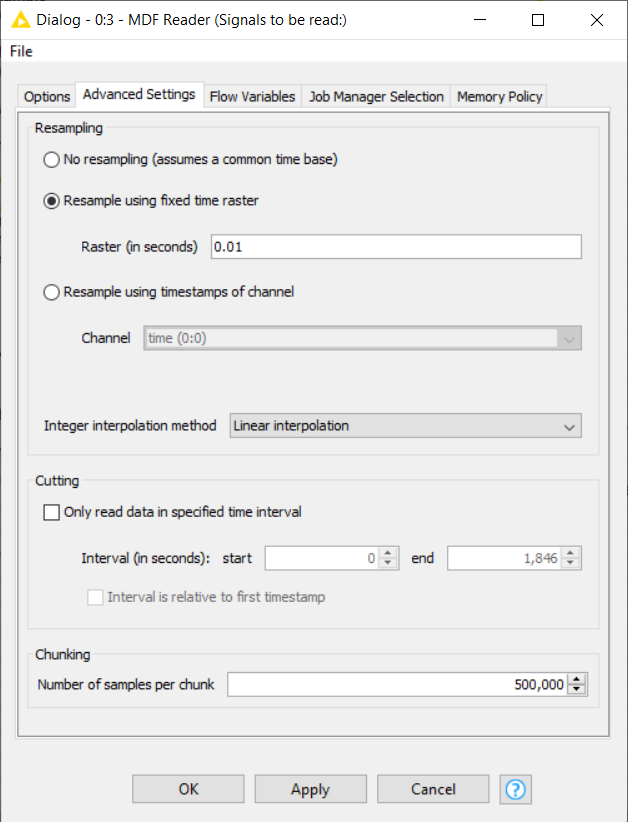
- Resampling: measurements from different channels might not have the same sampling rates and offset. This option will do the resampling for us. You can choose the interpolation method - linear or previous value - and the channel’s timestamp on which the resampling will be performed. Otherwise you can define your own sampling rate. The temperature data that we are going to read later are sampled every 0.01 seconds. Therefore let’s configure the MDF node to resample at this specific interval as shown in Figure 1.
- Cutting: only data within the specified time interval will be read.
- Chunking: only read the specified amount of measurements. This is useful when the file does not completely fit into the main memory.
The second part of our measurements - regarding the temperature of the engine - are sent by the sensor to a Kafka Cluster. KNIME Analytics Platform supports this technology thanks to the KNIME Extension for Apache Kafka (Preview). The Kafka Connector node will establish a connection with the Kafka Cluster.
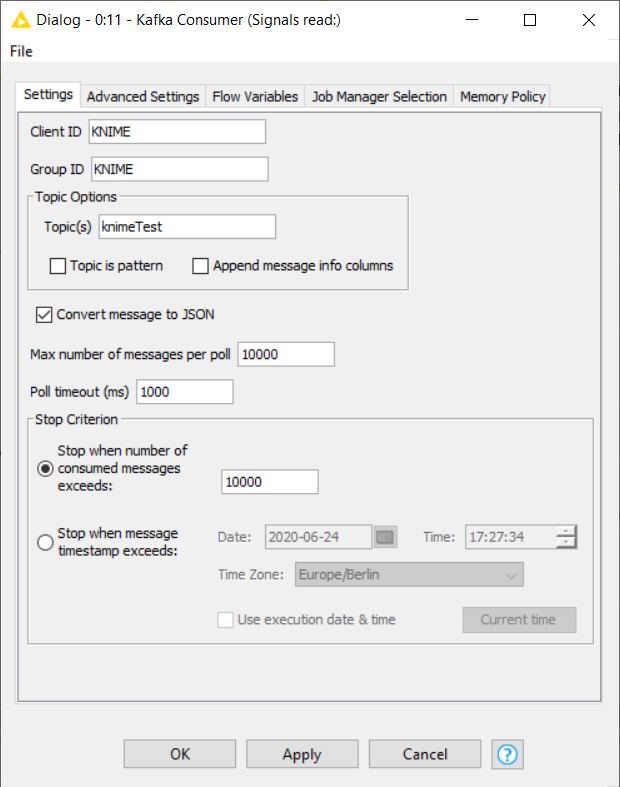
Let’s append a Kafka Consumer node to read the data published to the topic “knimeTest” as shown in Figure 2. This node is also configurable to read a maximum number of entries (Kafka calls them messages) or stop reading at a custom time.
Note. The temperature data provided with this workflow have been synthetically generated.
As previously mentioned, these temperature measurements have been recorded at intervals of 0.01 seconds. Since the time offsets match and the MDF Reader node has already performed the resampling of the data...we are ready to blend!
Blending MDF Data with Data from a Kafka Cluster
The Joiner node in the workflow in Figure 3 will merge the data from the two sources according to the time offset value. Please note that because of the resampling, we don’t have the exact measurement value for each timestamp but its approximation generated by linear interpolation.
- You can download the MDF Meets Apache Kafka workflow from the KNIME Hub.
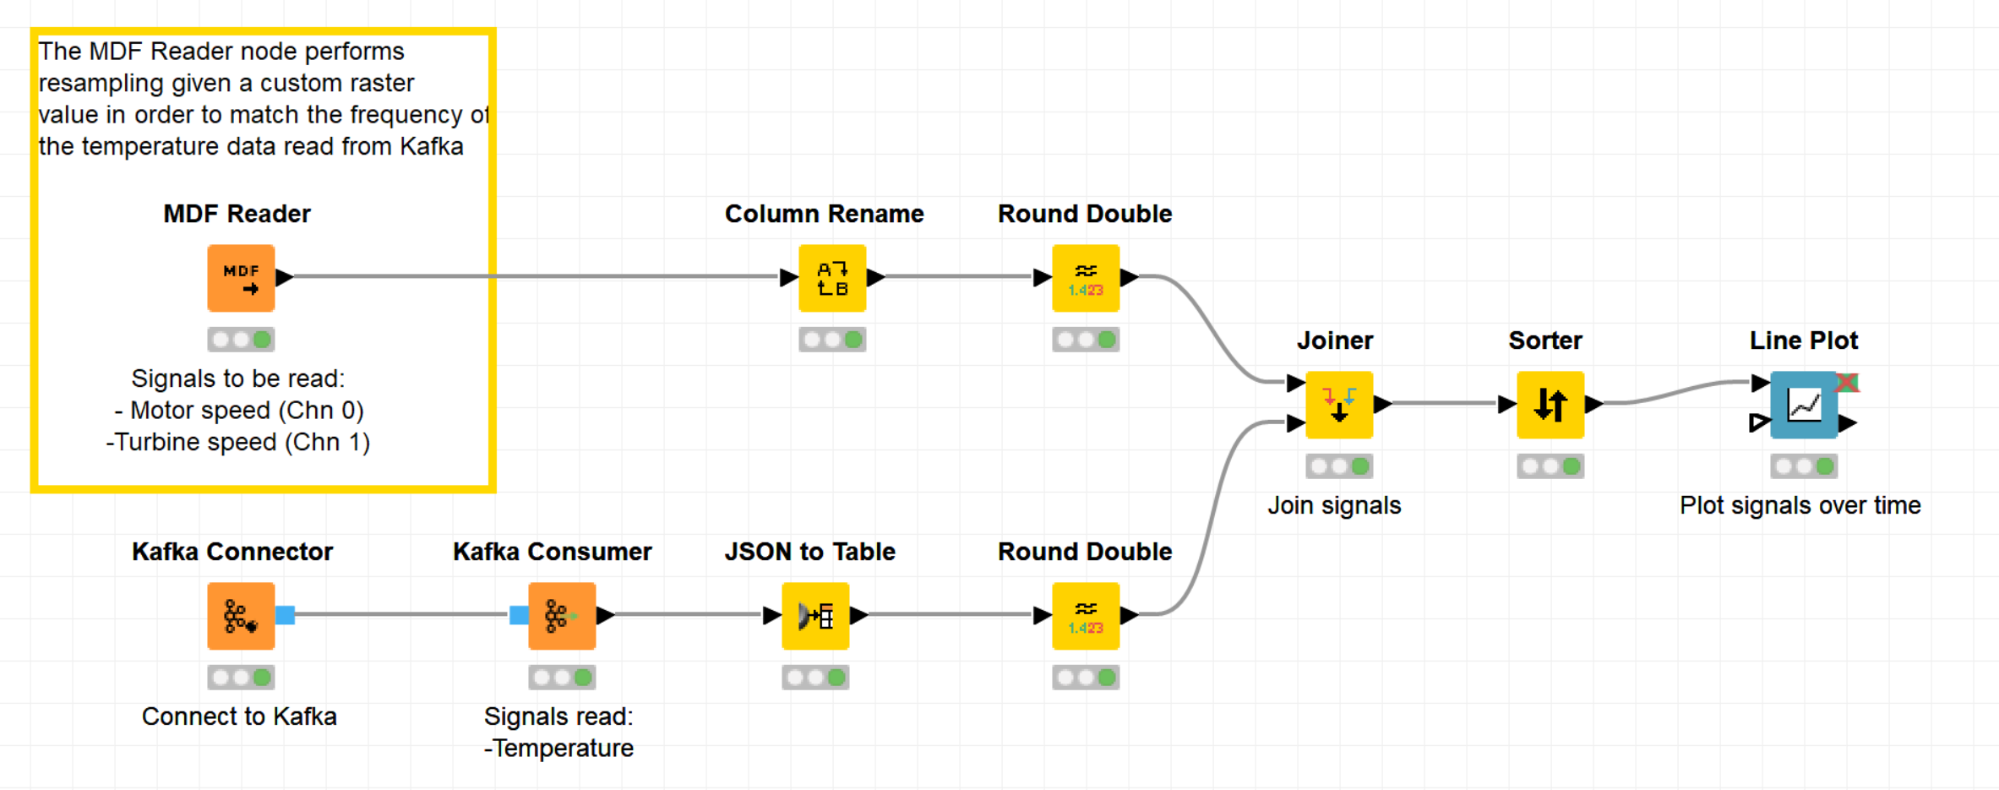
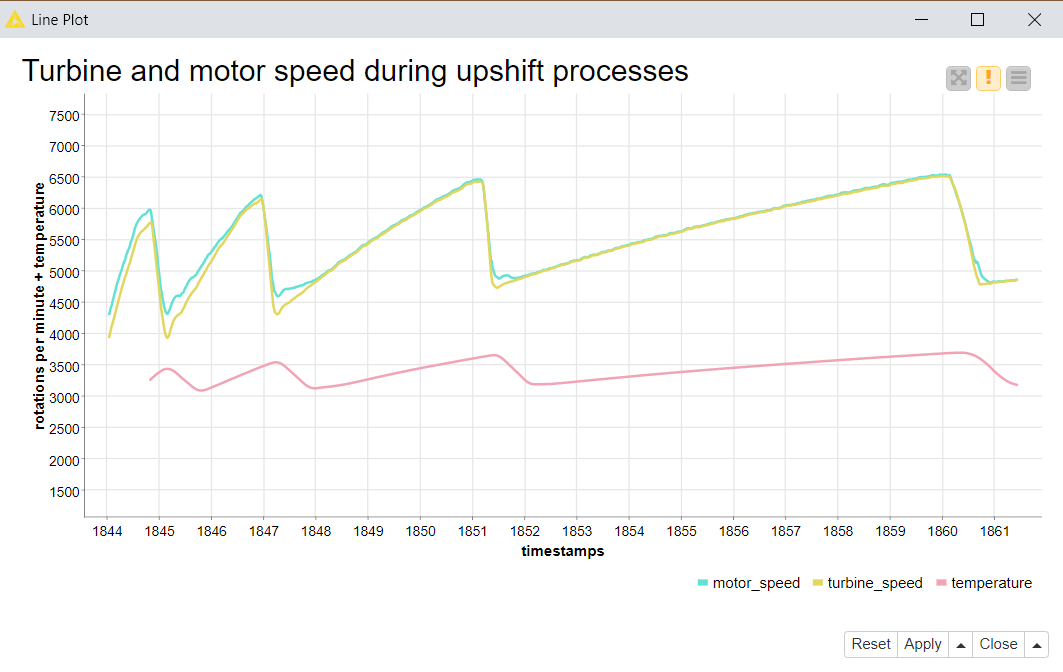
Figure 4 shows the Line Plot of the measurements. The green and yellow lines above with more fluctuation show the motor and turbine speed. The red line below shows slight increments of the temperature after the phases of higher motor/turbine speed.
The Results
Yes, they blend!
We navigated the block structure of an MDF file and the different pieces of the Kafka Cluster using the dedicated nodes for these two data sources, and ended up with sensor measurements in a KNIME table representation. Our result tables contain time offsets values and the corresponding motor/turbine speed values, as well as the temperature values - easy to blend, visualize, and compare in KNIME.