
In this blog series we’ll be experimenting with the most interesting blends of data and tools. Whether it’s mixing traditional sources with modern data lakes, open-source devops on the cloud with protected internal legacy tools, SQL with noSQL, web-wisdom-of-the-crowd with in-house handwritten notes, or IoT sensor data with idle chatting, we’re curious to find out: will they blend? Want to find out what happens when IBM Watson meets Google News, Hadoop Hive meets Excel, R meets Python, or MS Word meets MongoDB?
Follow us here and send us your ideas for the next data blending challenge you’d like to see at willtheyblend@knime.com.
Today: Open Street Maps (OSM) meets CSV Files and Google Geocoding API
The Challenge
Today’s challenge is a geographical one. Do you know which cities are the most populated cities in the world? Do you know where they are? China? USA? By way of contrast, do you know which cities are the smallest cities in the world?
Today we want to show you where you can find the largest and the smallest cities in the world by population on a map. While there is general agreement from trustworthy sources on the web about which are the most populated cities, agreement becomes sparser when looking for the smallest cities in the world. There is general agreement though about which ones are the smallest capitals in the world.
We collected data for the 125 world’s largest cities in a CSV text file and data for the 10 smallest capitals of equally small and beautiful countries in another CSV text file. Data includes city name, country, size in squared kilometers, population number, and population density. The challenge of today is to localize such cities on a world map. Technically this means:
- To blend the city data from the CSV file with the city geo-coordinates from the Google Geocoding API into KNIME Analytics Platform
- Then to blend the ETL and machine learning from KNIME Analytics Platform with the geographical visualization of Open Street Maps.
Topic. Geo-localization of cities on a world map.
Challenge. Blend city data from CSV files and city geo-coordinates from Google Geocoding API and display them on a OSM world map.
Access Mode. CSV file and REST service for Google Geocoding API.
Integrated Tool. Open Street Maps (OSM) for data visualization.
The Experiment
- First we need to import the data about the top largest cities and top smallest capital cities from the respective CSV text files.
Data about the 10 smallest capitals in the world were collected from a website that collected data for "Top10" items: in our case, the Top 10 smallest towns! This website no longer exists, but you'll find the data included in the workflow. Data about the world’s largest cities were collected from http://www.citymayors.com/statistics/largest-cities-population-125.html and saved to a CSV file. Both CSV files are read using a File Reader node and resulting contents are concatenated together to form a single data table. - For each city we build the request to retrieve its latitude and longitude from the Google Geocoding REST API service. Google Geocoding REST API service is free and does not need any kind of authentication. The request will look something like this https://maps.googleapis.com/maps/api/geocode/json?address=City,Country
Where:
- maps.googleapis.com/maps/api/geocode/json is the REST service with JSON formatted output
- City is the city for which we want to extract longitude and latitude
- Country is the country where the city is located
The above request is saved as a template in a Constant Value Column node and appended to each city data row. Each request is then customized through a String Manipulation node. Here “City” and “Country” column values from the input data table replace “City” and “Country” placeholders in the template request.
- The request is sent to the Google API REST service through the GET Request node.
- The response is received back in JSON format and parsed with the help of a JSON Path node. At the output of the JSON Path node we find the original city data plus their latitude and longitude coordinates.
- After cleaning and defining a few graphical properties, such as color, shape, and size of the points to be displayed, city data are sent to an OSM Map View node. This node is part of the KNIME Open Street Map integration and displays points on a world map using their latitude and longitude coordinates.
Figure 1 shows the world map with the largest (blue squares) and smallest (red triangles) cities in the world. The dot sizes are proportional to the city populations.
The workflow implemented to blend the data from the original CSV files with the responses of the Google Geocoding API and to blend KNIME Analytics Platform and Open Street Map is shown in figure 2.
Figure 1. World Map showing the location of the largest (blue squares) and smallest (red triangles) cities in the world as generated by the KNIME Open Street Map Integration.
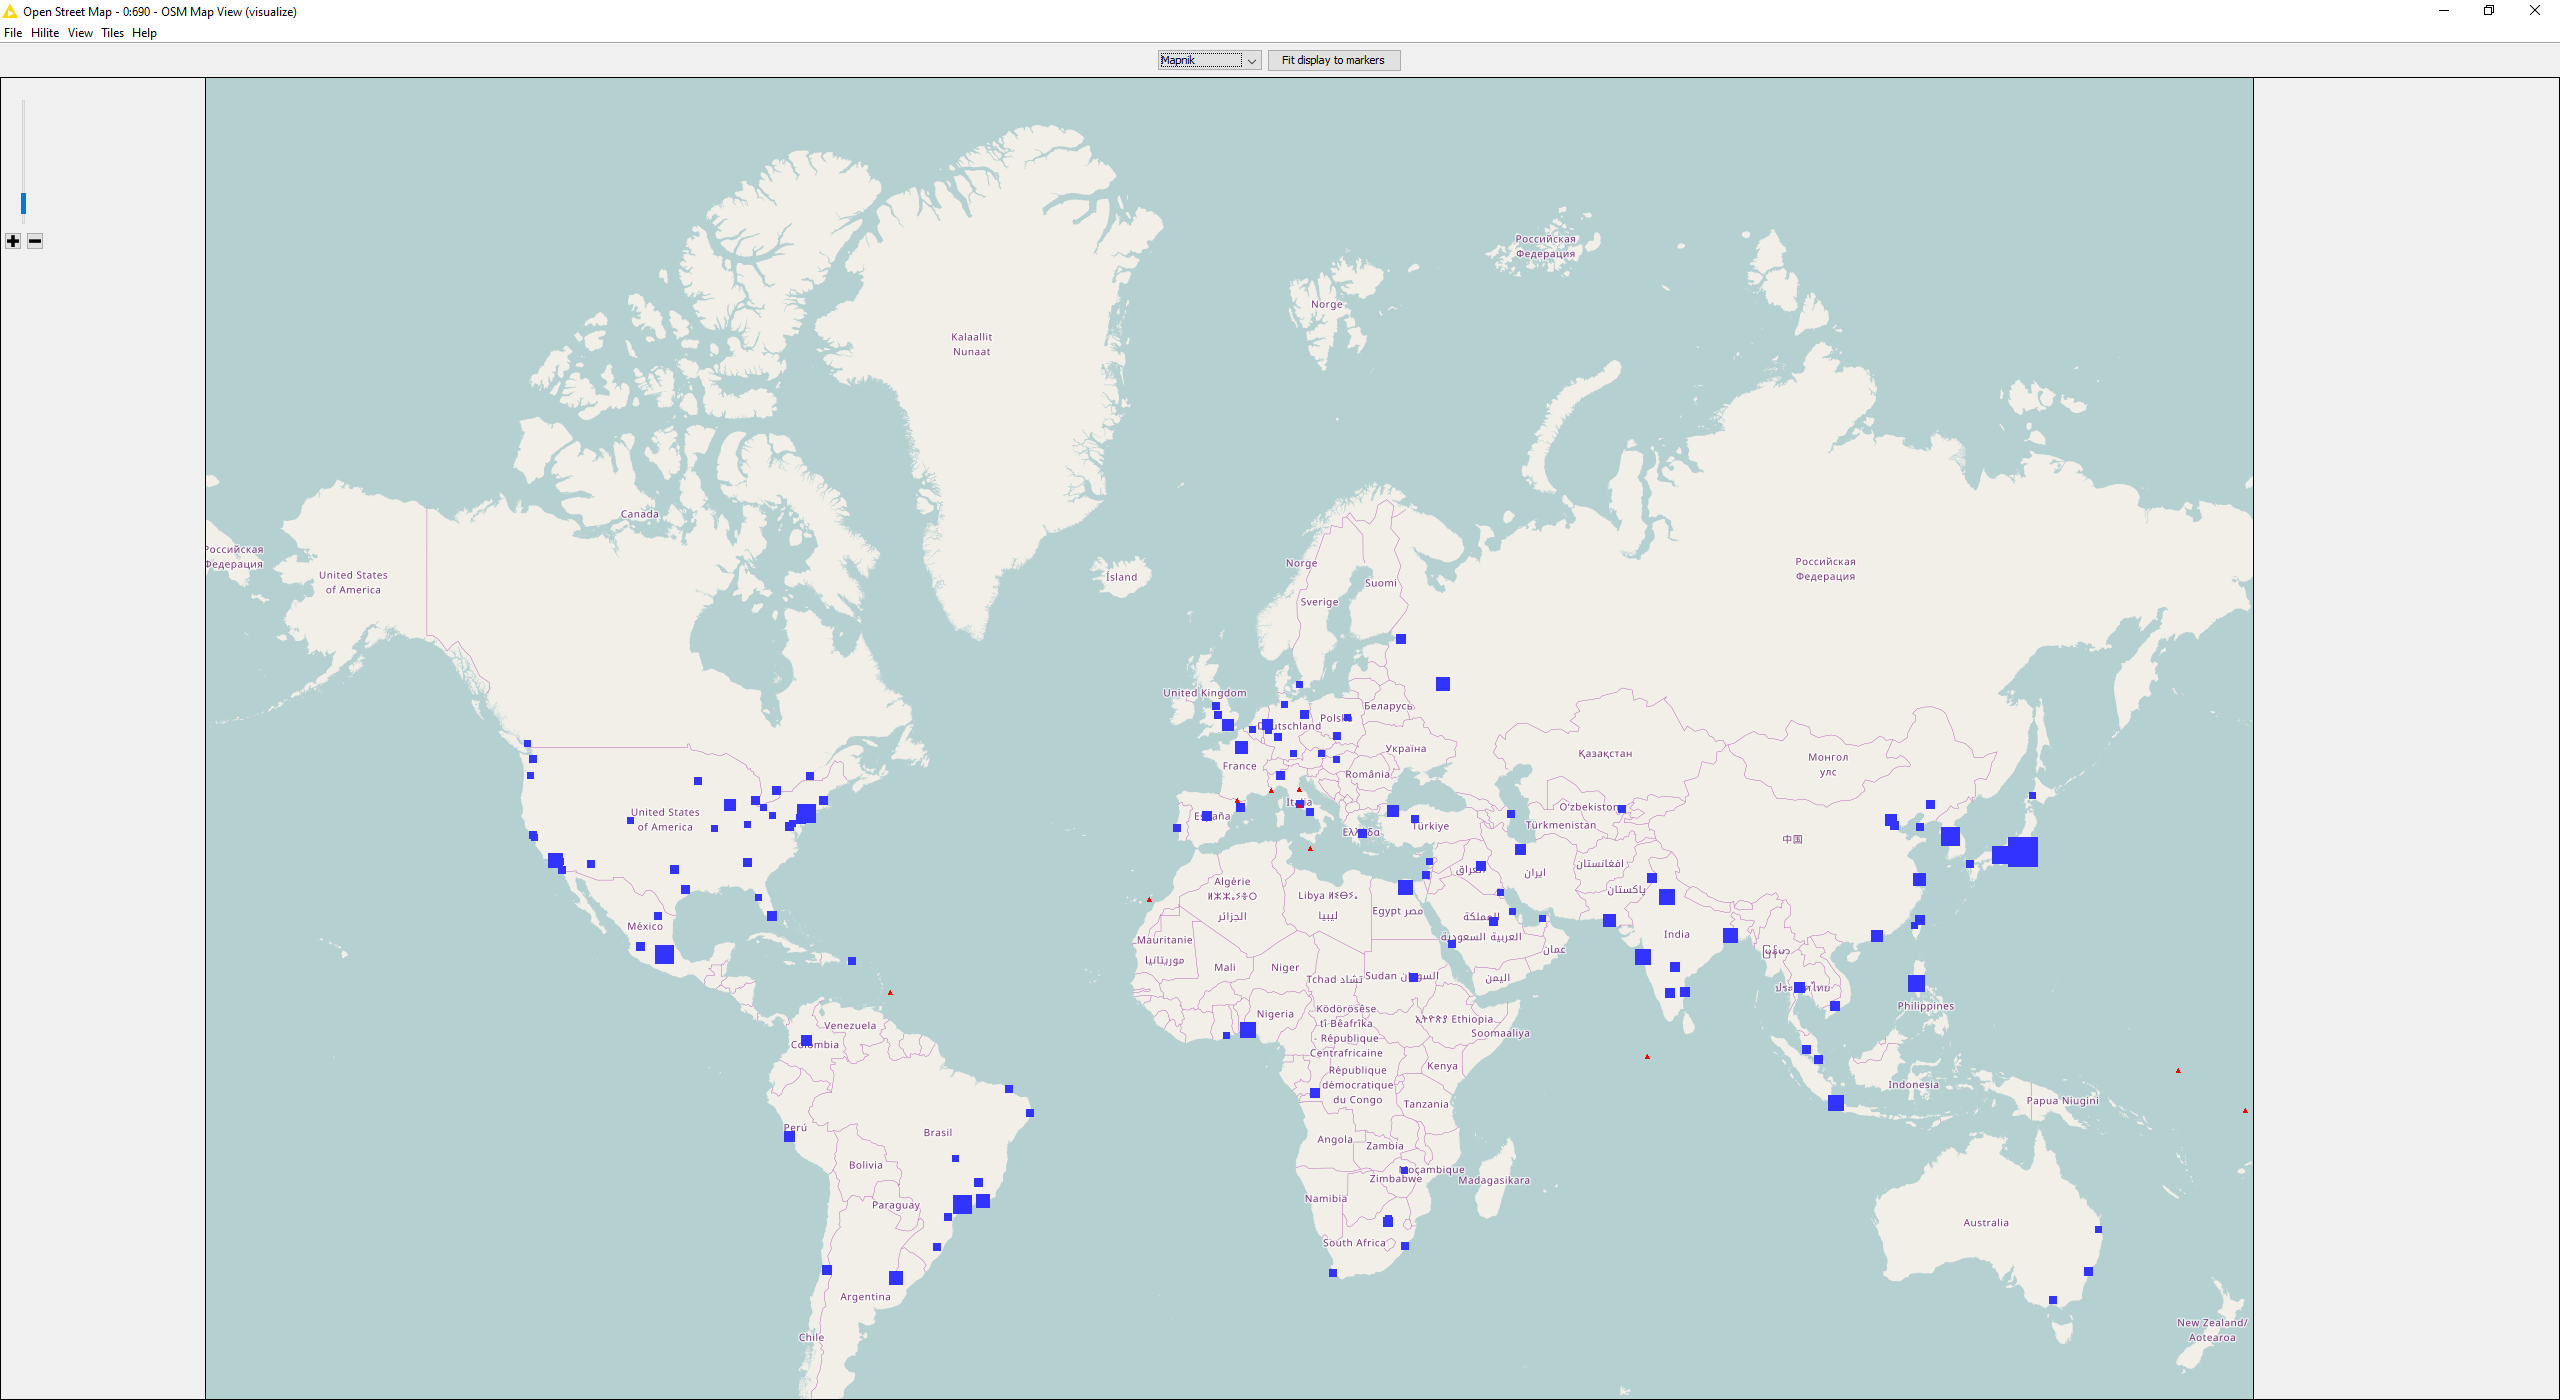
(click on the image to see it in full size)
Figure 2. This workflow successfully blends data from CSV files with responses from Google Geocoding API. It also blends the KNIME Analytics Platform with the Open Street Map tool.
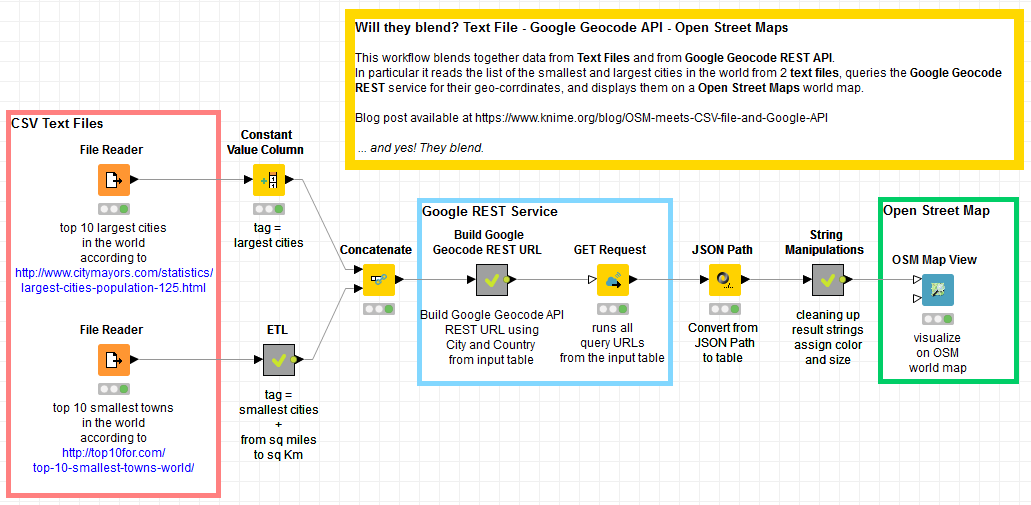
(click on the image to see it in full size)
The workflow is available, without the API keys, on the KNIME EXAMPLES server under 03_Visualization/04_Geolocation/06_Google_Geocode_API-OSM-text_file03_Visualization/04_Geolocation/06_Google_Geocode_API-OSM-text_file*.
The Results
Yes, they blend!
The largest cities on Earth in terms of population are Tokyo, New York, Sao Paulo, Seoul, and Mexico City. Most of the smallest capitals are located on islands or … in Europe. Europe has the highest number of smallest capital cities of equally small countries, no doubt due to historical reasons. The smallest capital of all is San Marino with only 25000 inhabitants.
Notice the strange case of Rome, included among the largest cities but also including one of the smallest capitals, the Vatican.
The final data set is the result of merging data from CSV file with data from the Google Geocoding REST API.
The most important conclusion then is: Yes, the data blend!
This post, however, describes another level of blending: the tool blending between KNIME Analytics Platform and Open Street Map.
The second conclusion then is: Yes, the two tools also blend!
If we also consider the blending of smallest and largest cities, we could add a third blending level to this post. I am getting carried away.
Coming Next …
If you enjoyed this, please share this generously and let us know your ideas for future blends.
We’re looking forward to the next challenge. What about blending the most innovative data platform with the most traditional data source? What about blending Hadoop with Excel? Will they blend?
* The link will open the workflow directly in KNIME Analytics Platform (requirements: Windows; KNIME Analytics Platform must be installed with the Installer version 3.2.0 or higher)