
In this blog series we’ll be experimenting with the most interesting blends of data and tools. Whether it’s mixing traditional sources with modern data lakes, open-source devops on the cloud with protected internal legacy tools, SQL with noSQL, web-wisdom-of-the-crowd with in-house handwritten notes, or IoT sensor data with idle chatting, we’re curious to find out: will they blend? Want to find out what happens when IBM Watson meets Google News, Hadoop Hive meets Excel, R meets Python, or MS Word meets MongoDB?
Follow us here and send us your ideas for the next data blending challenge you’d like to see at willtheyblend@knime.com.
Today: Local vs. remote files. Will blending overcome the distance?
The Challenge
Today’s challenge is distance: physical, geographical distance … between people and between compressed files.
Distance between people can easily be solved by any type of transportation. A flight before Christmas can take you back to your family just in time for the celebrations. What happens though if the flight is late? Better choose your airline carrier carefully to avoid undesired delays!
Distance between compressed files can easily be solved by KNIME. A few appropriate nodes can establish the right HTTP connection, download the file, and bring it home to the local files.
The goal is to visualize the ratio of departure delays in Chicago airport by carrier through a classic bar chart. We will take the data from the airline dataset and we will focus on two years only: 2007 and 2008. I worked on this dataset for another project and I already have the data for year 2008 zipped and stored locally on my laptop. I am missing the data for year 2007 but my colleague worked with this data before and made a compressed version available on her public space on the KNIME Hub.
So on the one hand I have a ZIP file with the 2008 data from the airline data set here on my laptop. And on the other side I have a link to a ZIP file with the 2007 data on some server in some remote location, possibly close to the North Pole. Will KNIME fill the distance? Will they blend?
Topic. Departure delays by carrier.
Challenge. Collect airline data for 2007 and 2008 and display departure delay ratio by carrier from Chicago airport.
Access Mode. One file is accessed locally and one file is accessed remotely via an HTTP connection.
Integrated Tool. JavaScript based visualization.
The Experiment
Access the LOCAL file for year 2008 of airline data
Airline data for year 2008 have already been downloaded onto my machine a few weeks ago for a previous experiment. Data was still zipped. I only need one CSV Reader node available with the new File Handling framework (updated in version 4.3 of KNIME Analytics Platform) in order to import the compressed CSV file directly into the KNIME workflow.
Access the REMOTE file via HTTP connection for year 2007 of airline data
Although stored remotely, the data for December 2007 can also be imported directly into a KNIME workflow without downloading it first. I just need to set up the HTTPS connection and read the data into a KNIME data table. The data are available on the KNIME Hub.
With the new File Handling updated in version 4.3, new Connector nodes were made available that can connect to remote file systems. They can be found in the IO/Connectors in the Node Repository. Besides, most Reader nodes support the dynamic ports allowing to access files directly from the remote file systems.
In this case:
- We first established an HTTP connection to the server URL (https://hub.knime.com) through an HTTP(S) Connector node
- By activating the dynamic port in the CSV Reader node, we then imported the compressed CSV file directly from the remote location, without additional steps of downloading and decompressing
Blend the two data sets
Now, the lower branch of the workflow (Fig. 1) deals with the 2008 airline data from the local file, while the upper branch handles the 2007 airline data from the remote file. After removing all cancelled flights on both sides, we used a Concatenate node to put both data sets into a single data table.
The following metanode defines departure delay, isolates flights originating in Chicago airport, and calculates the ratio of departure delays by carrier, which the JavaScript Bar Chart node then interactively visualizes (Fig. 2).
Figure 1. This workflow successfully blends data from a local and a remote file location. The remote file is downloaded through an HTTP connection and then unzipped and read like the local file.
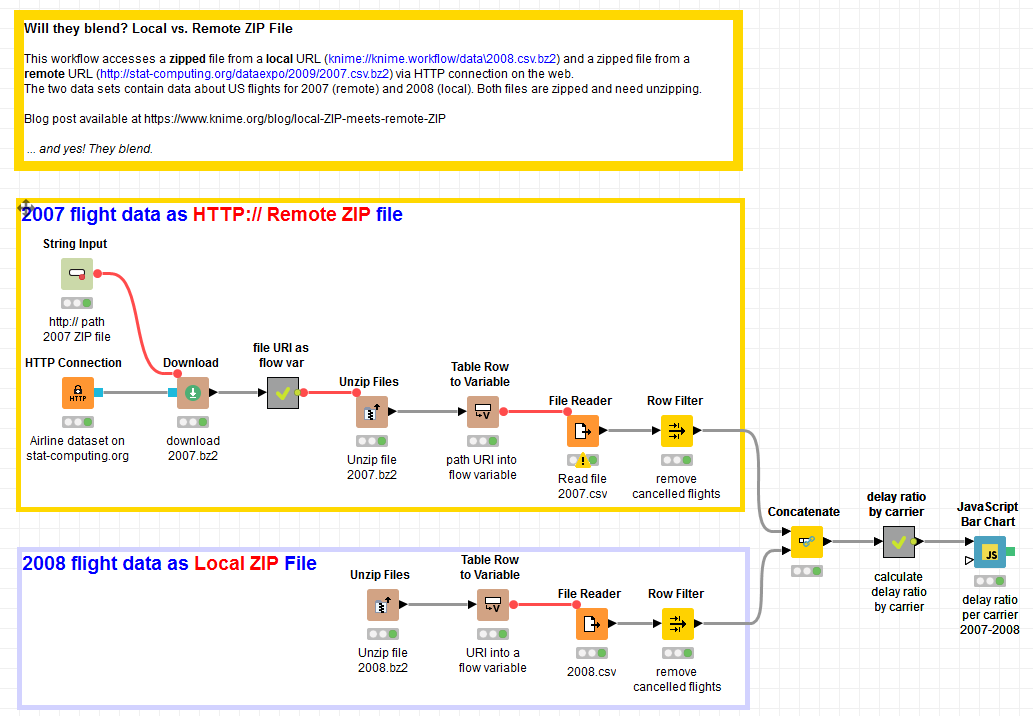
(click on the image to see it in full size)
Figure 2. Bar chart of departure delay ratio by carrier for year 2007 and 2008.
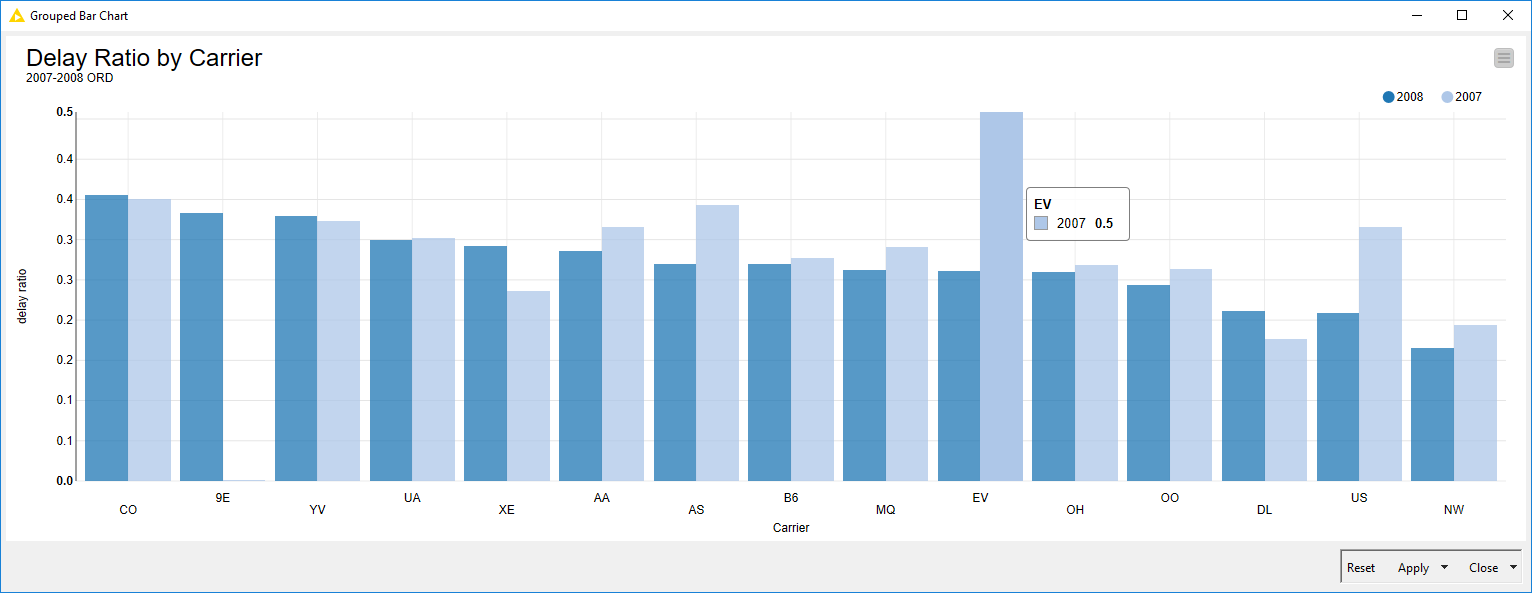
(click on the image to see it in full size)
The workflow is available in the KNIME EXAMPLES space under 01_Data_Access/01_Common_Type_Files/14_Reading local and remote compressed CSV files or from the KNIME Hub.
The Results
By looking at the chart we can see that if you had taken an American Eagle Airlines (MQ) flight from Chicago in December 2007 you would have been delayed at departure one out of two times. Things would have looked better though one year later in December 2008. Delta Airlines (DL) and Northwest Airlines (NW) seemed to be the most reliable airlines when departing from Chicago O’Hare airport respectively in December 2007 and December 2008. Pinnacle Airlines (9E) and Atlantic Southeast Airlines (EV) did not have flights in Chicago O’Hare airport in December 2007. For EV in December 2008 there were no delays but only 9 flights were made.
In this article we can safely conclude that KNIME has overcome the distance problem between two compressed files and successfully blended them to build a bar chart about airline departure delay ratios.
Again the most important conclusion is: Yes, they blend!
Coming Next…
If you enjoyed this, please share this generously and let us know your ideas for future blends.
We’re looking forward to the next challenge. There we will try to blend data from Amazon S3 with data from Microsoft BlobStorage. Will they blend?
* The link will open the workflow directly in KNIME Analytics Platform (requirements: Windows; KNIME Analytics Platform must be installed with the Installer version 3.2.0 or higher)