
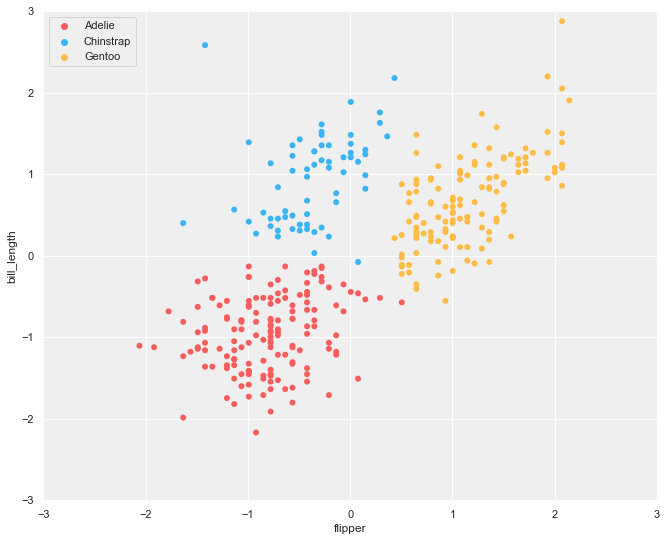
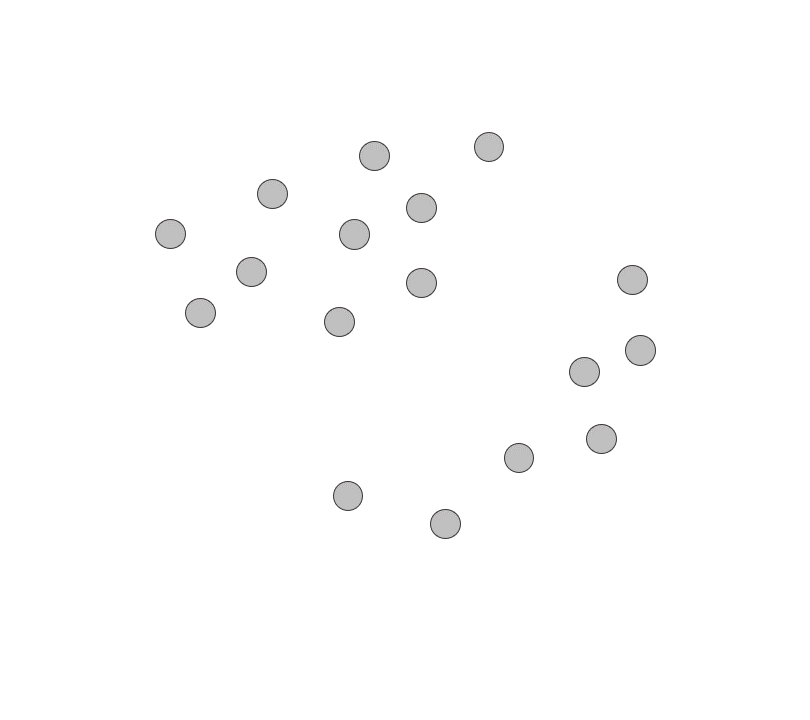
Clustering is a machine-learning technique that groups similar data points on a scatter plot for data visualization, prototyping, sampling, and segmentation. Clusters are the distinct groups that emerge from the segmentation process. Clustering can lead to a single grouping/cluster or multiple clusters (see below) and can identify (previously unknown) groups in the data.
Types of clustering algorithms
There are many different clustering algorithms available as a machine learning technique. In this article, we cover three methods:
- k-means
- hierarchical
- DBSCAN
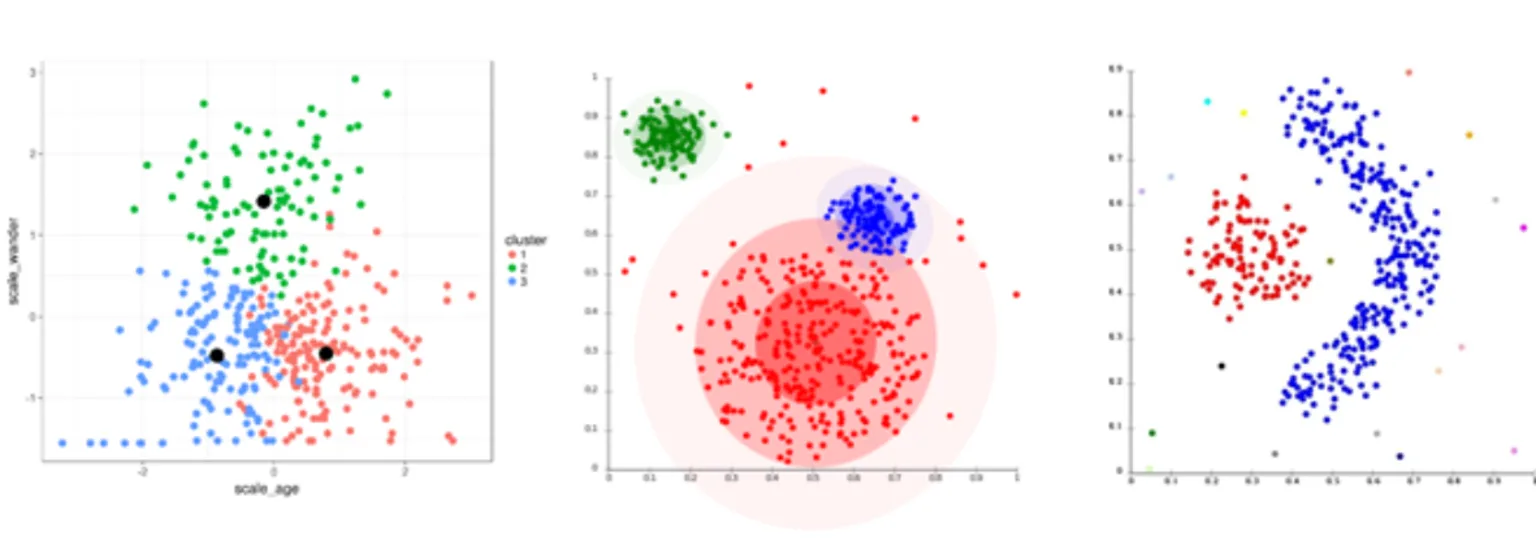
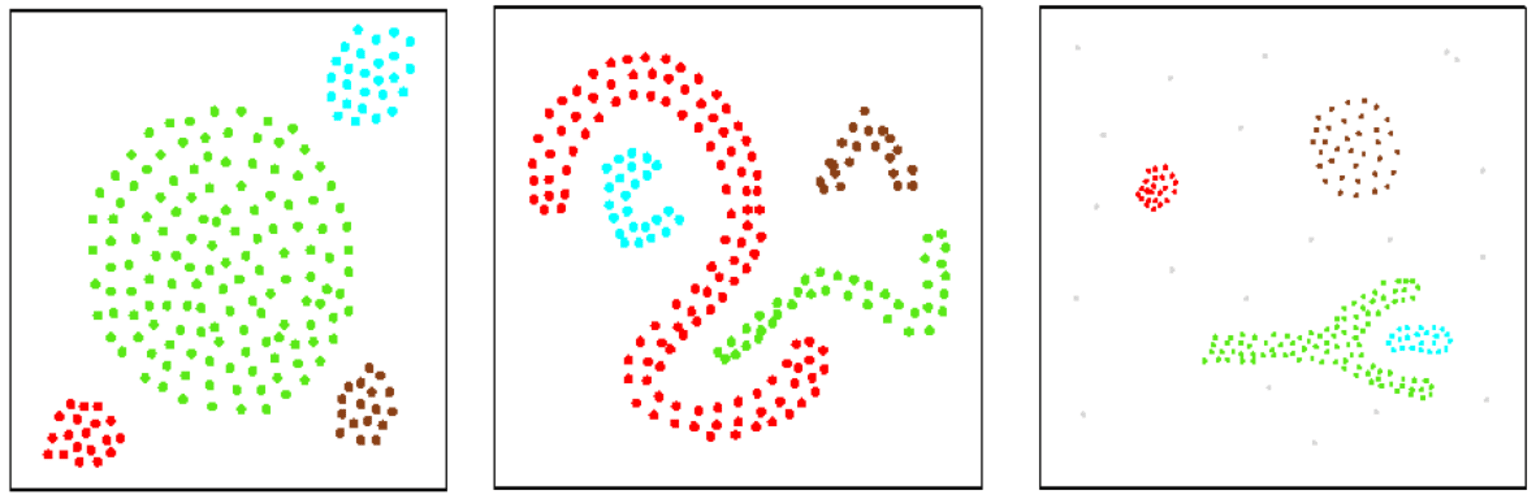
Clusters formed by different methods may have different characteristics (see below), such as different shapes, sizes, and densities. They may form a hierarchy (e.g., cluster C is formed by merging clusters A & B), or can be disjoint, touching, or overlapping.
Even though each algorithm has its own assumption/approach, it is possible to converge to similar results where the clusters have similar properties. For example, if the data naturally forms spherical clusters with clear separation, both k-means and hierarchical clustering might produce similar results.
Let’s examine how clusters with different properties are produced by different clustering algorithms.
1. k-Means clustering
K-means clustering is perhaps the most popular clustering algorithm. It’s a partitioning method in which the data space is divided into distinct clusters (i.e., a predetermined number of clusters that the algorithm will partition the data into — not to be confused with a predetermined target class).
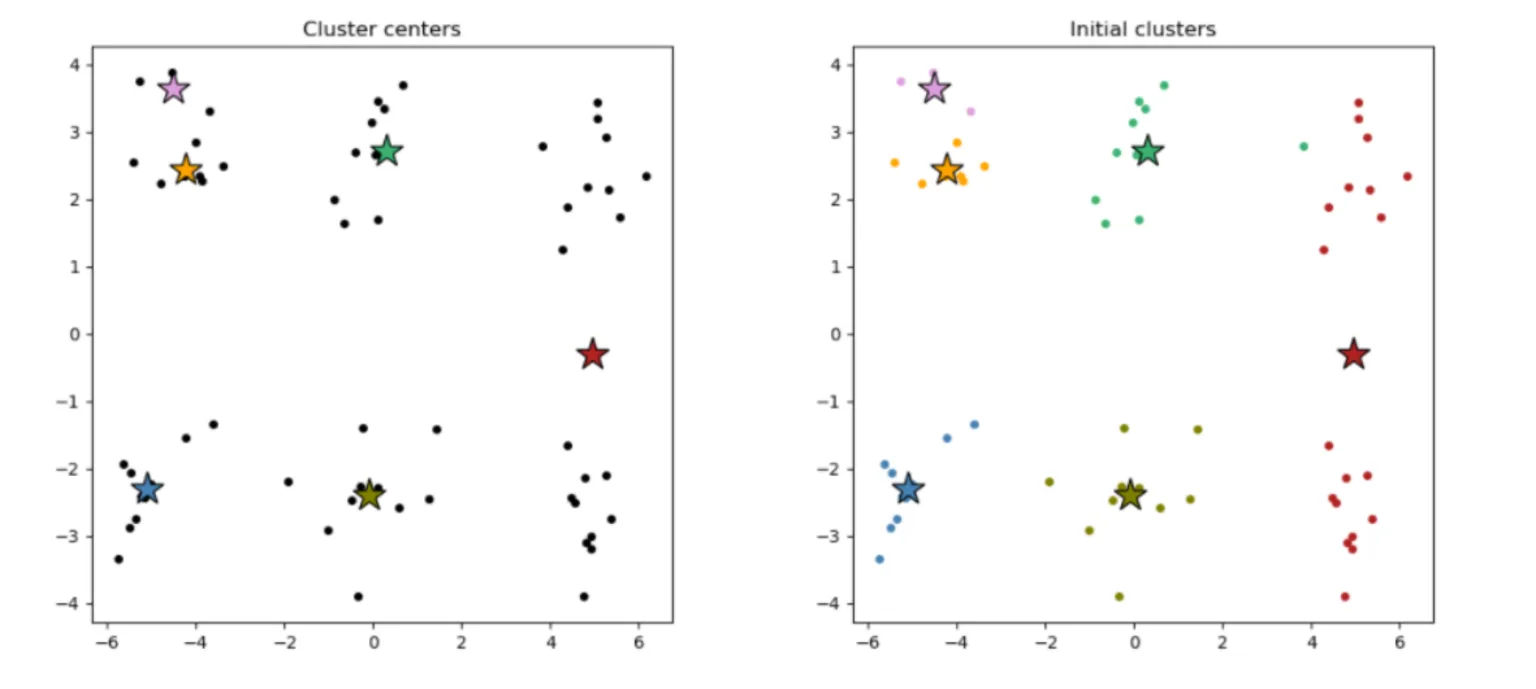
The algorithm starts with those randomly selected cluster centers (see below, left), and all data points are assigned to the nearest cluster centers (see below, right). Then, the cluster centers are re-calculated as the centroids of the newly formed clusters.
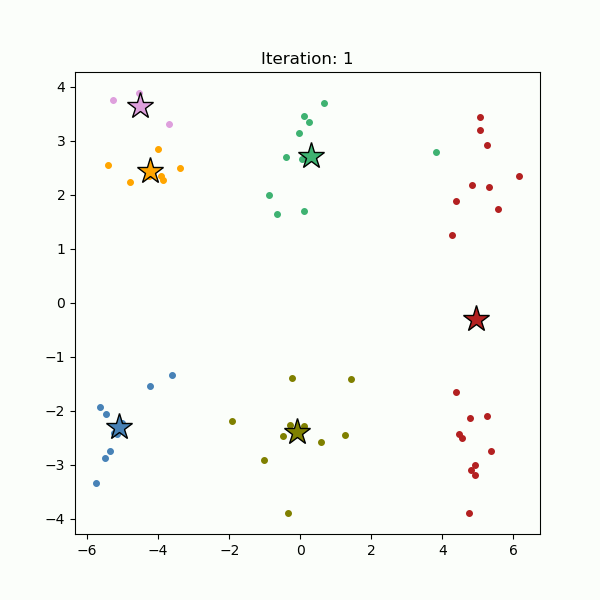
The data points are re-assigned to the nearest cluster centers we just re-calculated. This process of assigning data points to the cluster centers and re-calculating the cluster centers is repeated until the cluster centers stop moving (see below).
Clusters formed by a k-means algorithm can be convex or concave, spherical or anisotropic in shape, and tend to be similar in size. This algorithm tries to construct a spherical shape around the centroid, meaning once the clusters have complicated geometric shapes, k-means doesn’t do a great job of clustering the data.
Additionally, k-means clustering is known for its sensitivity to outliers, which can influence cluster formation and quality. That’s why it is important to identify and remove outliers in your data before applying the algorithm. Or, you can assign them to a separate cluster to isolate them from the rest of the data and avoid distorting the cluster structure. You can also transform the outliers so they have less of an impact on the formation and quality. This can be done with techniques such as log transformation, square root transformation, median absolute deviation, or quantile normalization.
2. Hierarchical clustering
A hierarchical clustering algorithm works by iteratively connecting the closest data points to form clusters.
Initially, all data points are disconnected from each other; each data point is treated as an independent cluster. Then, the two closest data points are connected, forming a cluster. Then, the next two closest data points (or clusters) are connected to those two data points to form a larger cluster. And so on. This process is repeated to form progressively larger clusters and continues until all data points are connected into a single cluster (see below) (i.e., In the first step, each data point is independent. Then, they join to the closest one, forming clusters of two data points. In the third step, clusters join again to the closest one. Here, each cluster would have four data points. Then eight, 16, 32 data points, and so on.)
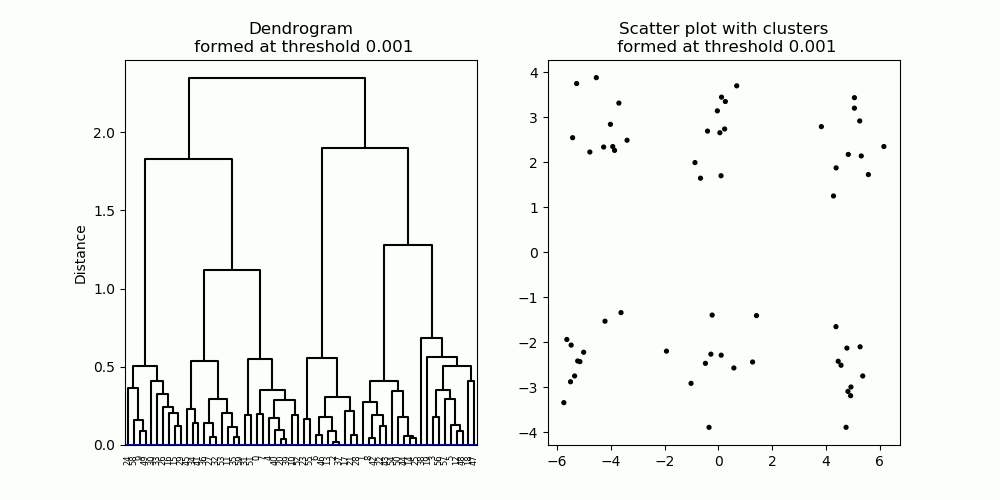
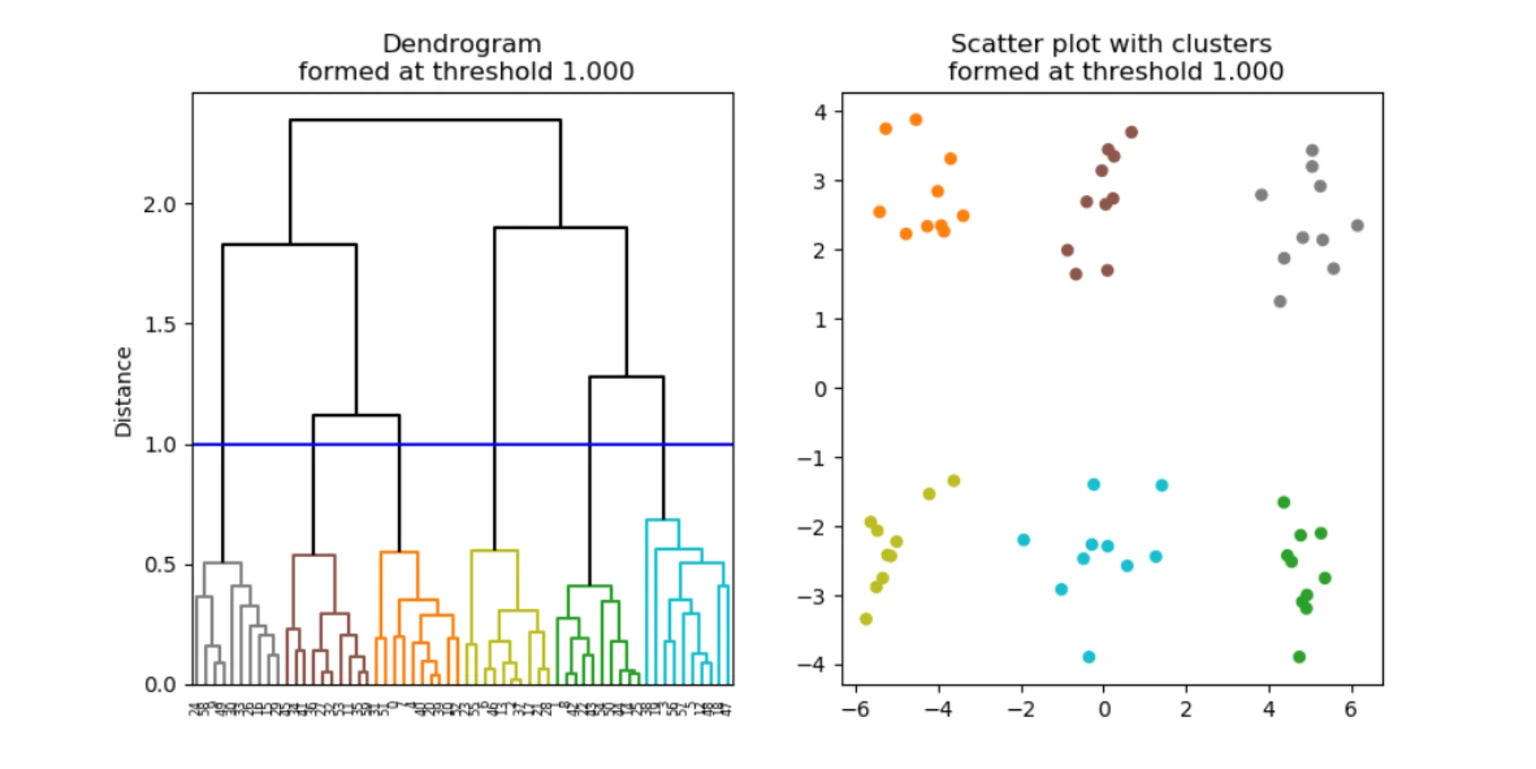
Hierarchical clustering forms a hierarchy of clusters, described in a diagram known as a dendrogram (Figure 6, left). A dendrogram describes which data points/clusters are connected and at what distance (from each other), starting from individual data points at the bottom of the graph to one single large cluster at the top.
To obtain a cluster partition with a particular number of clusters, one can simply apply a cut-off threshold at a particular distance on the dendrogram, producing the desired number of clusters (see below). (For example, you can set a threshold of six clusters of data and the algorithm will run until then.) The shape of clusters formed by hierarchical clustering depends on how the distance is calculated between clusters.
Types of linkage methods in hierarchical clustering
There are three types of linkage methods in hierarchical clustering:
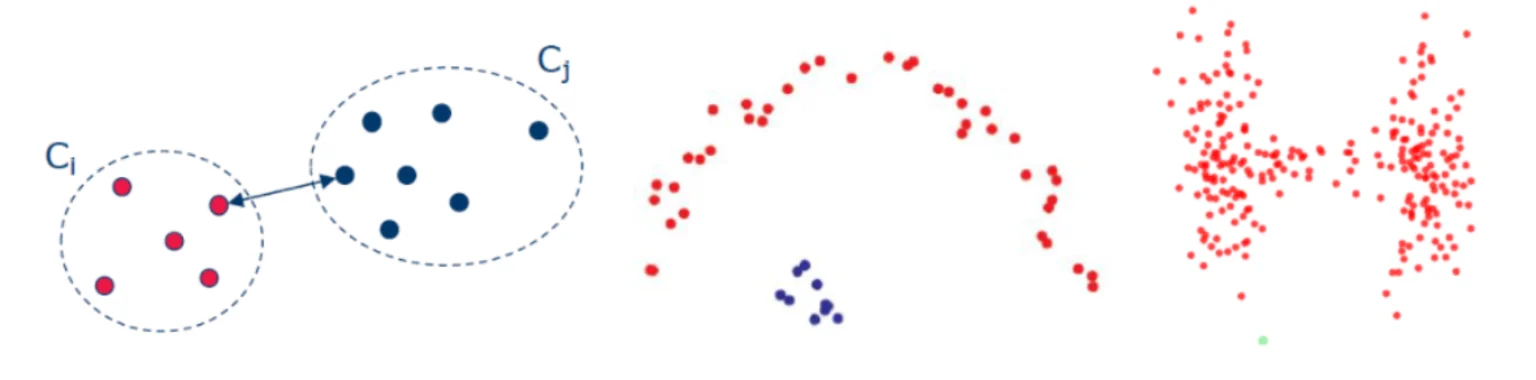
Single linkage: the inter-cluster distance is measured by the closest two points between the two clusters (see below, left). This method produces well-separated clusters (see below, middle & right).
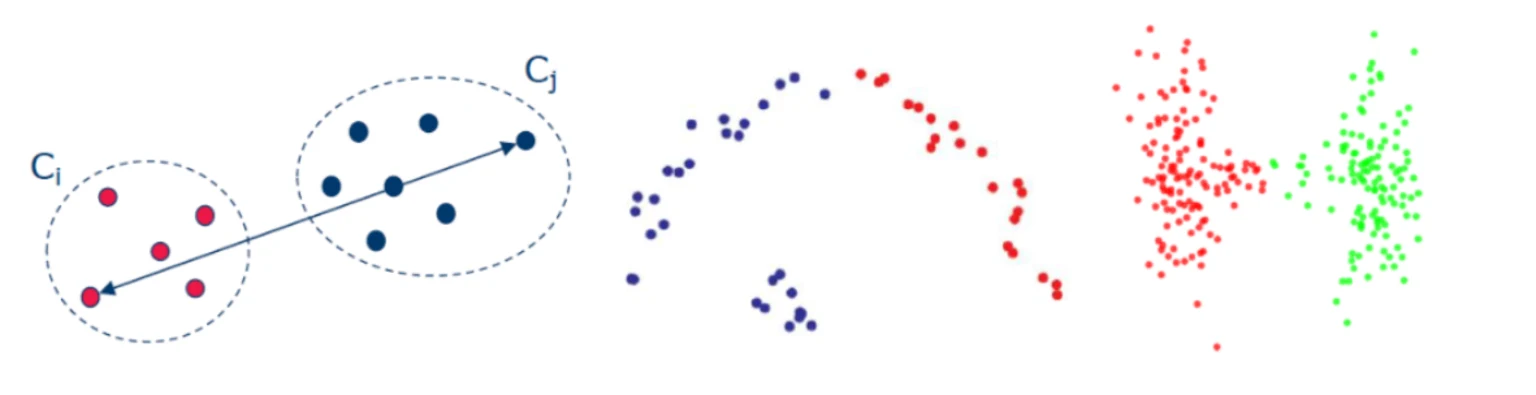
Complete linkage: the distance is calculated as the farthest points between the two clusters (see below, left). The resulting clusters tend to be compact, but not necessarily well-separated (see below, middle & right).
Average linkage: the inter-cluster distance is calculated as the distance between the centers of gravity between two clusters. This approach is a compromise between the single and complete linkage methods.
3. DBSCAN
DBSCAN stands for Density-Based Spatial Clustering of Applications with Noise. It is a density-based clustering method, grouping dense clouds of data points into clusters. Any isolated points are considered not part of clusters and are treated as noises.
The DBSCAN algorithm starts by randomly selecting a starting point. If there are a sufficiently large number of points near that point (defined by a predetermined distance threshold), then those points are considered part of the same cluster as the starting point. The neighborhoods of the newly added points are then examined. If there are data points within these neighborhoods, then those points are also added to the cluster.
This process is repeated until no more points can be added to this particular cluster. Then, another point is randomly selected as a starting point for another cluster, and the cluster formation process is repeated until no more data points are available to be assigned to clusters (see below).
If data points are not close to any other data points, such data points are considered noises. Clusters of any shape can be formed by the DBSCAN algorithm (see below).
Choosing a clustering algorithm
As you have seen so far, different clustering algorithms produce different types of clusters. As with many machine learning algorithms, there is no single clustering algorithm that can work in all scenarios of identifying clusters of different shapes, sizes, or densities that may be disjoint, touching, or overlapping. Therefore, it is important to select an algorithm that finds the type of clusters you are looking for in your data.
Selecting the appropriate clustering method provides a more comprehensive understanding of your data. For example, hierarchical clustering produces well-defined hierarchical structures, which, if you’re an e-commerce business owner analyzing customer data, could help you understand how customer segments are related and help evaluate different algorithm performances.
Once you’ve conducted a cluster analysis, you can summarize relatively homogenous data points belonging to the same cluster with a single cluster representative, allowing for one representative point and simplifying the dataset. This enables data reduction and reduces complexity, improving computation efficiency (fewer data points speed up the process), enables better visualization (to identify outliers or patterns), and helps remove noise and variability. Clustering can also identify unusual observations distinct from other clusters, such as outliers and noises.
Apply clustering algorithms without code
KNIME Analytics Platform is an intuitive, open source data analytics tool which you can download to can conduct cluster analysis (among many other ML techniques and data analytics tasks) without needing to write code.
You can build and customize a clustering workflow, save it, and share it for others to reuse. And there’s no limit to the type of algorithm you choose to apply because of the breadth of techniques available. Its visual, drag-and-drop interface is intuitive enough for beginners to use and offers the flexibility of customization for experts (with the option to incorporate a scripting language if desired).
Below, you can see examples of KNIME workflows implementing the three algorithms discussed in this article (on simulated clustered data).
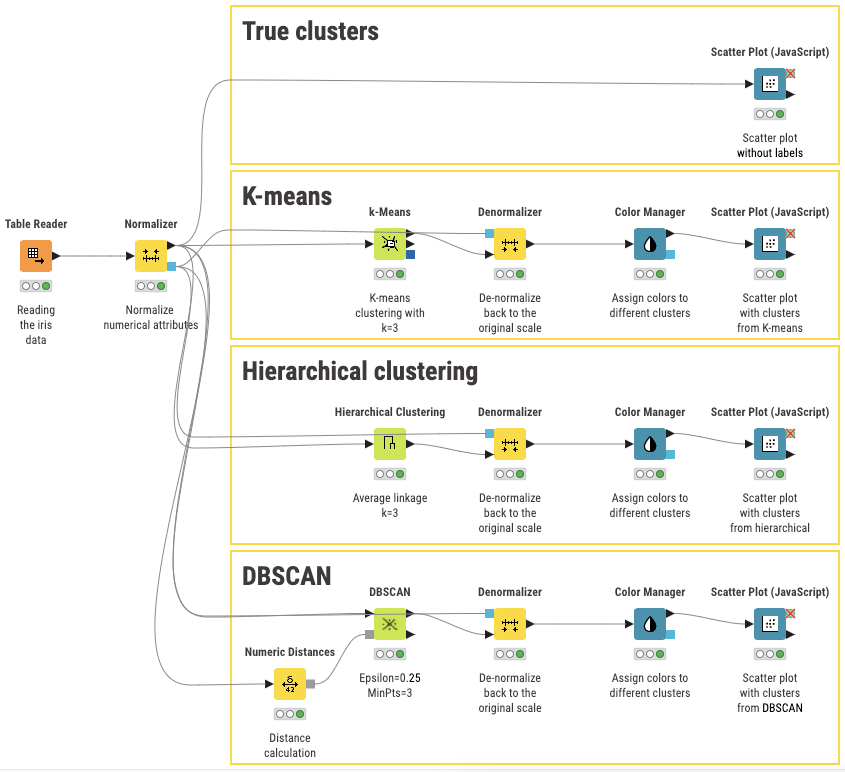
You can start using KNIME today for free. When you’re ready, explore this workflow and try it yourself. Then, you can browse KNIME Community Hub for more machine learning blueprints and jumpstart another data science project.