
In the fall of 2024, Professor Hamed Zolbanin from University of Dayton partnered with KNIME for the second time to launch a student challenge on database management and analytics.
The students presented their solutions, which analyzed a coffee shop business and proposed changes to better serve customers, as an assignment for Zolbanin’s “Systems Implementation with Database Management Systems”class.
What is the database management & analytics student challenge?
The challenge encourages students to use KNIME Analytics Platform and learn skills for database management and analytics based on real-world examples.
Professor Zolbanin asked the students to analyze the sales and financial data of a coffee chain business, and generate actionable insights to help the company improve its performance. Split into teams of three to four people, the students formulated questions related to the coffee business, built workflows in KNIME Analytics Platform to answer them, and came up with actionable insights. Professor Zolbanin and KNIME ranked the students’ projects in December.
Today, we'd like to shout out the top three winning solutions.
1st place: A robust KNIME dashboard to uncover growth opportunities and resource allocation in a coffee chain
By Aidan Dempsey, Calvin Laurenson, Isaiah Martin, and Robert Zeman
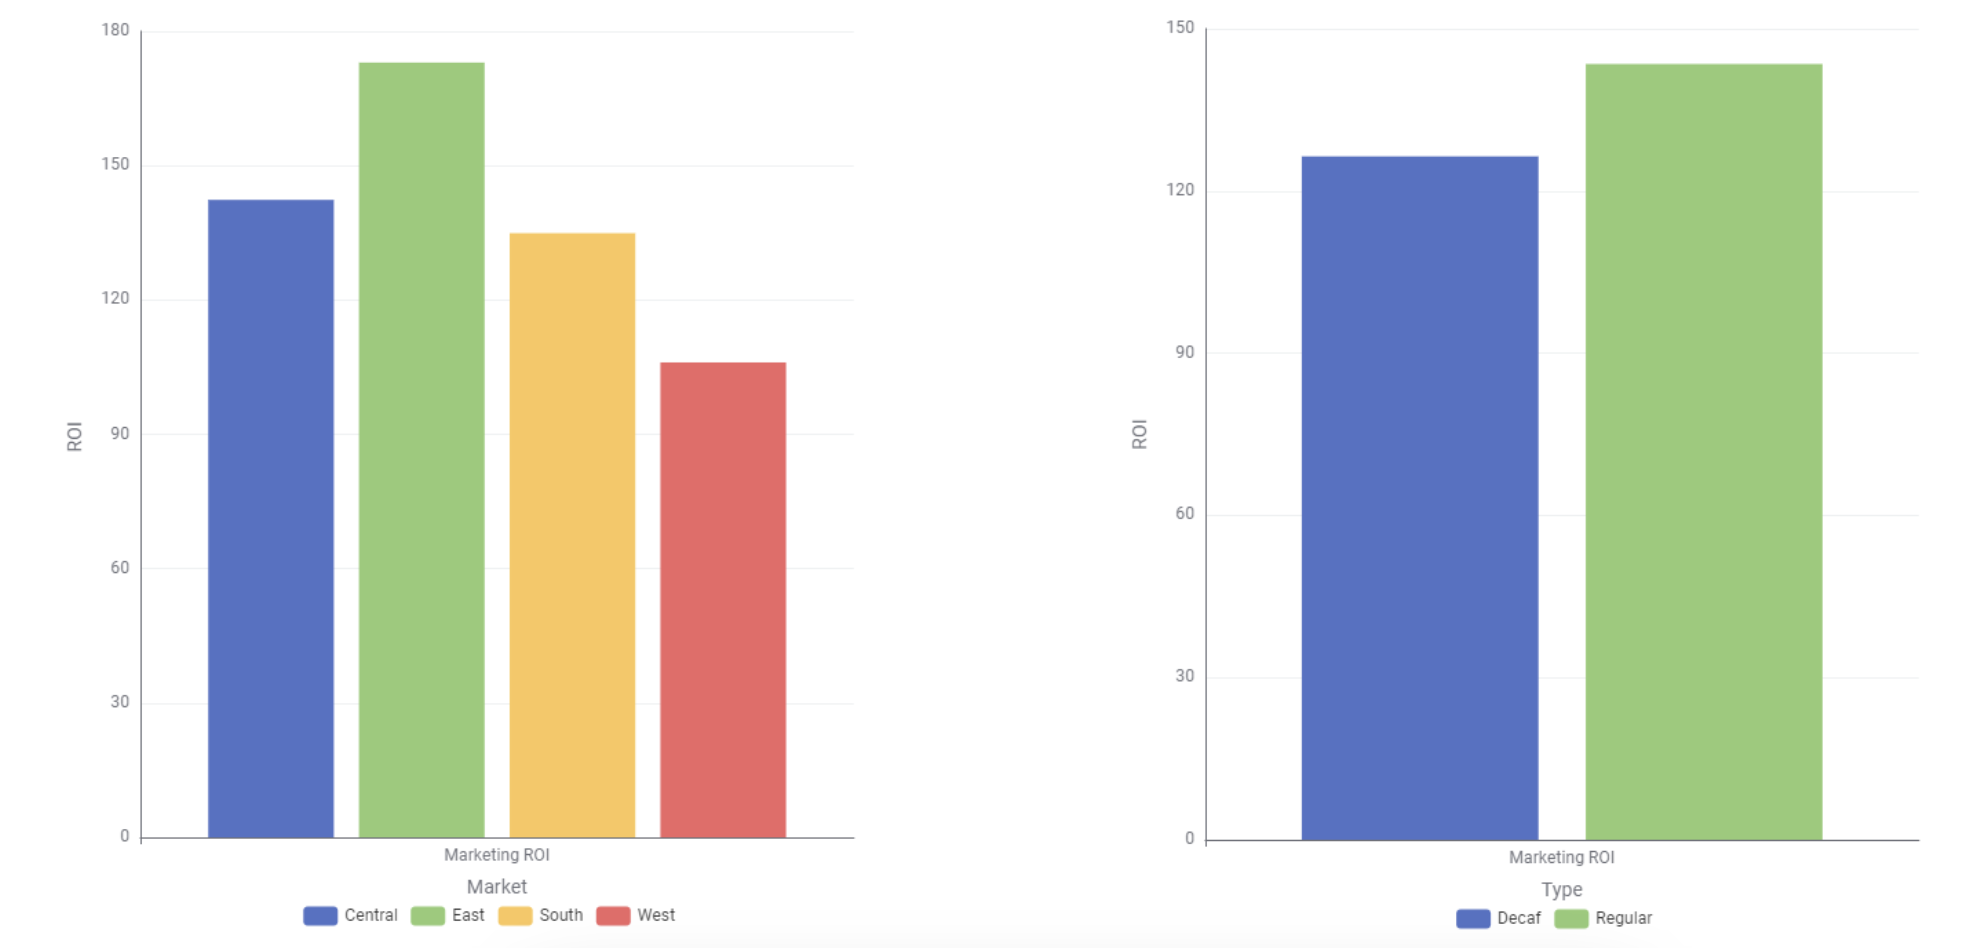
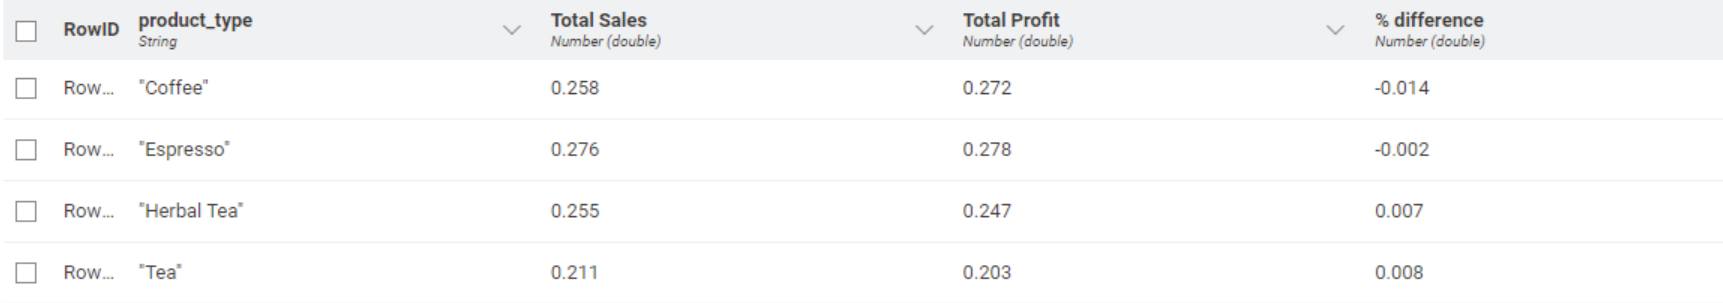
To understand how effective marketing expenses were in this coffee chain business, and to identify growth opportunities, the students dove deep in the data with different wrangling and visualization techniques. Their main recommendation for the coffee chain in question is to adjust how much they spend on decaffeinated products in the Eastern region of the United States. They propose reallocating some of this budget to regular coffee products, which can lead to a better margin of profit.
Among many data-driven insights, two more stood out:
- The data showed that tea sales in some parts of the United States were doing much better than expected, suggesting a great opportunity to increase marketing and stock in these areas.
- Products sold in major markets consistently generated higher profits for the company, indicating that a larger allocation of resources and effort towards major markets can make the company capitalize on their stronger performance.
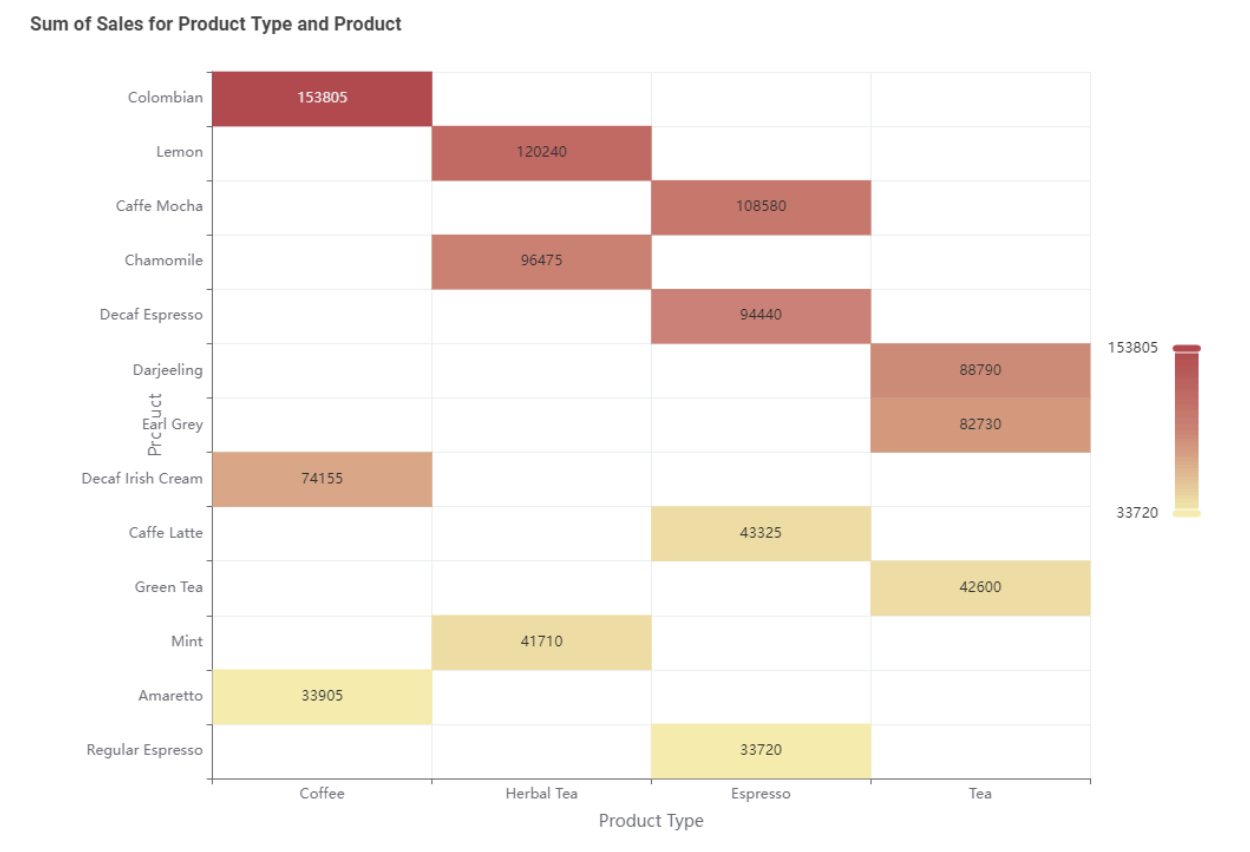
The students created a robust dashboard with many visualizations to back up their insights, comparing sales across different products, regions, and months. They successfully queried the MySQL database that contained the coffee chain dataset, cleaned and grouped the data, and did not spare efforts in representing their findings graphically.
2nd place: Region-based insights for a more successful coffee business
By Anne Cataldo, Liz Mancini, Allison Shelly, and MK Walther
The second place winners found out that, overall, the coffee chain in question is performing well, but could be more successful in the south of the United States.
This insight is backed up by a workflow they built in KNIME, which aggregates sales data by state and region. In the students’ presentation, they suggest that the coffee chain should further research consumer preferences in the south and launch region-specific products or campaigns.
Upon analysis, the students also recommend a focus on untapped markets in the East, especially those in less central, urban areas like New York. In terms of products, their analysis indicates that less popular products, such as teas, could benefit from more marketing – or, alternatively, could be dropped altogether so that their funds could be reinvested in areas with more potential.
In terms of implementation, these students’ solution stood out in terms of documentation and legibility. They carefully labeled the nodes they used, mostly for database manipulation and visualization, making it easy to understand where their insights were coming from.
3rd place: Statistics & correlation analysis points towards more competitive prices & streamlined cost structures
By Ryan Boehmer, William Haskins, Frank Pinn, and Sarah Spaulding
The third place winners implemented a detailed workflow to scrutinize many aspects of the coffee chain business. Not only did they explore database manipulation, wrangling and visualization techniques, but they also included statistics and correlation analysis in their investigation.
Their analyses uncovered eight different actionable insights for the business, including more investment in the Coffee, Espresso, and Beans product lines to expand their contributions to sales and profits; a revamped strategy for tea products, with more competitive prices and streamlined cost structures to increase profit margins; and the optimization of regional marketing, scaling strategies that work well in the central region of the United States to underperforming regions such as the south.
Another successful partnership with University of Dayton comes to a close
We’d like to thank all students for working on this challenge, and to Professor Zolbanin for co-organizing another KNIME Student Challenge with us, besides supervising the whole process.