
When you’re working with data, it’s always tempting to dive straight into it. But there’s nothing worse than doing lots of work and then getting a result that doesn’t actually address the problem you originally wanted to solve. Instead, try reverse thinking.
What is reverse thinking?
Reverse thinking means starting with the end in mind and working backwards before you even have your data. You begin with the thing you want to understand: your claim or hunch. In reverse thinking, this is your "answer". Now, you work backwards to ask questions that will give you this answer.
This backwards approach, or reverse thinking, helps you focus on the real question you’re trying to answer and identify the data you’ll need to analyze. You decide what you need to prove or disprove your hunch before you touch a single dataset.
For example, let's take the feeling we have right now: "Everyone's playing pickleball."
Reverse thinking asks:
- What would need to be true for that hunch to hold up?
- What questions would the data need to answer?
- What kind of data would show it?
The questions might be:
- What percentage of adults actually play pickleball?
- Is participation growing across all age groups, or just some?
- Are we seeing a real trend or is it just media hype?
By thinking backwards, we know we're going to need data like participation surveys, demographic breakdowns, and multi-year trends to see if the claim stands up.
Reverse thinking vs. hypothesis testing
At first glance, reverse thinking sounds like hypothesis testing but it’s not. Where hypothesis testing is a formal, statistical process once you already have data, reverse thinking is about defining the questions and the data you need before diving in.
Reverse thinking is a planning approach to define the type of ata and the structure of your analysis before you start collecting or exploring. It keeps your project focused and prevents wasted efforts, chasing insights that don't pertain fully to your goal.
Why reverse thinking helps your data work
Reverse thinking strengthens each stage of the data process to ensure
- Clarity: You're clear on the exact questions you're answering
- Efficiency: You collect only the data that matters
- Focus: Your analysis directly ties back to your goal
- Credibility: Your results are easier to explain because they connect to the original hunch.
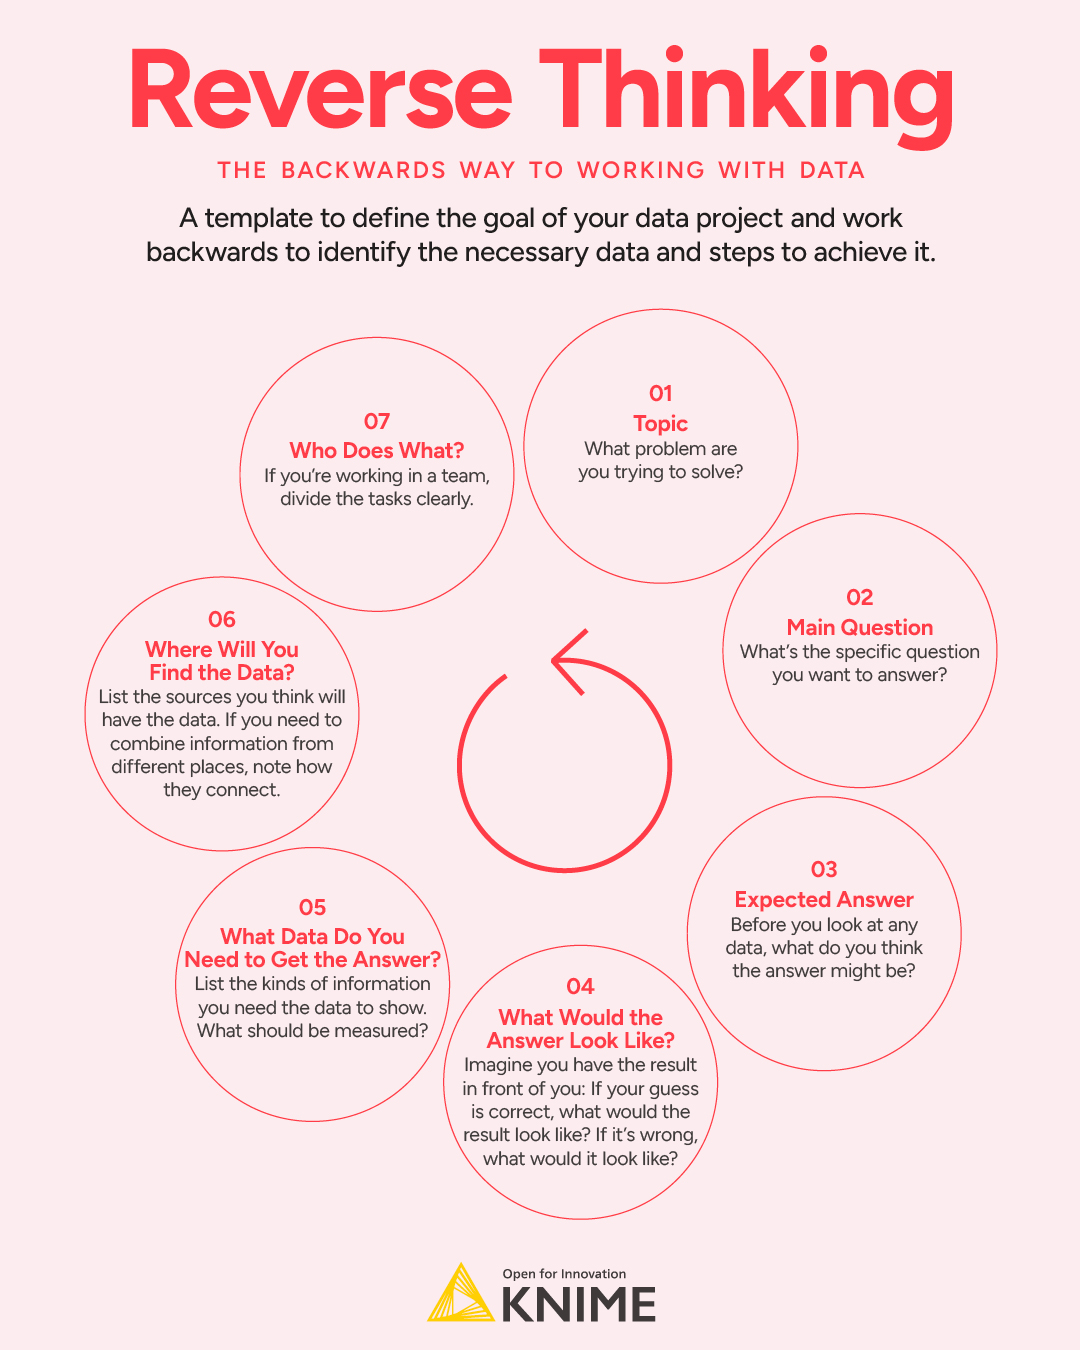
How to apply reverse thinking
We've put together a reverse thinking template to help you apply this approach to your own data projects. It takes you through each step, from defining the topic to outlining the questions and identifying the data you'll need.
Try the template, based on our pickleball hunch🤾🏻.
A Reverse Thinking Template with a pickleball example
| 1. Topic: What problem are you trying to solve | Understanding whether pickleball is truly as widespread as people claim |
| 2. Main question: What's the specific question you want to answer? | Is it accurate to say “everyone’s playing pickleball”? |
| 3. Expected Answer: Before you look at any data, what do you think the answer might be? | Probably not everyone, but participation might be growing fast in certain groups. |
| 4. What would the answer look like: Imagine you already have the result in front of you. Draw a quick sketch, chart, or write a short description: If your guess is correct, what would the result look like? If your guess is wrong, what would it look like? | If true: Data would show a very high percentage of adults (say over 50%) reporting they’ve played pickleball in the last year, across many age groups and regions. If false: Data would show much smaller percentages (e.g. under 20%), or concentrated participation in only certain groups, like retirees or young professionals. |
| 5. What Data Do You Need to Get the Answer? List the kinds of information you need the data to show. What should be measured? Who or what should be included? | Percentage of adults who have played pickleball in the past year Demographic details (age, gender, income, region) Frequency of play (regular vs. casual players) Trends over time (growth vs. flat participation) |
| 6. Where Will You Find the Data? List the sources you think will have the data. If you need to combine information from different places, note how they connect. | National sports and recreation surveys (e.g. SFIA, CDC activity surveys). Market research reports. Local data: club memberships, community center bookings, paddle sales. |
| 7. Who Does What? If you’re working in a team, divide the tasks clearly. | Leo: Gather national survey data. Jesse: Collect demographic breakdowns and trends. Lindsey: Look into alternative data sources (equipment sales, court bookings). Robin: Pull everything together into a summary. |
Turning reverse thinking into action
The next time you're handed some data, resist the urge to dive straight in. Instead start by writing down the answer and asking questions. As you practice reverse thinking, you'll get really good at formulating precise, very specific questions that lead to the data you’ll need and keep you focused on your goal.