
Integrate Google Analytics in Your KNIME Workflow
The KNIME Google Connectors extension provides nodes to connect and interact with Google resources, like Google Sheets, Google Drive, and Google Analytics. Google Analytics is a set of services provided by Google to investigate traffic and activity on a website of your property. This is important: the website must belong to you. This service can be used to give you insight into how visitors to your website are using your site
In this article we want to show how to use the KNIME Google Connectors to integrate Google Analytics into your workflow, connect to the Google Analytics API, and recover the number of pageviews and entrances for new users coming to our web property.
Set Up a Google Analytics Account
To connect to the Google Analytics API, you need a Google Analytics account. The Google Analytics account is organized hierarchically. Any Google account - for example, a Gmail account - can be used to create a Google Analytics account. Each Google Analytics account refers to a number of web properties. In turn, each web property is assigned a number of reporting views. On the support.google.com page you'll find a more detailed description of how Google Analytics accounts are organized: Understand the Analytics Account Structure.
- Log in to Google with a Google account (a Gmail account for example)
- Go to https://analytics.google.com/analytics/web
- Create an Analytics Account
- Within the Analytics account, create one or more web properties referring to the URL of the pages you want to analyze. (Use the Universal Analytics property.)
Connect to Google Analytics in KNIME
On the KNIME side, from your KNIME workflow you will need to:
- Provide authentication on Google to access your Analytics account with the Google Authentication node
- Select the web property you would like to analyze with the Google Analytics Connection node
- Run a Google Analytics query to extract the numbers about the web traffic with the Google Analytics Query node
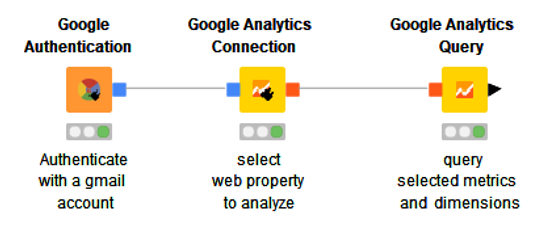
These three steps correspond to the three nodes: Google Authentication, Google Analytics Connection, Google Analytics Query (Fig. 1). Notice the three ports involved in this data flow:
- The blue square port passes authentication for a Google account connection
- The red square port provides an Analytics account connection for a specific web property
- The familiar black triangle port exposes the extracted measures for the web traffic
Provide Google Authentication
First you need to log in to Google with your generic Google account using the Google Authentication node. This node is quite simple to use.
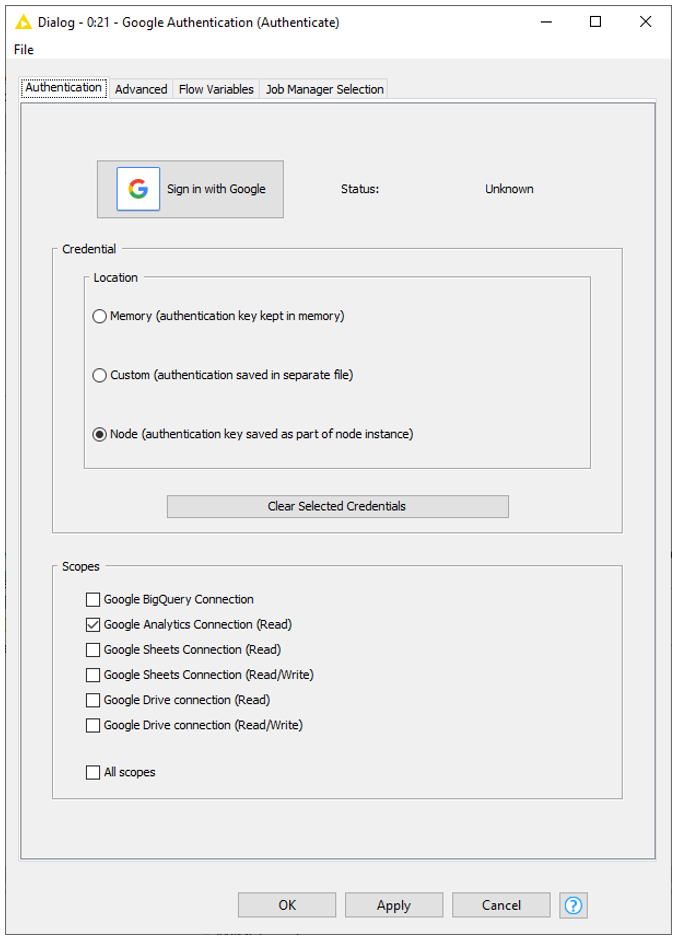
In the node configuration window, first define whether you want to keep your authentication key in memory, in a file, or within the node. Of course, if you save the key within the node and then export the workflow for other people to use the key will travel with the workflow. So, be careful!
Now select the scope of this Google Authentication. In this case it is to establish a connection with Google Analytics. We ticked the appropriate checkbox.
Finally, click the “Sign in with Google” button, in the top left corner of the node configuration window.
Notice that Google Authentication is performed on the Google site and no password or other account information will remain with the node besides the key.
Establish a Google Analytics Connection
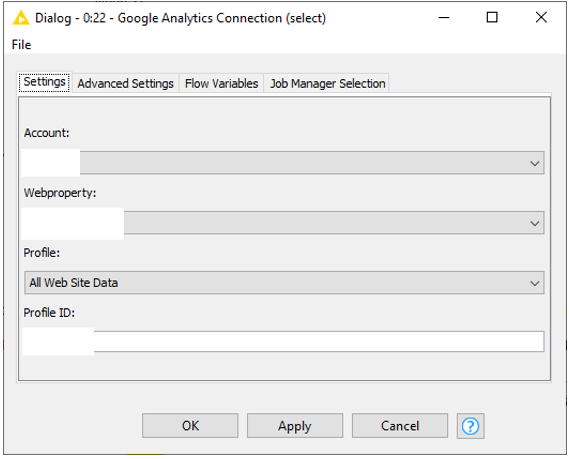
Next, the Google Analytics Connection node establishes the connection to Google Analytics. Open the node dialog to specify the Google Analytics account, web property, profile and profile ID.
If a Google Analytics account is associated with your Google account and if the Google Analytics account already contains web properties, then the Analytics account, web property list, and related data are automatically uploaded in the configuration window of the Google Analytics Connection node. You then just have to select the web property of interest to your report.
Once the node is executed successfully, the connection to the Google Analytics API for the selected web property is established.
Define Query with Google Analytics Query Node
Finally, you can use the Google Analytics Query node to define the query and load the results from Google Analytics into your KNIME workflow.
The query as well as all query parameters are specified in the configuration window of the Google Analytics Query node.
Select Dimensions and Metrics
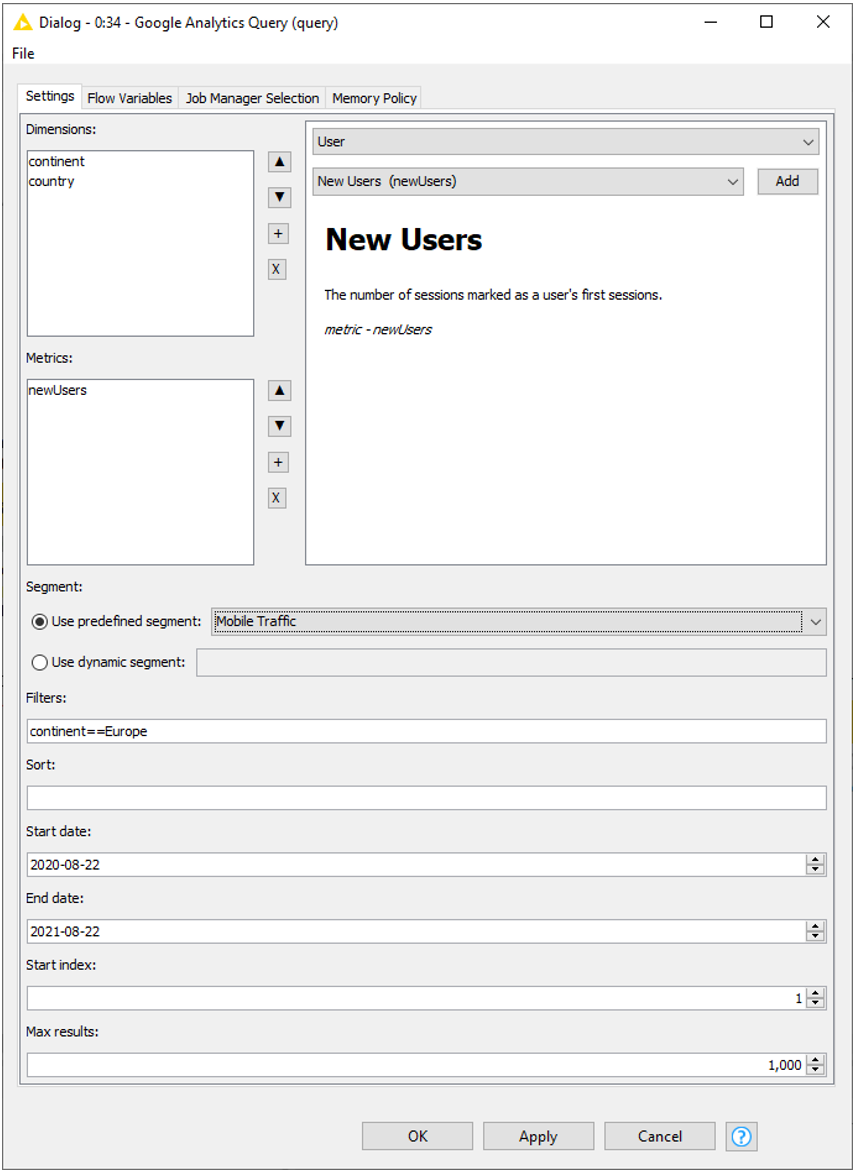
The dimensions and metrics can be selected in the top right part of the configuration window. There, in the Settings tab, two dropdown menus show the categories and the related set of metrics and dimensions.
Dimensions are classes such as full referrer, session count, keywords, country, operating system, and much more. Metrics are aggregations of data such as page views, users, new users, bounces, adsense revenues, etc. on the selected dimensions.
Dimensions and metrics can be added to the query via the “Add” button on the right and they will appear in the respective list on the left. Use the arrow buttons to decide their order in the output table, the “+” button to add more dimensions and metrics, and the “X” button to remove them.
For instance, if “operating system” and “browser” are specified as dimensions and “users” as metric, then each value represents the sum of users for the given combination of operating system and browser. For country as dimension and page load time as metric, the resulting value is the average page load time for users of that country.
From the “Geo Network” category, we selected and added to the query dimensions “continent” and “country” and from the “Users” category the metric “New Users”. This translates into extracting the number of new users (metric) coming to our web property from each continent and country (dimensions).
Such dimensions and metrics apply to the full basis of the web traffic, all users, all views, all likes, and so on. The data domain, however, can be restricted either via Segments or via Filters.
Define a Segment
Segments filter the data before the metrics are calculated. The corresponding dropdown menu in the node configuration window offers predefined segments to choose from, e.g. new users, returning users, paid traffic, mobile traffic, android traffic, etc ... We selected “mobile traffic”, which means extracting the number of new users (metric) coming to our web property from each continent and country (dimensions) via mobile phone.
Set up a Filter Based on Dimensions
At the same time, you can restrict the metric domain by setting up a filter based on the selected dimensions. A filter rule restricts the data after the calculation of the metrics. Possible operations include less than, greater than, regex matches and many more. They can also be combined with a logical AND or OR. For a full list of available operations and details about the syntax please see the node description or the Google Analytics developer documentation.
We introduced “Continent==Europe”, which means extracting the number of new users (metric) coming to our web property from each continent and country (dimensions) via mobile phone and exporting only the numbers related to Europe.
Sort Results
Sorts the results by the selected dimension or metric. The sort order can be changed to descending by prepending a dash.
Specify Start and End Date
Specifies the time frame for the returned data. Both start and end date are inclusive. We introduced start date 2020-08-22 and end data 2021-08-22, which means extracting the number of new users (metric) coming to our web property from each continent and country (dimensions) via mobile phone between August 22 2020 and August 22 2021 included, and exporting only the numbers related to Europe.
Start Index
The API limits one query to maximum 10000 rows. To retrieve more rows the index parameter can be used as pagination mechanism.
Set Max Results
Max Results sets the maximum number of rows that should be returned. The maximum value is 10000.
For more details about the parameters and settings see the Google Analytics developer documentation.
Example 1: Top 100 referring pages to your web site
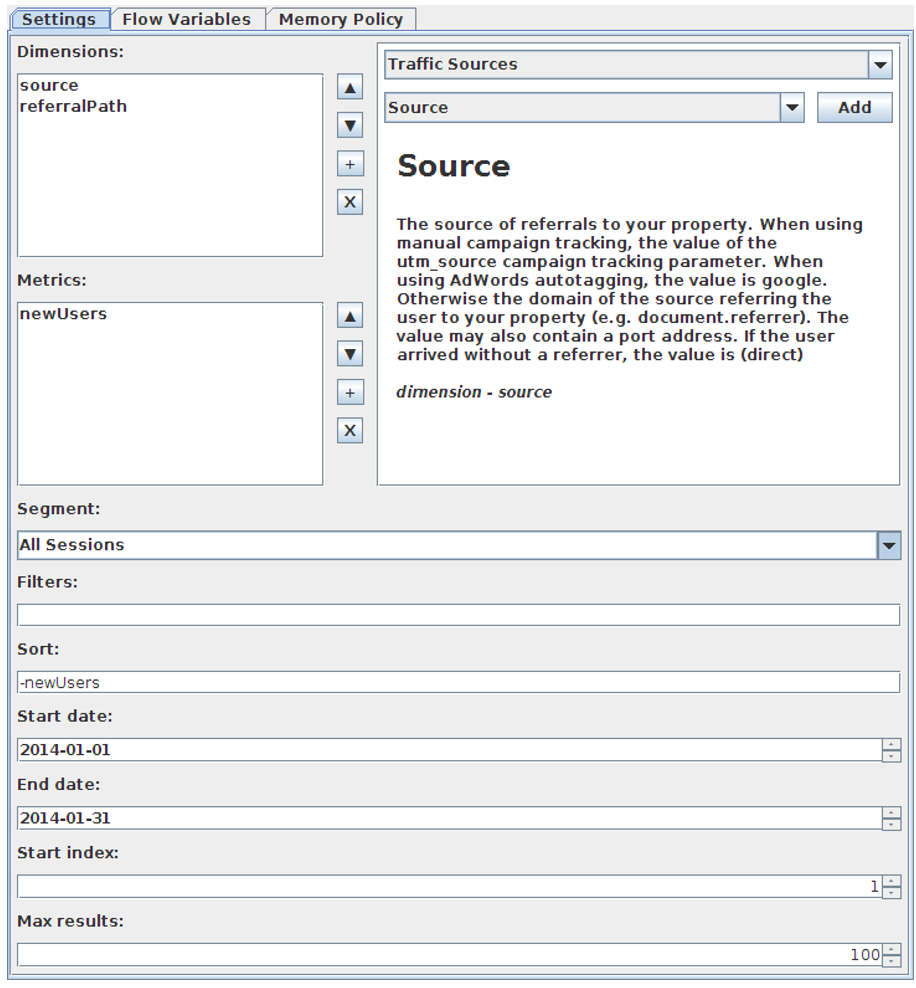
The result of this configuration are the top 100 referrals that brought new users to your website. The dimensions “source” and “referralPath” contain the source addresses and the path of the page from which the new users came to your website. The metric “new users” results in the number of new users for every referring page. By sorting by “new users” in descending order and limiting the max results to 100, we get the 100 most relevant referrals.
Example 2: Top visited topic pages
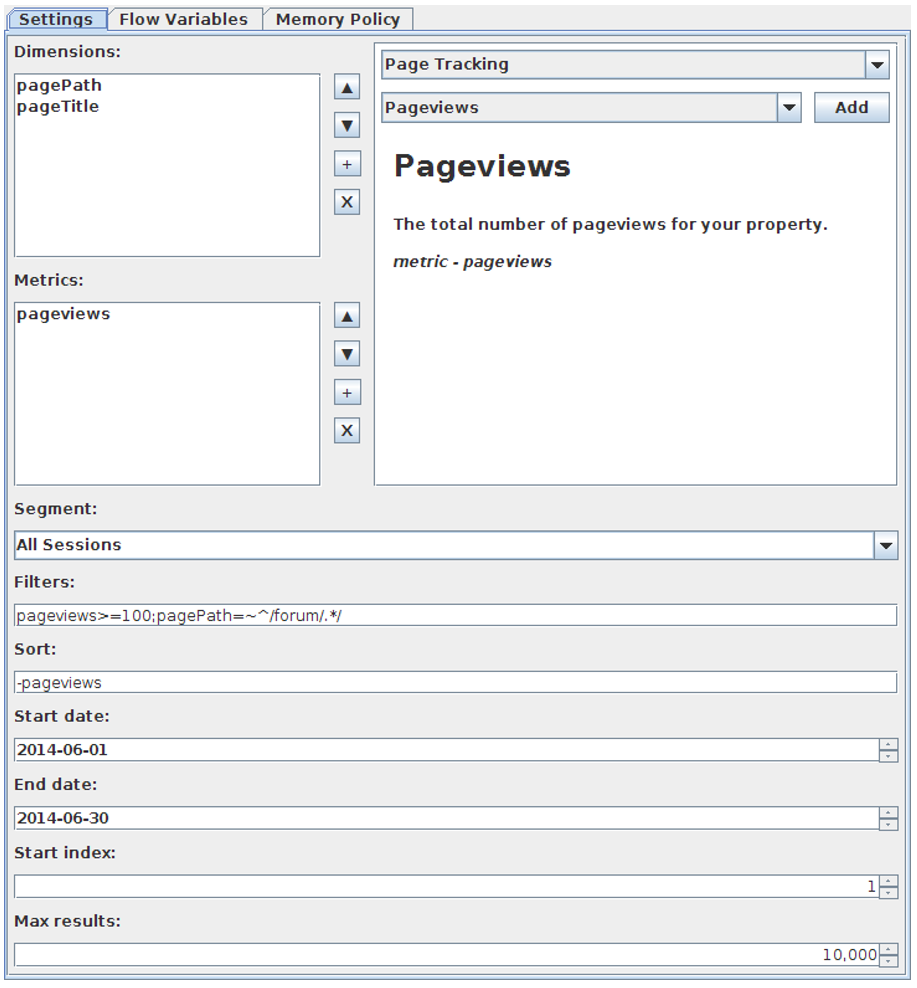
The result of this configuration are the most relevant topics for the selected date (here the month of June 2014) ascertained by total number of pageviews. The dimension “pagePath” is used to list all topics of the web site (it is a forum, all forum topics). The dimension “pageTitle” contains the corresponding topic name.
- The metric “pageviews” counts the number of views for each page
- The specified filters filter out all pages that had less views than 100 and filter out all pages that are not under the forum page
- The result is then sorted descending by page views to get the most relevant pages first
- The specified start and end date keeps only the page views for the selected time