When it came time to choose a topic for my Visual Analytics and Business Intelligence project at Clark University, I knew I wanted to work on something that felt meaningful beyond the classroom. My experience taking part in a Social Innovation program in the summer of 2024 taught me that data, strategy, and business can be powerful tools for social good.
Breast cancer was a natural choice for me. I’ve seen how it impacts lives and I want to understand it better. It’s the second most common cancer worldwide and the number one cancer in women. Early detection saves lives, but diagnosing whether a tumor is malignant or benign isn’t always straightforward. There are still real gaps in speed and accuracy.
I saw an opportunity to apply data science to that problem.
Why I chose to use visual workflows for data science
One of my professors, Dr. Hamid, introduced us to KNIME as a tool for visual programming. I come from a background rooted in writing code. That experience gave me a strong technical foundation, but writing code, line by line, always slowed down the process of building and testing machine learning models.
Yet I was initially skeptical about the visual workflow approach. Could something drag-and-drop really handle the kind of modeling we were doing in Python or R? It turns out the answer was yes.
With KNIME, I could design end-to-end machine learning workflows and eliminate the need for repetitive code.
This simplicity turned out to be a major advantage for our breast cancer prediction project.
I was able to set up, train, and compare decision tree and random forest models to classify tumors as benign or malignant from the breast cancer Wisconsin dataset. I even experimented with neural networks, though those took slightly longer to run.
How I found time to learn
The most surprising part? I completed the entire workflow in a single day. Compared to the weeks I had spent coding similar projects from scratch in the past, the difference was incredible.
I found KNIME’s visual workflow approach intuitive and the hands-on project work quickly taught me more about the platform’s capabilities. So I didn’t really need to spend time learning KNIME, like you would learning to use a coding language, because it was so intuitive to use.
If I did get stuck, I was able to ask questions on the KNIME Forum or browse through all kinds of workflows the community has built and made available for anyone to use on the KNIME Community Hub.
How I put my skills to use in a team
Using KNIME didn’t just save time, it allowed me to focus more on strategy and collaboration. We worked in a team of three on this project, sharing and discussing our work with each other in the cloud — in public spaces on KNIME Community Hub.
We built the final workflow, dividing responsibilities based on our different strengths, to work on data preparation, feature selection, model training, prediction, and performance evaluation.
As we explored the patterns in the data, a few diagnostic indicators stood out. Tumors with higher texture, radius, perimeter, and smoothness were consistently more likely to be malignant. These patterns formed the foundation for our prediction model. These insights could help inform screening strategies or supplement what radiologists are already seeing in imaging.
From student to service marketing analytics intern at Hologic, Inc.
My breast cancer prediction project earned our team second place in a university competition, and we caught the attention of one of the judges, a cancer researcher, who was interested in our AI approach.
He connected me with a researcher so I could tour the labs at Hologic, a company known for their advancements in breast cancer screening. And, by coincidence, the very same company where I had already secured an internship. This summer, I’m excited to join Hologic, Inc. as a Service Marketing Analytics Intern.
From newbies to masters in six months
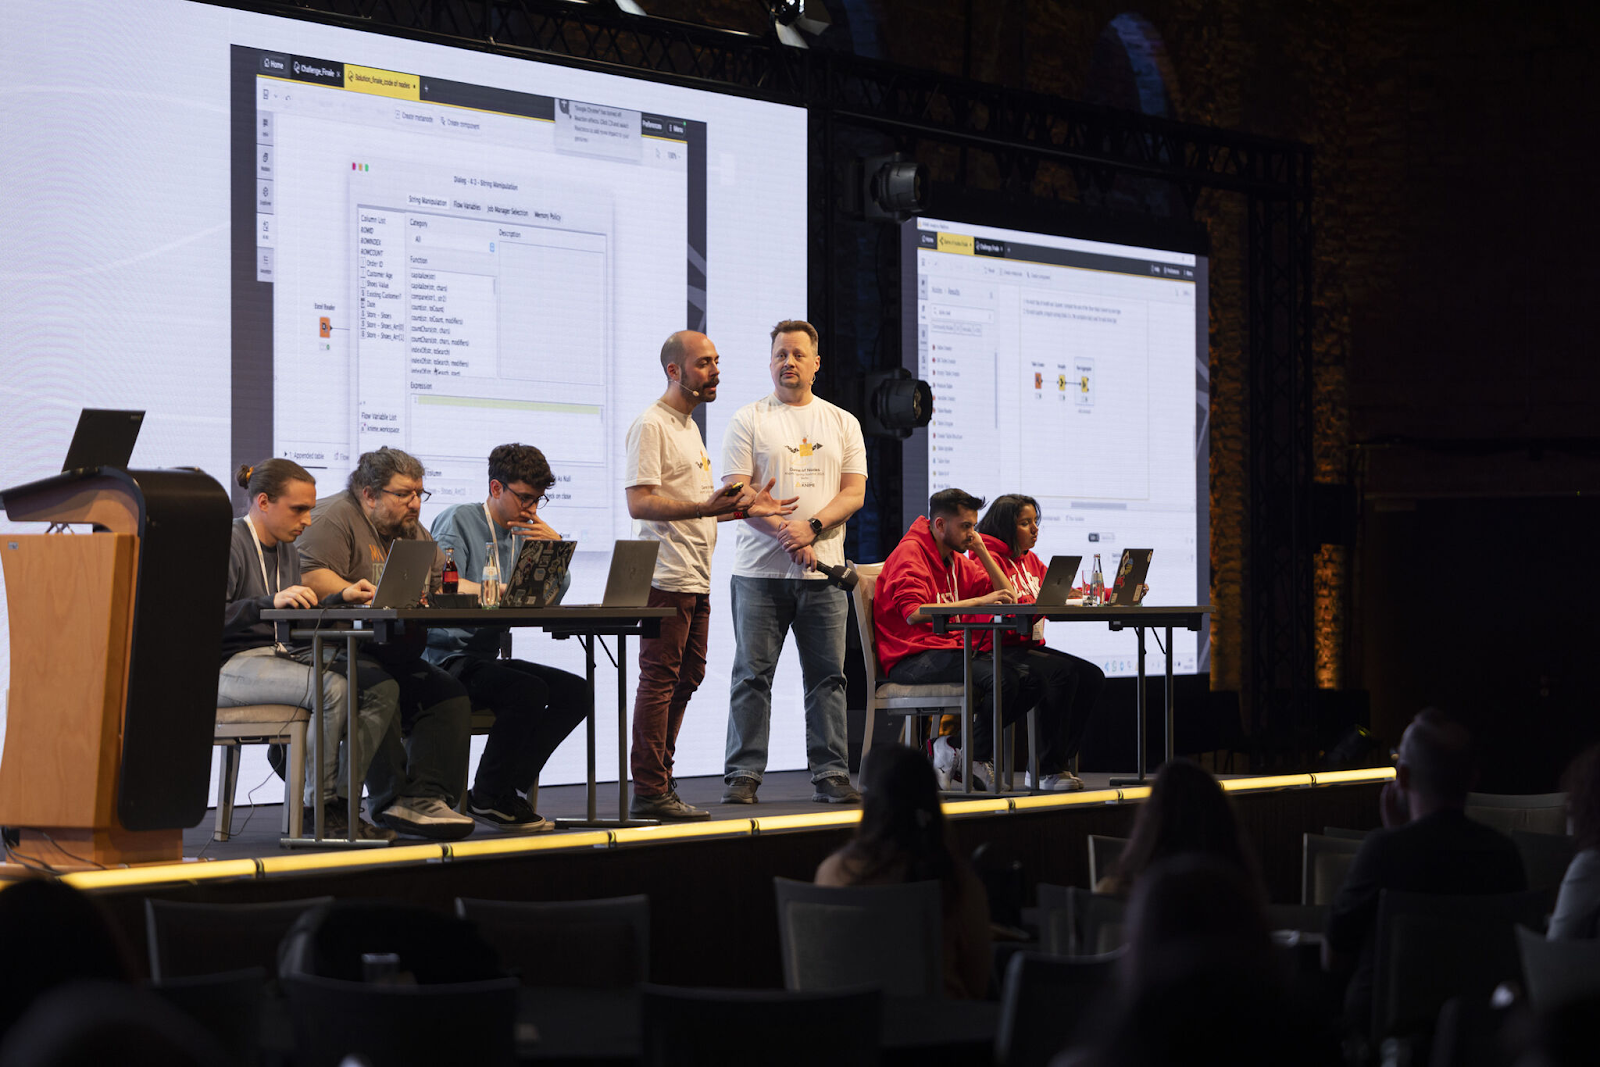
Despite only having used KNIME for six months, at the beginning of 2025, I teamed up with a friend, Shubham Suman, to take part in the KNIME Game of Nodes, an international data science tournament. The competition is open to students and professionals to tackle different data challenges. We ended up getting through to the championship round to compete live at KNIME Spring Summit 2025, in Germany.
“To be honest, we didn’t expect to get that far,” said Shubham. “We were just curious and wanted to explore KNIME beyond classes.”
From learning to teaching and leading in the real world
Beyond my coursework, I’ve had the opportunity to serve as a teaching assistant for an AI and data science summer course geared toward working professionals. Helping others learn how to navigate data challenges has deepened my own understanding. I’ve been especially excited to see how accessible tools like KNIME can open doors for learners at all levels.
At Clark University, I also serve as the vice president of Women in Business. A big part of that role is creating spaces for students (especially international women like myself) to connect with mentors, hear from women leaders, and feel empowered in industries where we’re still underrepresented.
Looking ahead: Where data science can take me
As I approach the final months of my university degree, I’m excited about what’s next, whether that’s pursuing more projects in healthcare analytics, contributing to AI innovation, or simply continuing to find smarter, faster ways to turn data into insight.
KNIME helped me shift from writing code to building visual workflows — without sacrificing depth or accuracy. It’s not just a tool I used for class. It’s something that’s helped shape how I think as a data scientist and how I collaborate as part of a team.
Not sure where to start? Take our data personality quiz and we'll connect you with the best resources to learn based on your strengths and interests.
Would you like to share your skills journey? Tell us about it here and have your story featured here on the KNIME blog.