
In surveys about the most-used tool for data analysis Excel always comes in as one of the most commonly used tools. It is taught in schools and used by countless companies. What you may not know, however, is that anything you can do with Excel you can also do using the nodes in KNIME Analytics Platform! This post is dedicated to getting you started if you already use Excel and want to migrate to KNIME Analytics Platform.

We will be using historical weather data from Berlin. These measurements can be downloaded from the Deutsche Wetterdienst. To be more specific, we took most recent measurements from the "Berlin-Tempelhof" weather station, from September 2014 to January 2016.
Before we proceed: one short disclaimer. Here we describe only some of the possible options; both tools offer more and there is usually a variety of solutions for the same task.
To get started the file needs to be read by the respective tool.
In Excel: Rename the file to *.csv and double-click it to open it. Excel automatically detects the columns and their types.
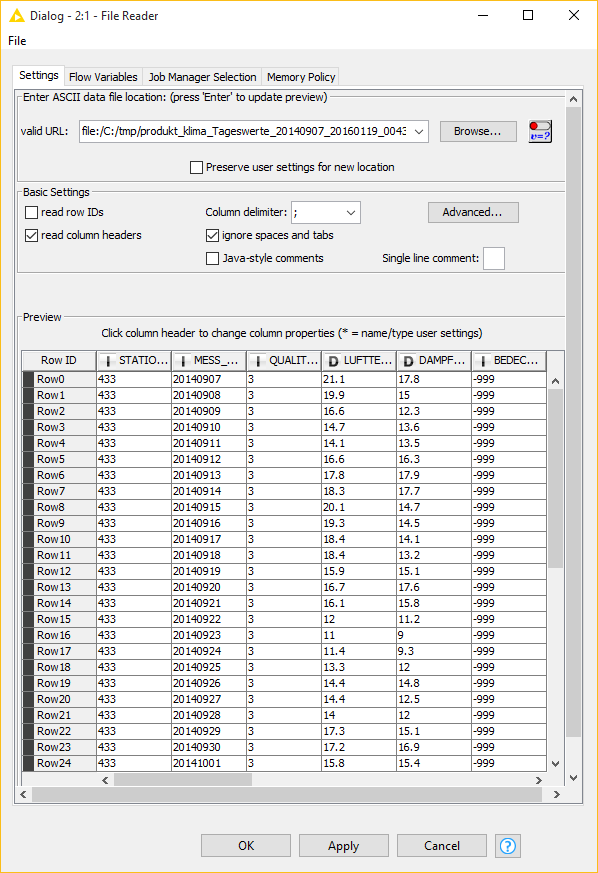
In KNIME Analytics Platform: Create a new workflow, select the file and move it to the workflow by Drag&Drop. A "File Reader" will appear, showing the following dialog. Please make sure you select "read column headers" and specify “semicolon” as the column delimiter. The "File Reader" now automatically detects the columns and their types.
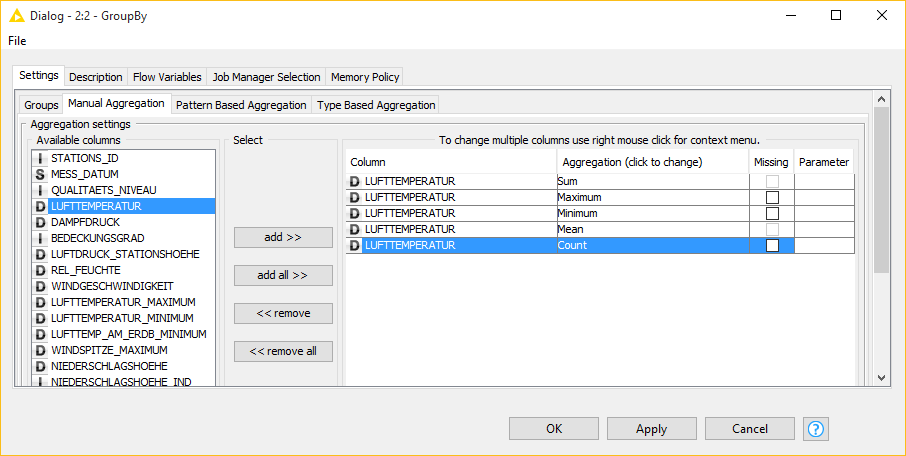
One of the first things you might want to do are basic aggregations or statistics of your values. Examples of such Excel functions are SUM, MAX, MIN, AVERAGE and COUNT. They are all covered by the "GroupBy" node. To calculate them on the full column, leave the Group columns empty and select the following aggregations methods: Sum for SUM, Maximum for MAX, Minimum for MIN, Mean for Average and Count for COUNT as shown in the configuration dialog. If you want to apply these calculations to only some of the values, you might want to filter the table before, using the "Row Filter" or the "Rule-Based Row Filter" node.
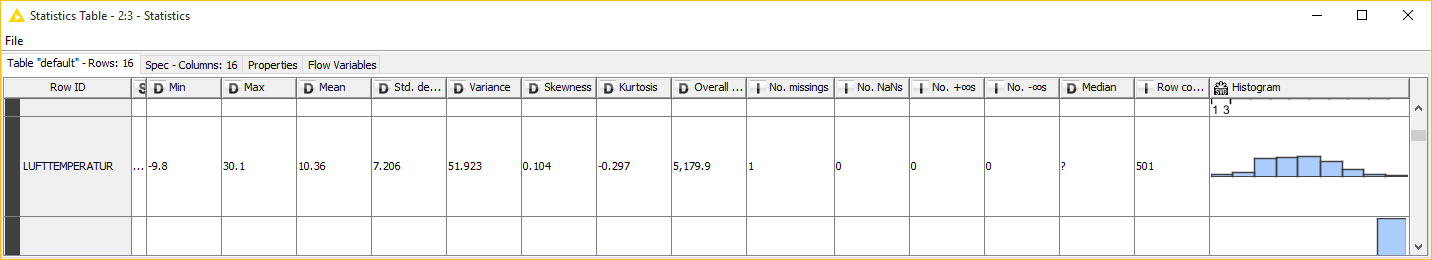
You can achieve the same aggregations with the "Statistics" node. Connect it to the "File Reader", execute it and open the second outport. It contains the Overall Sum, the Min, the Max and the Mean of all numerical columns.
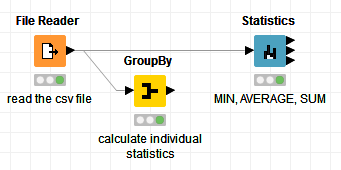
The three nodes in the workflow above are used to read the file and calculate the statistics.
Up next is how to calculate the average temperature per month. First we need to convert MESS_DATUM into a date. The format of the date is yyyymmdd (e.g. 20160116 stands for january 16, 2016). In Excel use the Text to Columns function (in the Data tab). Go to the third step of the "Convert Text to Columns Wizard" and select "YMD" for the column. In KNIME Analytics Platform, the node "String to Date/Time" converts the date into the correct Date and TimeCell, with the Date format: "yyyyMMdd". In the KNIME platform, the date format can be set to your specific needs, while Excel provides only a number of predefined formats.
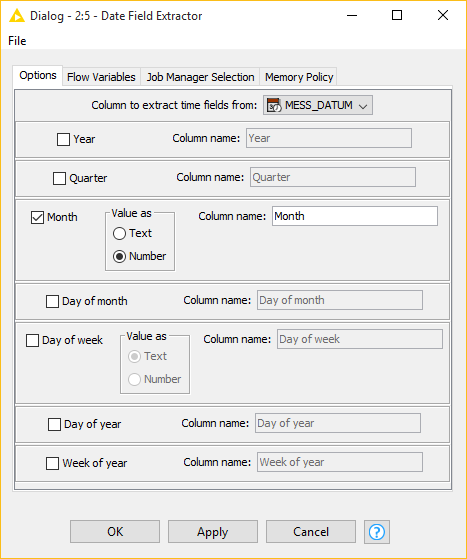
To find the month for the date, the Excel function "MONTH" returns it as a number. The corresponding KNIME node is the "Date Field Extractor". It also covers the following Excel functions: DAY, YEAR, WEEKNUM. The partnering node "Time Field Extractor" covers the extraction of time values as HOUR, MINUTE, SECOND.
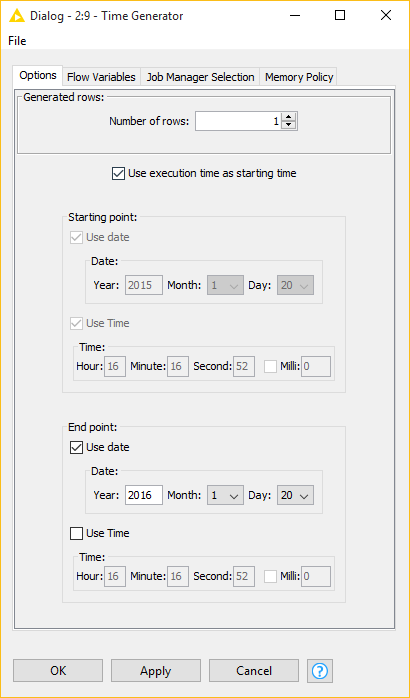
The NOW function returns the current date and time in Excel. Using the "Time Generator" node the current date and time can also be generated in KNIME Analytics Platform. Configure it to generate one row only and check the "Use execution time as starting time" box. In case you want to achieve the current date only, like the Excel function “today”, deactivate the "Use Time" checkbox. A small hint here, if you want to append this value to all rows of your data table, use the "Cross Joiner" node to combine them. Wrapping up: the Excel Today function is generated in the KNIME platform with the "Time Generator" node configured as below.
And now back to our final task of calculating the mean temperature per month: In Excel we need a new mini table containing all the months. We can then calculate the average per month by applying the AVERAGEIF function as shown in the screenshot below.
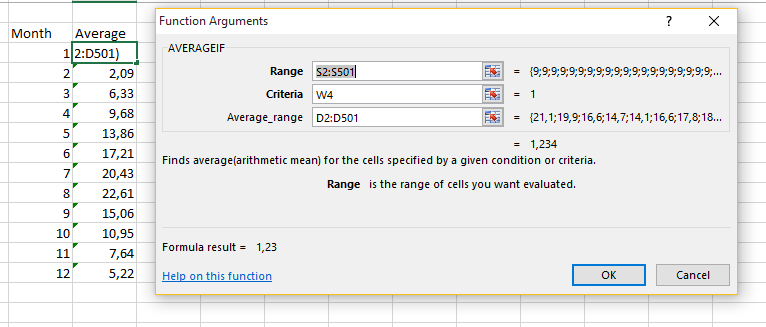
In KNIME Analytics Platform the "GroupBy" node is used for the calculations. Select the Month column under Groups and the Mean of the LUFTTEMPERATUR column under Manual aggregations. Similarly, those nodes can also be used for COUNTIF(S) or AVERAGEIF(S).
Afterwards, you might want to use the "Round Double" node for rounding. It covers the following Excel functions: ROUND, CEILING, FLOOR.MATH, ROUNDDOWN, ROUNDUP, FLOOR, and INT. The same functions are also covered by the "Math Formula" node.
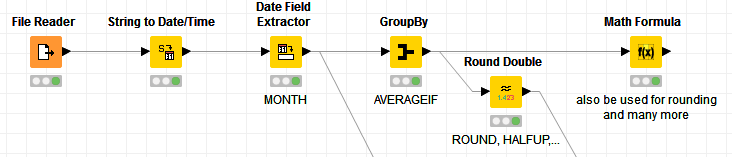
The following workflow demonstrates how the mean temperature per month is calculated and rounded.
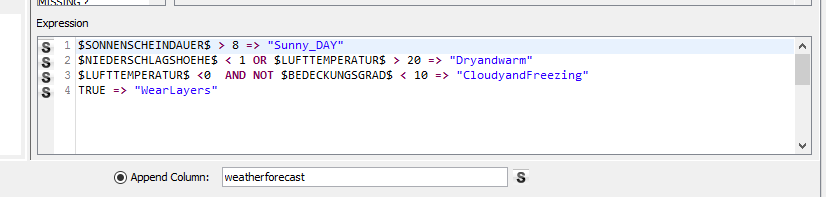
What we want the weather channel to give us most is obviously a forecast for nice weather! This always depends on multiple criteria. To create the relevant rules, Excel offers the logical functions of AND, OR, NOT or TRUE. In the KNIME Analytics Platform these kinds of functions can be found in the "Rule Engine" node.
Another node that helps you get started with the migration to KNIME Analytics Platform is the "String Manipulation" node. It covers the Text functions category in Excel. Of course the function names are not exactly the same, but here is a list to get you started for converting your strings: BAHTTEXT converts a number into a string, which is completed by the string function in the KNIME platform. PROPER converts the first letter of a word to uppercase and this is done with the capitalize function in KNIME Analytics Platform. The KNIME version of CONCATENATE is the join function. LEFT and RIGHT extract the first and respectively last k letters of the string. The "String Manipulation" node can cover this with one function only. substr(k) gives you the first k letters while substr(length-k) gives you the last k of the string.
The last function for migrating from Excel to KNIME Analytics Platform is VLOOKUP, which is one of the most commonly used functions. The use-case is that we want to add more information to our list of months with average temperatures. VLOOKUP can be used to search for a key in another column and insert the value of the same row but from a different column. In KNIME Analytics Platform this concept refers to the "Joiner" node. The Lookup_values are the Joining Columns while the Col_index_num can be configured to select which columns should be included. This is specified in the second tab of the "Joiner" dialog.
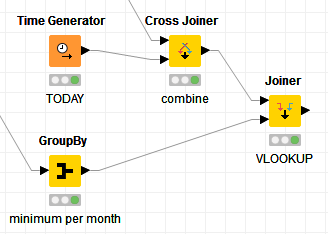
The last snippet of the workflow shows how the Today function and the VLOOKUP can be realized in the KNIME Analytics Platform. The complete workflow can be downloaded from the resources section at the end of the page.
Last but not least, KNIME Analytics Platform offers dedicated nodes for reading and writing your existing xls(x) files. These nodes can be found in the "KNIME XLS Support" extension. And if you find an Excel function you can’t migrate yourself, let us know and we show you how.
PS: Do you want to know what the weather will be like in Berlin at the end of February? Join us at the KNIME Spring summit in Berlin and find out more about KNIME Analytics Platform.
Links and References:
Requirements:
- Extensions: KNIME XLS Support and KNIME Math Expression (JEP)