
When creating new drug candidates, we often know what we want the molecule to do and what not to do. But how can we change the structure of a molecule to increase the desired effect and decrease the unfavorable property?
One tool in the medicinal chemist’s toolbox to accomplish this is the pairwise comparison of closely-related chemical structures across a large dataset by means of the Matched Molecular Pair (MMP)1 analysis. As the structure of the two molecules under consideration only differs slightly, any change in a physical or biological property between the matched molecular pair can more easily be interpreted.
In this article, we want to show you how to perform this type of analysis with KNIME Software using hERG inhibition data. The human ether-à-go-go-related gene (hERG) product is a potassium channel that helps to coordinate the heart's beating. The inhibition of hERG causes fatal cardiac arrhythmia, and several drugs were withdrawn from the market due to this serious side effect.
This task is completed in just three steps:
- Data Preparation
- Matched Molecular Pair Analysis
- Visualization and Exploration of the Results
Note. Matched molecular pairs are pairs of molecules that differ only by minor single point changes, called chemical transformation. Because the structural difference between the two molecules is small, any change in physical properties or observed biological effects can be easily linked to this change. The algorithm to identify matched molecular pairs and link them to the distribution of value differences for every transformation was introduced by Hussain and Rea in 2010 (Hussain and Rea 2010) and has become a major tool for analyzing large chemistry datasets.
Step 1. Data Preparation
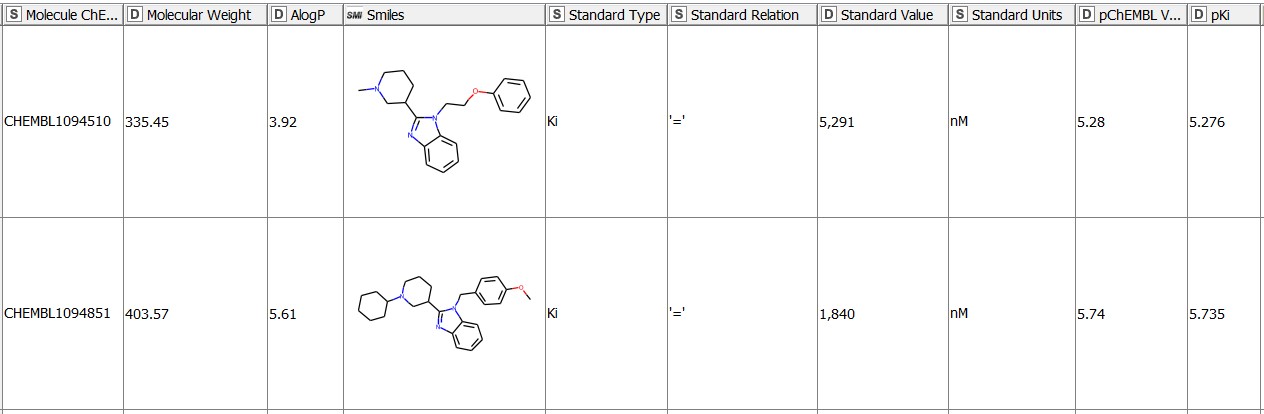
We start with 1675 molecules (gathered from ChEMBL27) with the reported Ki values in nM for the hERG target (CHEMBL240) (Figure 1). The pKi values (negative logarithm of the Ki values) for the entries with an operator2 any other than ‘=’ are missing by default. We fill these in by transforming the Ki values given in nM into a logarithmic scale with the Math Formula node. We then use the resulting pKi values in the MMP analysis. We purposefully keep all the qualifiers of the bioactivity data (e.g. = , >, or
Note. Experimental data, especially biological assay data often comes with an operator or qualifier (e.g. EC50 > 100 µM) when the exact value cannot be determined, for example because the substance does not dissolve at higher concentrations or the effect was not observed within the tested concentration range. In such cases, the data often gets excluded from further analysis (like in Kramer 2014). However, this is a loss of information that becomes even more severe the smaller the amount of available data is.
Next, we standardize the chemical structures of the molecules by de-salting, stripping out explicitly defined stereocentres and double bond geometries with the Vernalis KNIME nodes. Last, we filter any duplicates based on the canonical SMILES obtained with the RDKit Canon SMILES node.
Note. ChEMBL is a manually curated chemical database of bioactive molecules with drug-like properties that is maintained by the European Bioinformatics Institute (EBI) of the European Molecular Biology Laboratory (EMBL).
Step 2. Matched Molecular Pair Analysis
We use the nodes implemented by Vernalis Research (KNIME Trusted Community extension) for the analysis. We fragment the molecules using the MMP Molecule Fragment (RDKit) node with the fragment type "Non-functional group single bonds" because it reproduces the fragmentation pattern used in the original publication (Hussain and Rea 2010). Next, we search for the matched molecular pairs within those fragments using the Fragments to MMPs node.
To find the most interesting matched molecular pairs in the dataset i.e., those that occur often and cause a high difference in the effect/property, we need to aggregate all the information of individual pairs. The more often a transformation occurs, the more meaningful and robust the change in property related to this transformation.
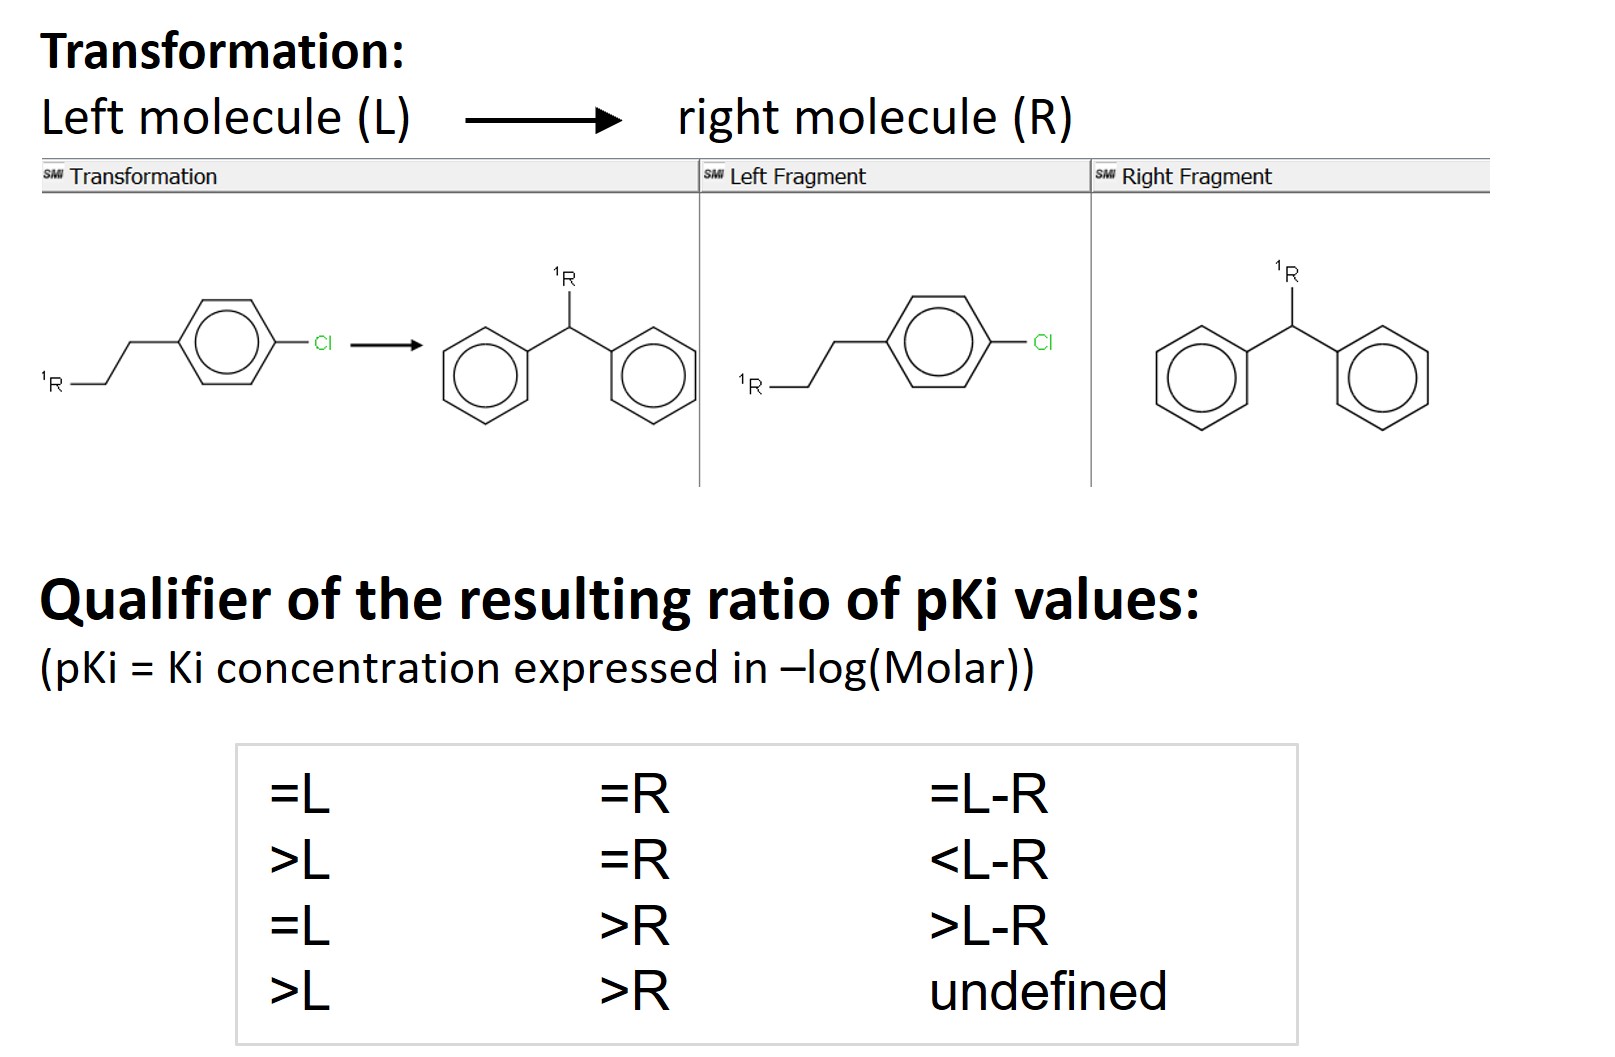
Aggregating means we won’t get a single, absolute value, but a distribution of values for every transformation. We do so by grouping the data based on the SMILES strings of the left (L) and the right (R) fragments participating in the transformation. The SMILES of the left and right fragments are unique, therefore we will avoid any duplicates. We get 31776 matched molecular pairs and for each of them we also aggregate the identifiers and the SMILES strings of all the molecules with this pair, their pKi and logP values. We add a “Ratio_Qualifier” with the Rule Engine node to describe the difference in activity between individual pairs based on the initial qualifiers of the Ki values of the input molecules. We show the four possible possibilities in Figure 2 below.
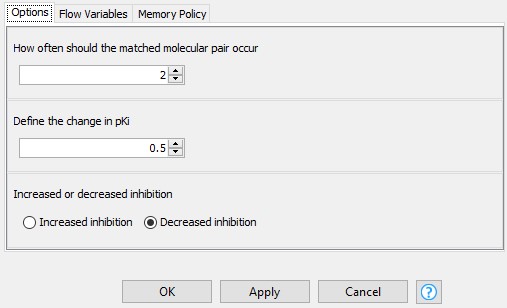
Next, we narrow down the results by excluding the infrequent pairs from further analysis. A transformation that occurs only once is not very meaningful, and doesn’t give a lot of confidence that this is a more universal effect. We would like this process to be interactive, so we allow the user to define the minimum number of occurrences of a matched molecular pair, the change in the median difference in pKi, and the direction of the change in the configuration dialog of the component “Configure the results of choice” (Figure 3). Excluding the pairs that occur only once leaves us with 2050 pairs.
Step 3. Visualization and Exploration of the Results
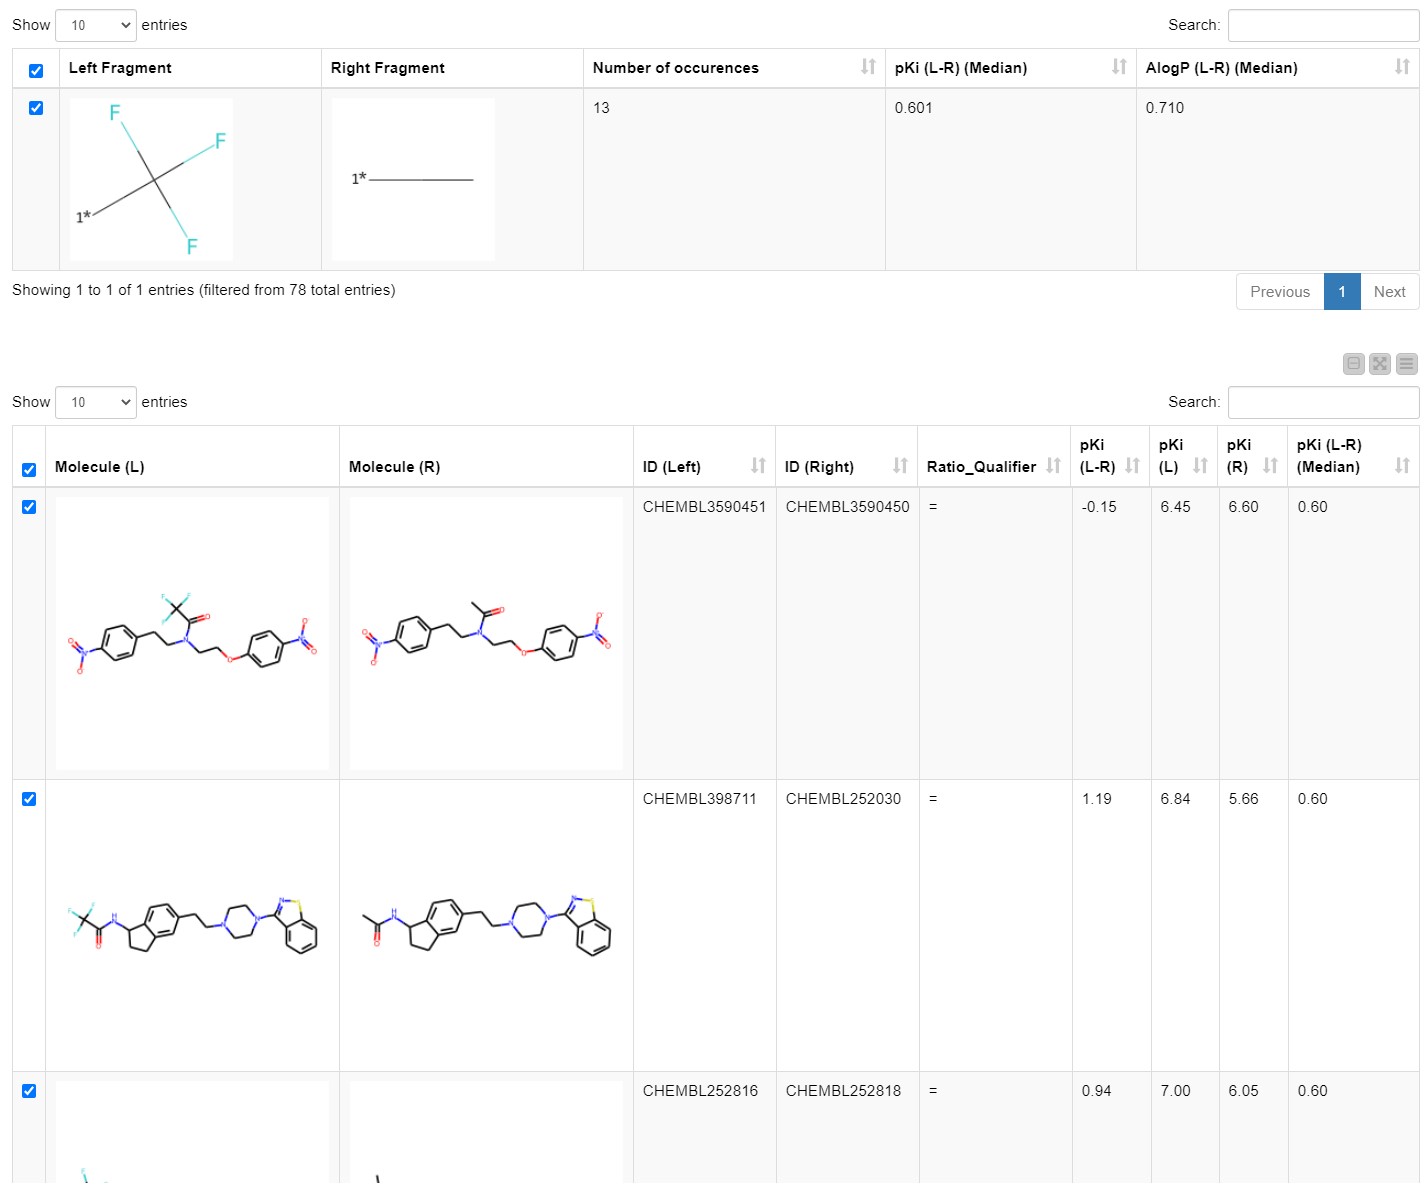
We explore the results by opening the Interactive View of the Investigate MMPs component. The first table shows all the transformations/MMPs that match the criteria set in the previous step. The user can explore them by sorting by number of occurrences, median change in pKi, and median change in logP. Once an interesting matched molecular pair is selected it appears in a one-row table in the middle, which we inserted to achieve a better overview and avoid excessive scrolling.
The details of the chosen transformation appear in the third table underneath. It includes all molecules that match this transformation, their IDs and their pKi values (Figure 4). The first table with all transformations matching the defined criteria as well as the third table with all the details of the chosen transformation are available at the component output.
Disclaimer: we will be using the domain expertise now, so if you are not familiar with the topic, feel free to skip the next two paragraphs and jump to the Wrap up section.
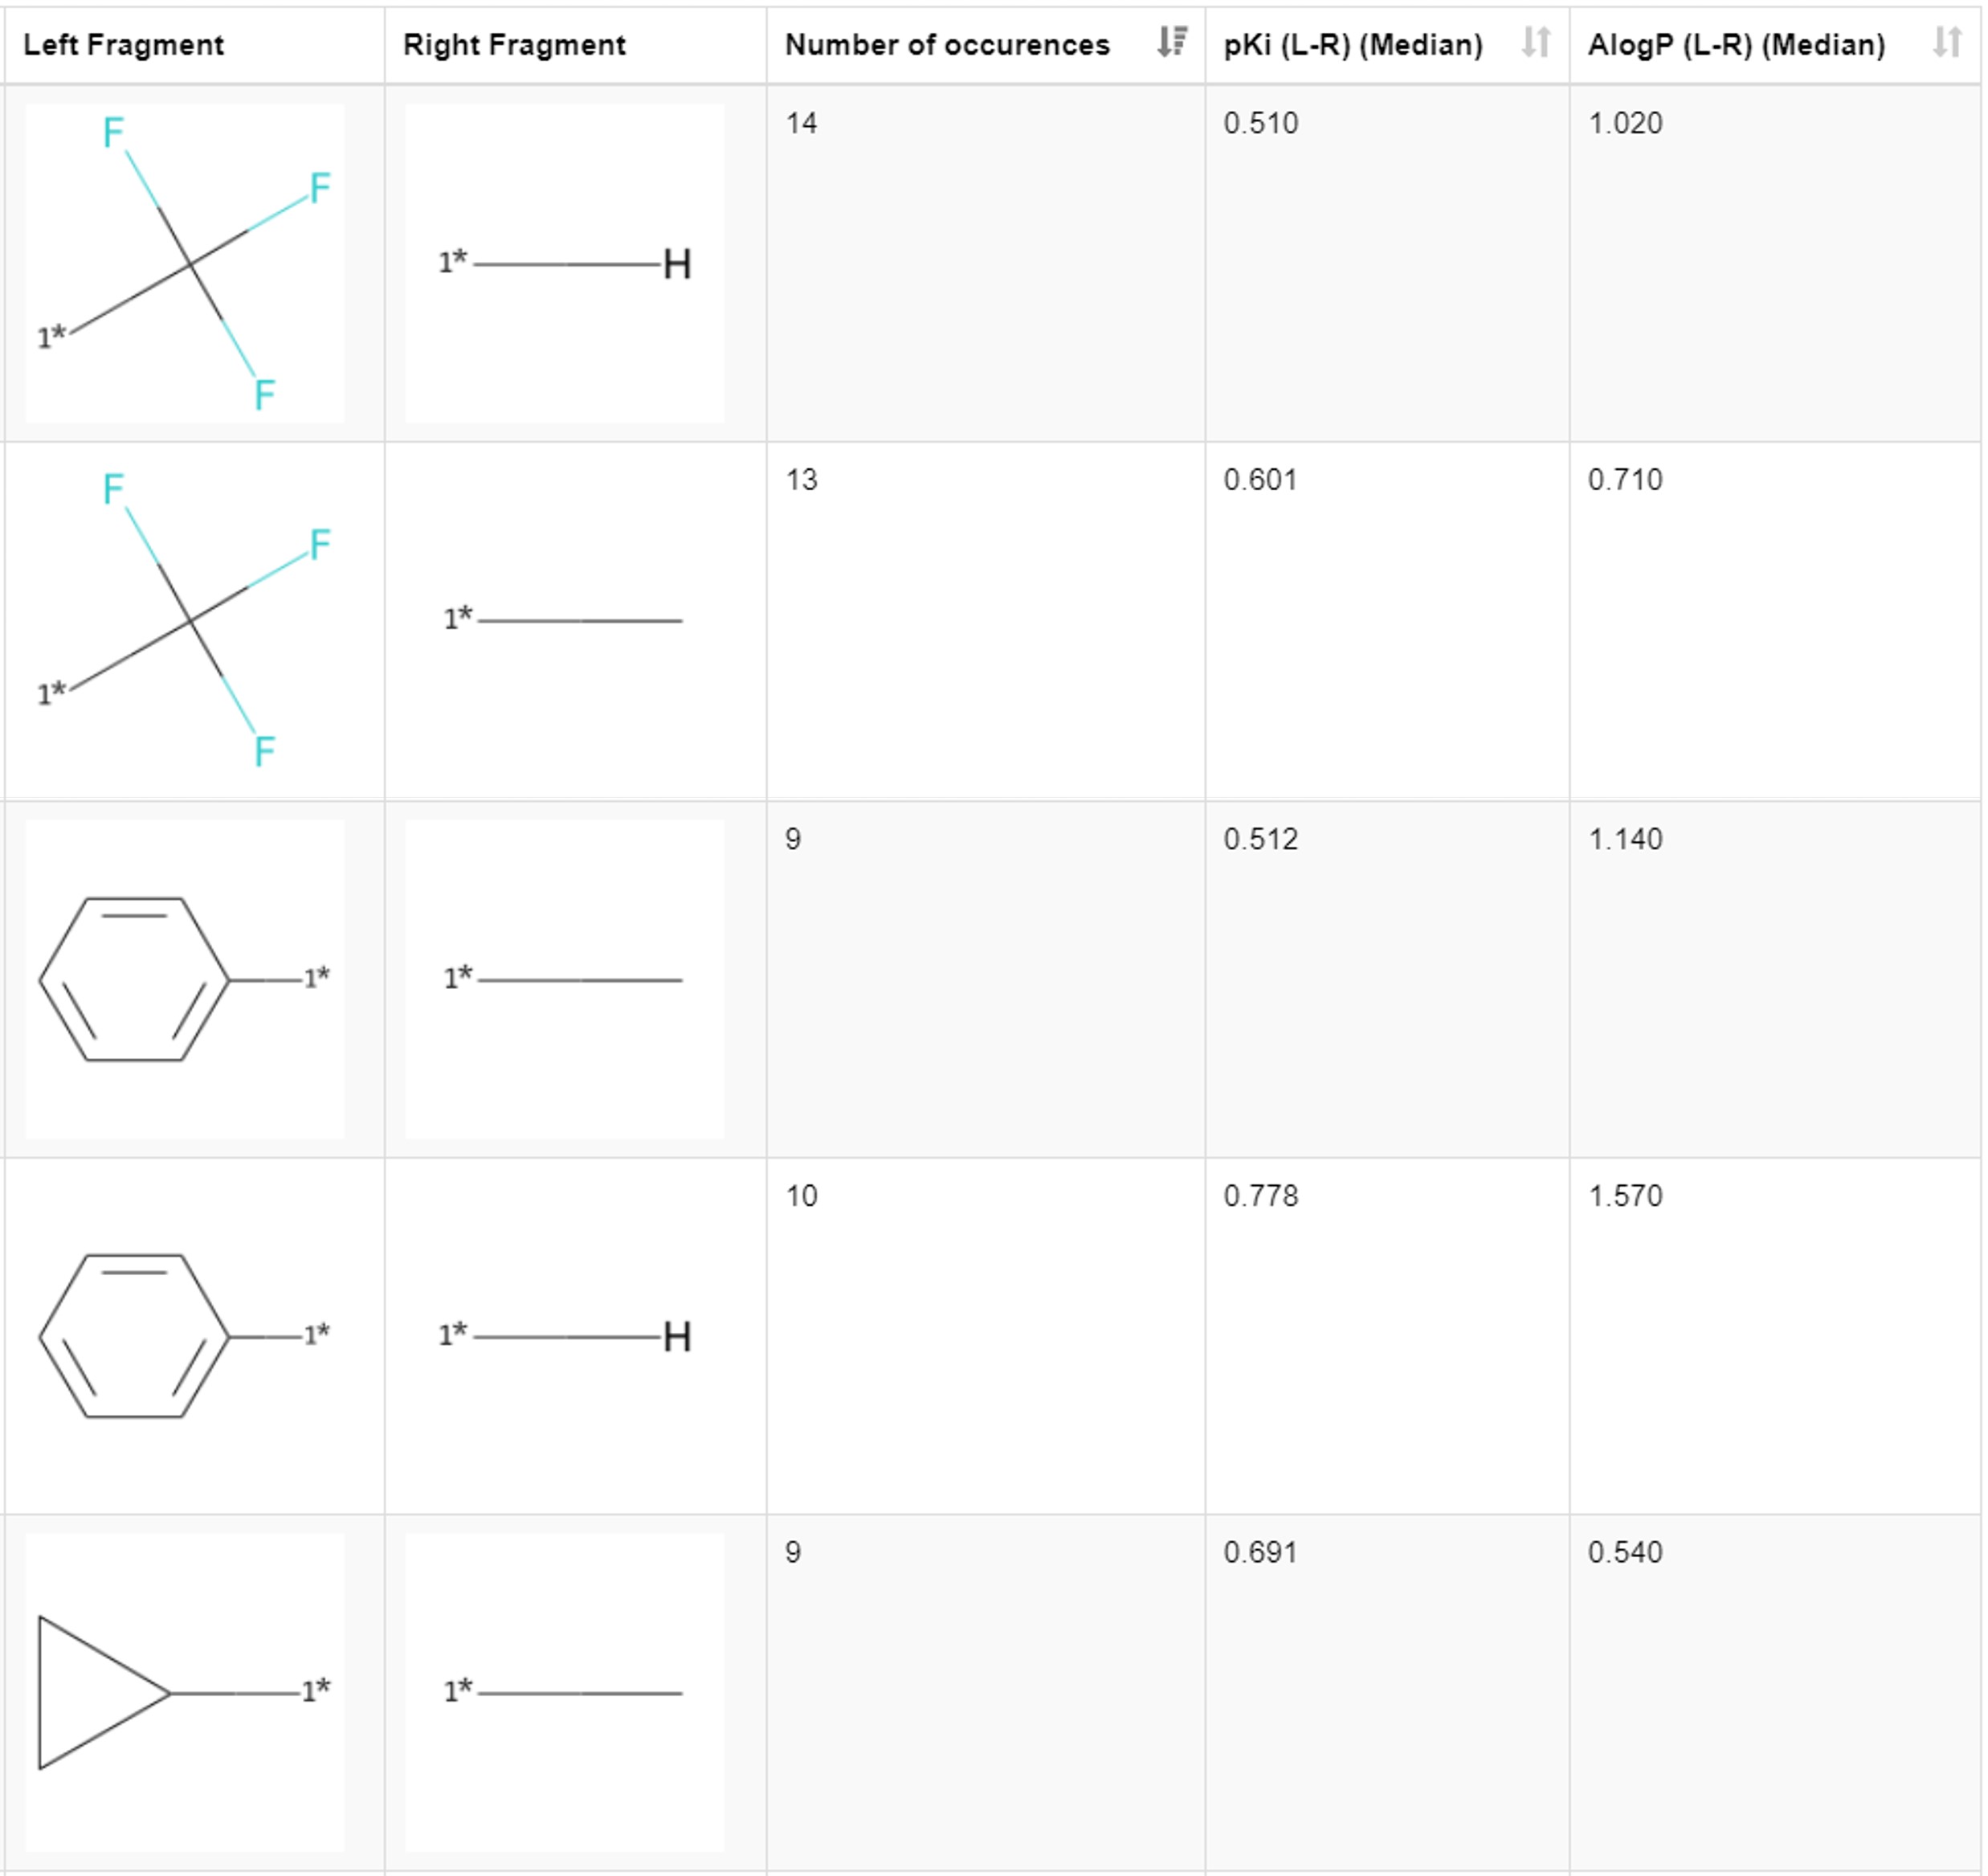
Let’s dig a bit deeper and look at the results from a chemistry perspective. By scrolling through the first table in the view, we find that the introduction of the lipophilic substituents generally increases the inhibition of hERG. We see it in the examples of the matched pairs phenyl ring hydrogen with |𝚫pKi| of 0.778, benzyl methyl with |𝚫pKi| of 0.708, phenyl methyl with |𝚫pKi| of 0.512, ethyl hydrogen with |𝚫pKi| of 0.600, and cyclopropyl methyl with |𝚫pKi| of 0.691. The more lipophilic the introduced group is compared to the present substituent, the bigger the change in the pKi (Figure 5). These transformations are also found in publications (Kramer 2014, Papadatos 2010).
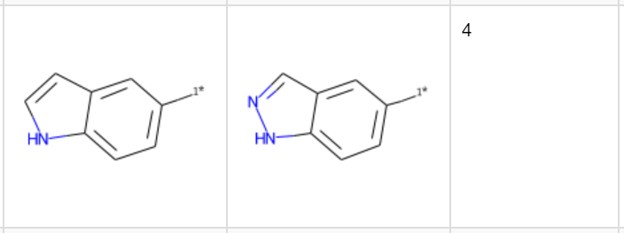
Let’s pick another example not yet reported in the publications cited here. The transformation in Figure 6 includes the introduction of an additional nitrogen. It occurs four times with a median change in pKi of 0.64. Looking at the third table with the details we see that three of the pairs come with a qualifier, indicating that the actual difference/ratio in the binding affinity is probably even higher than the value indicated. Therefore, it might be worth including this transformation in additional testing. Even with the knowledge (from previous studies) that increasing polarity by introducing a sp2 nitrogen reduces hERG binding, this promising pair would have been missed without the detailed view.
Wrapping Up and Further Example of MMP Analysis
In this blogpost we built a prototype workflow to perform a typical drug discovery use case: MMP analysis in KNIME Analytics Platform. You can download the workflow, Matched Molecular Pair Analysis, from the KNIME Hub and easily adapt it to run it with your bioactivity data. You might like to test the different fragmentation options and then explore the results in an interactive way and share the insights with your colleagues. As a little icing on the cake, we offer you a way to deal with values that come with a qualifier that is not part of the standard MMP analysis. If you are further interested in the topic, you might also want to check the following example workflow on MMP analysis from our partner Vernalis, Simple Matched Molecular Pairs (MMP) Example.
References
Note that the publications might not be open access
- Computationally efficient algorithm to identify matched molecular pairs (MMPs) in Large Data Sets. Jameed Hussain, Ceara Rea. J Chem Inf Model. 2010 Mar 22;50(3):339-48.
- Matched Molecular Pair Analysis: Significance and the Impact of Experimental Uncertainty. Christian Kramer, Julian E. Fuchs, Steven Whitebread, Peter Gedeck, and Klaus R. Liedl. J. Med. Chem. 2014, 57, 9, 3786–3802
- Lead Optimization Using Matched Molecular Pairs: Inclusion of Contextual Information for Enhanced Prediction of hERG Inhibition, Solubility, and Lipophilicity. George Papadatos, Muhammad Alkarouri, Valerie J. Gillet, Peter Willett, Visakan Kadirkamanathan, Christopher N. Luscombe, Gianpaolo Bravi, Nicola J. Richmond, Stephen D. Pickett, Jameed Hussain, John M. Pritchard, Anthony W. J. Cooper, and Simon J. F. Macdonald. J Chem Inf Model. 2010 Oct 25;50(10):1872-86.