A market simulation is a way to model a real world market. Just as real world markets have products, features, brands, stores, locations, and competitive rivals, so does a market simulation. But what makes a market simulation truly realistic are the customers. Simulations can generate tens of thousands of virtual customers designed to mimic the purchase decisions of real world shoppers. Customers evaluate the differentiation offered by each product.
Market simulations provide a way to understand the economic complexities of a market. They are used by academics, students, and business managers to predict how customers will react to change. The change might include a change in price, a change in product assortment, or the emergence of a new competitor. These predictions lead to improved business strategies that increase market share, revenue, and profitability.
"Market Simulation" has now joined the long list of tools available on KNIME Analytics Platform. In this blog, we take a look at the Market Simulation Community Edition of nodes for KNIME that has been developed by Scientific Strategy.
- Example workflows for the Community Edition are available from the Scientific Strategy website.
- The workflow described in this blog post can be found on the KNIME Hub here.
The free Market Simulation nodes can be downloaded directly from within KNIME Analytics Platform by going to File -> Install KNIME Extensions. Expand the KNIME Partner Extensions menu item and click Market Simulation nodes by Scientific Strategy for KNIME - Community.
Underlying Science
Market Simulation is built upon the same principles as Conjoint Analysis and mainstream economics. The simulation uses an Agent-Based Model (ABM) to replicate the decision making process of individual customers.
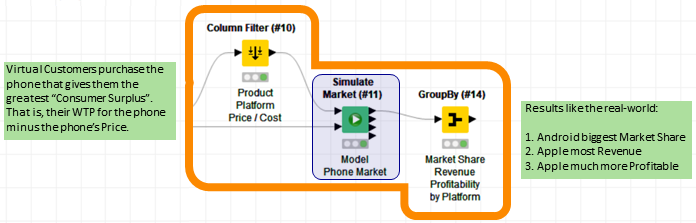
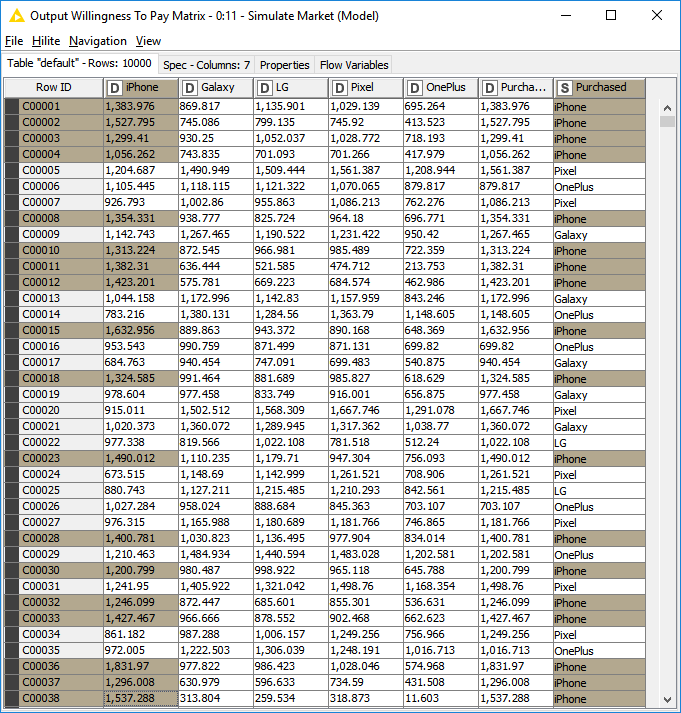
Customers purchase those products that give them the greatest Consumer Surplus – that is, the difference between their Willingness To Pay (WTP) for a product and its price. A customer’s WTP for a product is the sum of the “part-worth” values of its independent features.
Market Simulation on KNIME
The free Market Simulation Community Edition for KNIME is a set of more than 20 nodes dedicated to creating, tuning, and simulating markets. Almost any market can be simulated, although business-to-consumer (B2C) markets are easier to tune.

KNIME Workflow: Android vs iOS
The competitive battle between Android and iOS phones illustrates how the new Market Simulation nodes work on KNIME.
Apple is the sole supplier of iOS iPhones, while Android phones are manufactured and sold by many suppliers. Apple is also the most profitable supplier of phones, with USD 1000+ iPhones, which are more expensive than comparable Android phones.
While Android suppliers are less profitable and generate less revenue, Android phones have a larger overall market share by quantity sold. Many varieties are available, with the price of Android phones ranging from very cheap to very expensive.
A KNIME workflow that simultaneously models all these market characteristics can be easily assembled with these Market Simulation nodes from Scientific Strategy.
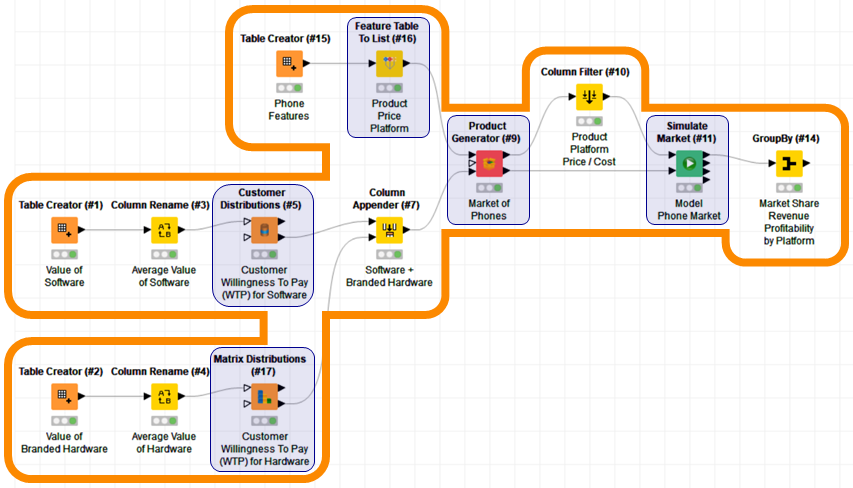
New Market Simulation Nodes
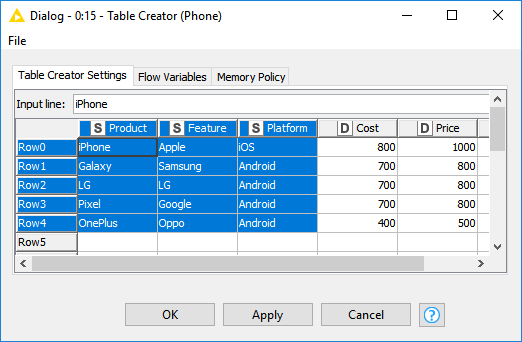
The Android vs iOS workflow creates an Agent-Based Model (ABM) of 10,000 Virtual Customers. The products in the market include:
- Apple’s iPhone
- Samsung’s Galaxy
- LG’s phone
- Google’s Pixel
- Oppo’s OnePlus
The two features that customers most value are:
- Software (iOS or Android)
- Branded Hardware
The prices of the phones range from USD 1,000 (for the iPhone) down to USD 500 (for the OnePlus).The manufacturing cost of the high-end Apple phone has been estimated at USD 800, while the cost of comparable high-end Android phones has been estimated to be only USD 700. While the component costs of the hardware going into each of these phones is about the same, the cost of developing and maintaining the iOS software is higher for Apple. This is because Android software is available for “free”.
Note that this workflow is only meant to illustrate how the KNIME nodes can be used to simulate a market. No specific product SKUs or market channel has been selected for simulation, nor has the model been tuned to make accurate predictions. While the Community Edition nodes do include these capabilities, they have not been illustrated here.
Value of Software
The part-worth value that individual customers have for iOS software is different to their value for Android software. Android software provides users with more options, while iOS software has a better reputation for reliability.
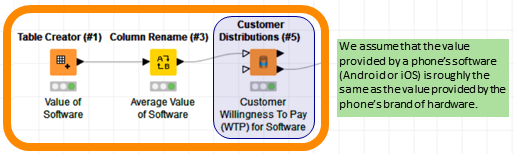
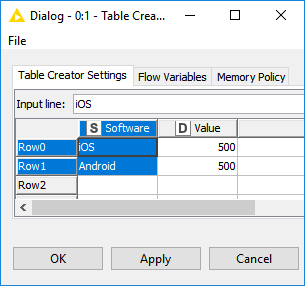
However, the average value for Android and iOS is about the same and has been set in the simulation to USD 500. Because there is no difference in this average value, the software is said to offer no Vertical Differentiation.
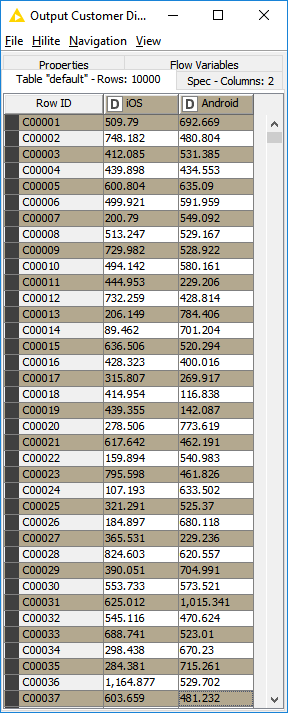
The new Customer Distributions node then converts these average values into two distributions. Each distribution contains the individual part-worth values for the 10,000 customers in the market.
Value of Branded Hardware
The part-worth value customers have for branded hardware approximates the value of software at around USD 500. But in this case, the higher value for Apple’s hardware (USD 700) reflects the superior brand power of Apple. On the other hand, Oppo’s low value (USD 200) reflects the inferiority of its phone’s camera, processor, and memory.
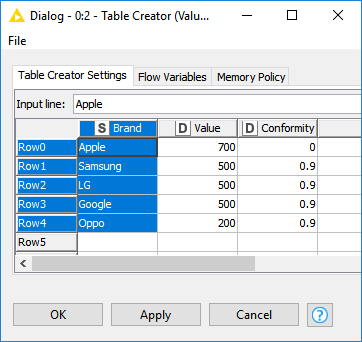
The new Matrix Distributions node works like the Customer Distributions node by generating customer distributions of part-worth values for each type of branded hardware.
But here the Matrix Distributions node also considers the degree of similarity between features. In this case, many customers believe that “all Android phones are the same”. This belief is reflected in the high levels of “Conformity” between the Android phones but not the Apple phone (conformity is set between 0.0 and 1.0). This conformity means that Apple has Horizontal Differentiation with respect to Android phones.
Features to Products
The part-worth values of software and hardware need to be combined into overall Willingness To Pay (WTP) values for the products. This is achieved with two new nodes:
- Feature Table To List node
- Product Generator node
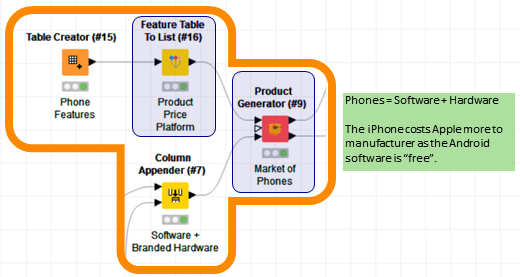
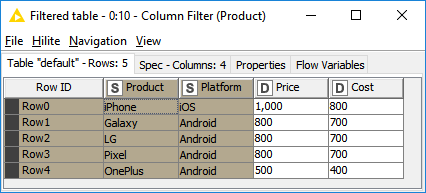
The upstream Table Creator node describes all the features that make up the products, along with the manufacturing cost and price of each.
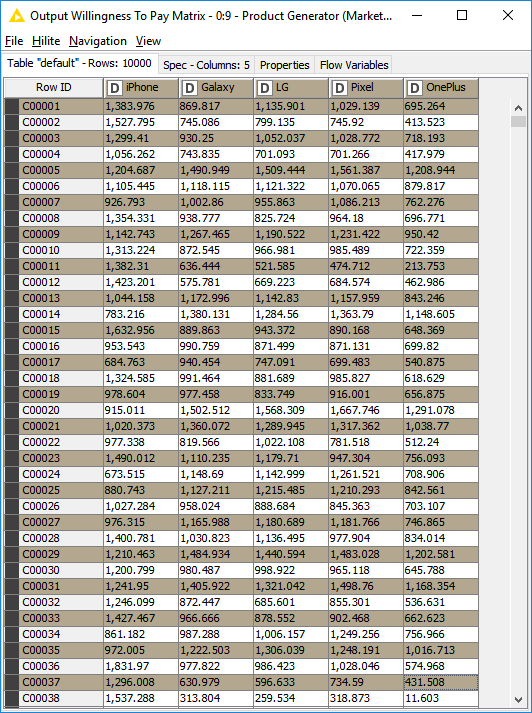
The Product Generator node creates a final “Product Array” and “WTP Matrix”. This is all the data needed to run a predictive simulation of the market.
Market Simulation
The Simulate Market node is the last new node in the workflow. It takes both the Product Array and WTP Matrix and calculates the Consumer Surplus for each customer (recall that Consumer Surplus equals WTP minus price). The Simulate Market node then predicts which product each customer will purchase (or “No Sale” if the customer finds none of the products attractive).
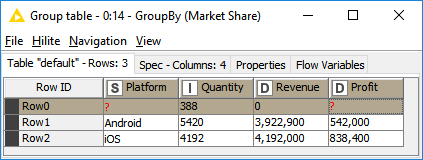
Simulation Results
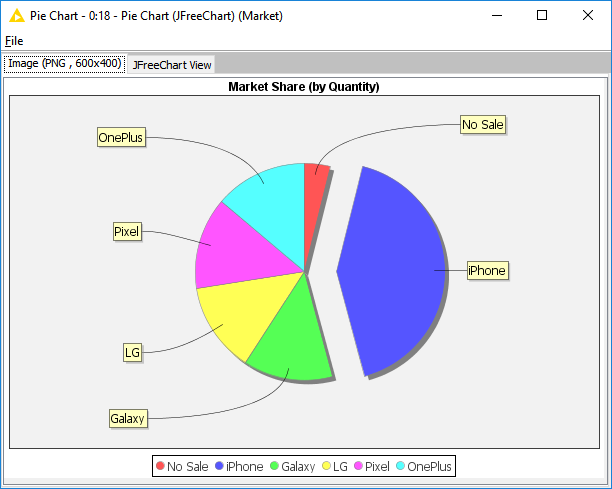
The results from the Market Simulation reflect the results from the real-world market:
- Android has a bigger overall market share (by quantity sold) than the iPhone
- Apple generates the most revenue
- Apple is also much more profitable than all Android phones combined
Conclusion
Market Simulation works because the differentiation offered by each product has been quantified. On average, customers perceive no difference between Android and iOS software. Hence the software provides no Vertical Differentiation. However, the fact that individual customers disagree whether Android or iOS is better means that the software does provide Horizontal Differentiation.
The differentiation provided by the branded hardware is also a factor. While the Apple brand does offer some Vertical Differentiation, what’s more important is the fact that the Android hardware is undifferentiated (customers believe “all Android phones are the same”). This leads to greater rivalry among the Android manufacturers which drives down the price.
When all types of differentiation are quantified the dynamics of the entire market can be modeled.
Data Sources
The input parameters for this Market Simulation are loosely based upon the range of phones available in the USA. While Chinese-made phones have a large global market share, customers only make purchase decisions from the range of products available in their own geography.
The input data for this analysis was inspired by the CNET article “Why your iPhone and Android phone will cost more in 2019” by Jessica Dolcourt (2-Jan-2019):
Cost estimates were inspired by the analysis by HiSilicon found in the article: Economic Research Working Paper No. 41: Intangible assets and value capture in global value chains: the smartphone industry by Jason Dedrick and Kenneth L. Kraemer (Nov-2017):
About the Author
Ted Hartnell is the developer of the free Scientific Strategy Market Simulation (Community Edition) toolkit. Ted is also the founder of an eCommerce Optimization company called Revenue Watch. The company’s flagship product, RADAR, is built upon the same Market Simulation technology as the free Community Edition.
Ted has engineering and law degrees from Sydney University, and an MBA from UC Berkeley. Ted’s post-graduate market science research was conducted at Dartmouth College. The first Market Simulation tool Ted developed was at the Haas School of Business in 1999. He has spent much of the last 20 years improving it. He has also worked in the Internet of Things industry for Intel, at a Goldman Sachs subsidiary developing Wall Street’s high-frequency trading platforms, and in price optimization.
About Scientific Strategy

Companies suffer from hyper-competition, brand proliferation, cannibalization, and margin erosion. Market Simulation provides a way to understand market complexity and identify winning strategies.
Scientific Strategy is a trusted KNIME technology partner. Their Market Simulation toolkit was built using Data Analytics and Artificial Intelligence (AI). The Community Edition running on KNIME Analytics Platform is freely available for you to download and use today.