
As your organization grows, so does the complexity of your reporting. More teams. More data. More expectations. And often, more spreadsheets.
It gets harder to keep everything consistent. For example, when tracking budgets across departments and years. Team by team. Spreadsheet by spreadsheet. And each update feels like starting from scratch.
This process often works, but it can be time-consuming to update, fragile to maintain, and hard to scale.
That’s where a more sustainable workflow can make a difference.
Why go beyond spreadsheets?
Spreadsheets are familiar and flexible, but as your reporting needs grow, they can become harder to manage.
If you’ve ever spent hours updating tabs, double-checking formulas, or trying to explain your logic to someone else, you’ve already felt the limits.
That’s where visual workflows come in. Instead of building everything in one place, you break your logic into clear, reusable steps. Each part is modular and transparent, so it’s easier to update, easier to share, and easier to trust.
You don’t need to replace your current tools. This mini-series simply shows you another way: one that’s visual, repeatable, and designed to scale with you.
Let’s rebuild your reporting workflow together
To make reporting workflows more sustainable, we’ve created a free email course designed specifically for finance professionals.
You’ll get one short lesson per day, each focused on helping you build a reusable budget tracking workflow using a visual, guided approach. The series is designed to fit into your day, about 15 minutes at a time.
Here’s a quick look at the email from Day 3, where you’ll start building your core workflow step by step, from adding your first node to connecting the logic together visually.
The goal: Help you move from ad-hoc reporting to something that’s more repeatable, explainable, and scalable.
What you’ll learn
Each lesson builds on the last, guiding you through a real-world finance scenario: tracking budget usage across multiple teams and years, all with a workflow you can reuse, share, and scale.
Day 1: Set up your workspace
Install KNIME and explore how visual workflows help simplify complex tasks — no code, no hidden formulas.
Day 2: Explore the data and define your goals
Work with multi-year budget data and define the key questions your report should answer.
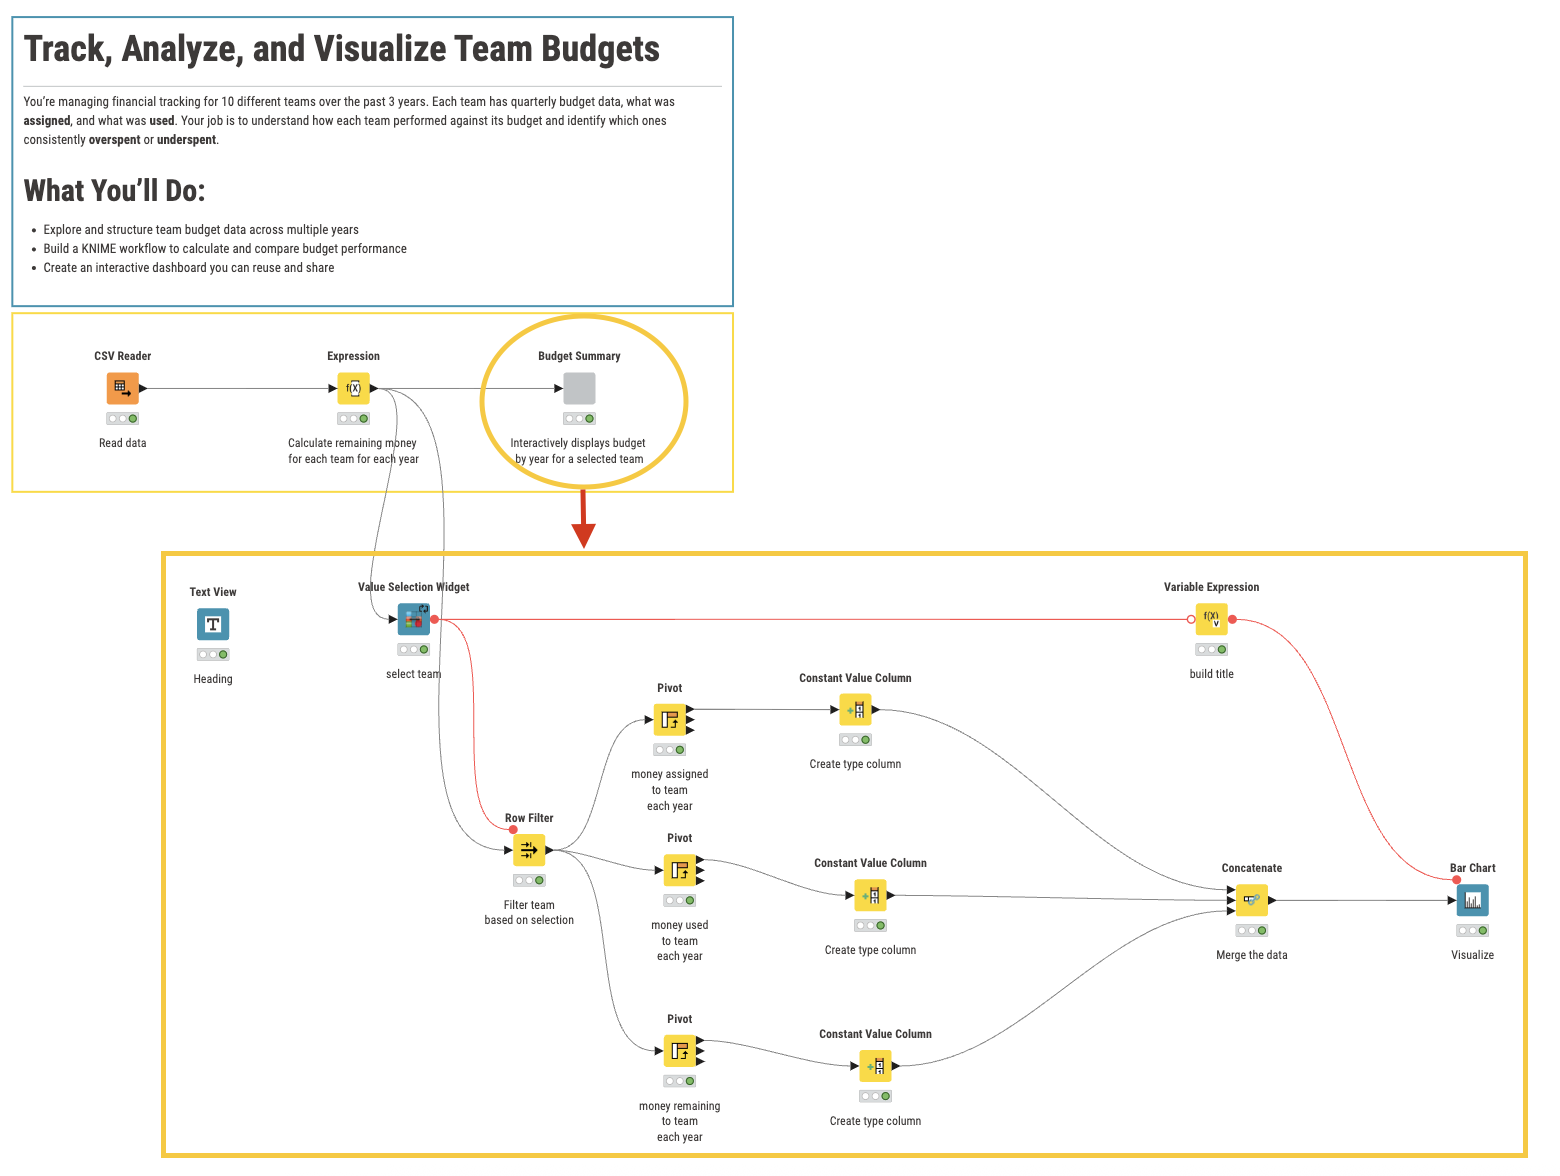
Day 3: Build your budget analysis workflow
Calculate overspend by team and year using guided steps that turn your logic into something visual and reusable.
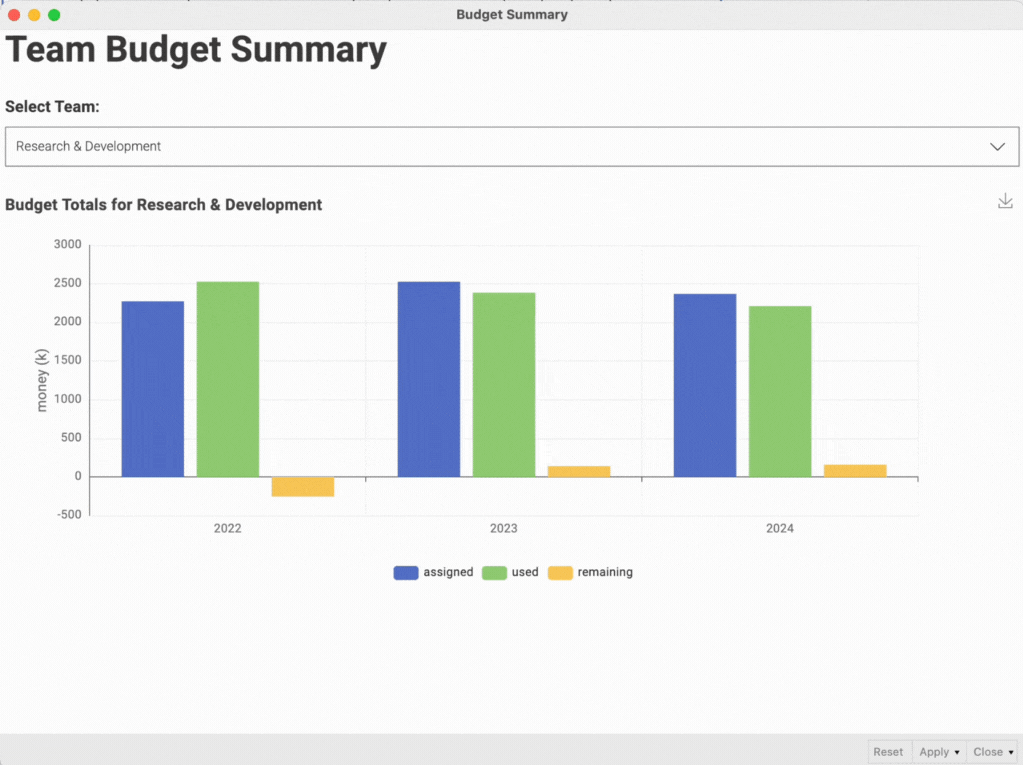
Day 4: Connect the pieces and create a data app
Wrap your workflow into a dashboard you can share — with dynamic filters, titles, and more.
Day 5: Finalize and scale your solution
Swap in new data, reuse your setup, and discover next steps to keep building your skills.
Why this approach works
This email series is built to lower the barrier to entry for scalable reporting, especially for professionals who are already familiar with spreadsheets but want something more adaptable.
Learn in manageable steps
Each lesson is short, focused, and actionable.
No code required
You’ll build workflows visually — step by step, not line by line.
Built for real-world tasks
If you track budgets or report on team-level spending, this applies to you.
From manual to modular
Instead of rebuilding from scratch each quarter, you’ll have a system that’s flexible, explainable, and ready to evolve. Whether you’re preparing monthly reports or digging into historical trends, a visual workflow helps you move faster.
Ready to explore a new way of reporting?