This article was first published on the KNIME Forum.
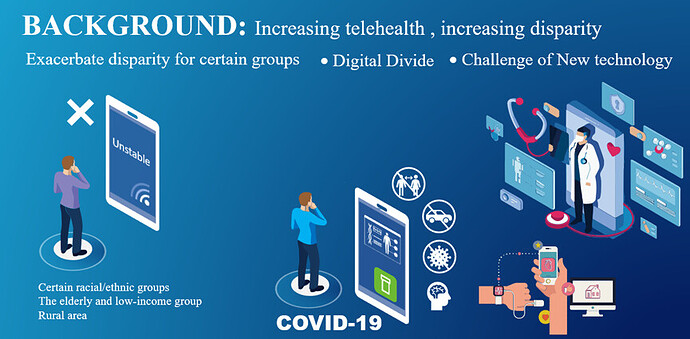
During the COVID-19 pandemic, telehealth developed rapidly, due to its capacity to reduce unnecessary travel and potential disease transmission, providing convenient mental health and easier access to medical services.
However, more recent research suggests that it may not alleviate but further exacerbate the disparity of health care accessibility, for certain racial/ethnic groups, the elderly and low-income group, and in rural area.
The expanding digital divide might play an important role, such as unaffordable internet access to the minority population and the use barrier to the groups of low education level and the elderly. To support new technologies, wearable preparations and smart homes are likely to have higher requirements for broadband, and the groups of low income with low broadband speed may lose access to better medical care (Figure 1).
The distance-dependence of patients to telehealth providers may also magnify and reinforce preexisting geographic disparities. Most people prefer telehealth as an additional option to getting service from nearby hospitals, such as acquiring services after normal clinic hours, scheduling appointments and refilling prescriptions. The concerns regarding the challenge of performing a physical exam via internet, maintaining emotional connection across physical distance, the stability of internet service and fragmentation of medical records prompt residents to seek local telehealth services.
A recent study showed that telemedicine did not change the distance residents traveled to seek medical care. Telehealth is more likely used to augment local healthcare.
This article shows how we can assess the accessibility of primary care physicians through telehealth using the Two Step Virtual Catchment Area method (2SVCA) in conjunction with the Geospatial Analytics Extension for KNIME.
Citation: Lingbo Liu, Jennifer Alford-Teaster, Tracy Onega, Fahui Wang, Refining 2SVCA method for measuring telehealth accessibility of primary care physicians in Baton Rouge, Louisiana, Cities, Volume 138, 2023, 104364, ISSN 0264-2751
Objectives: Assess telehealth accessibility in Baton Rouge
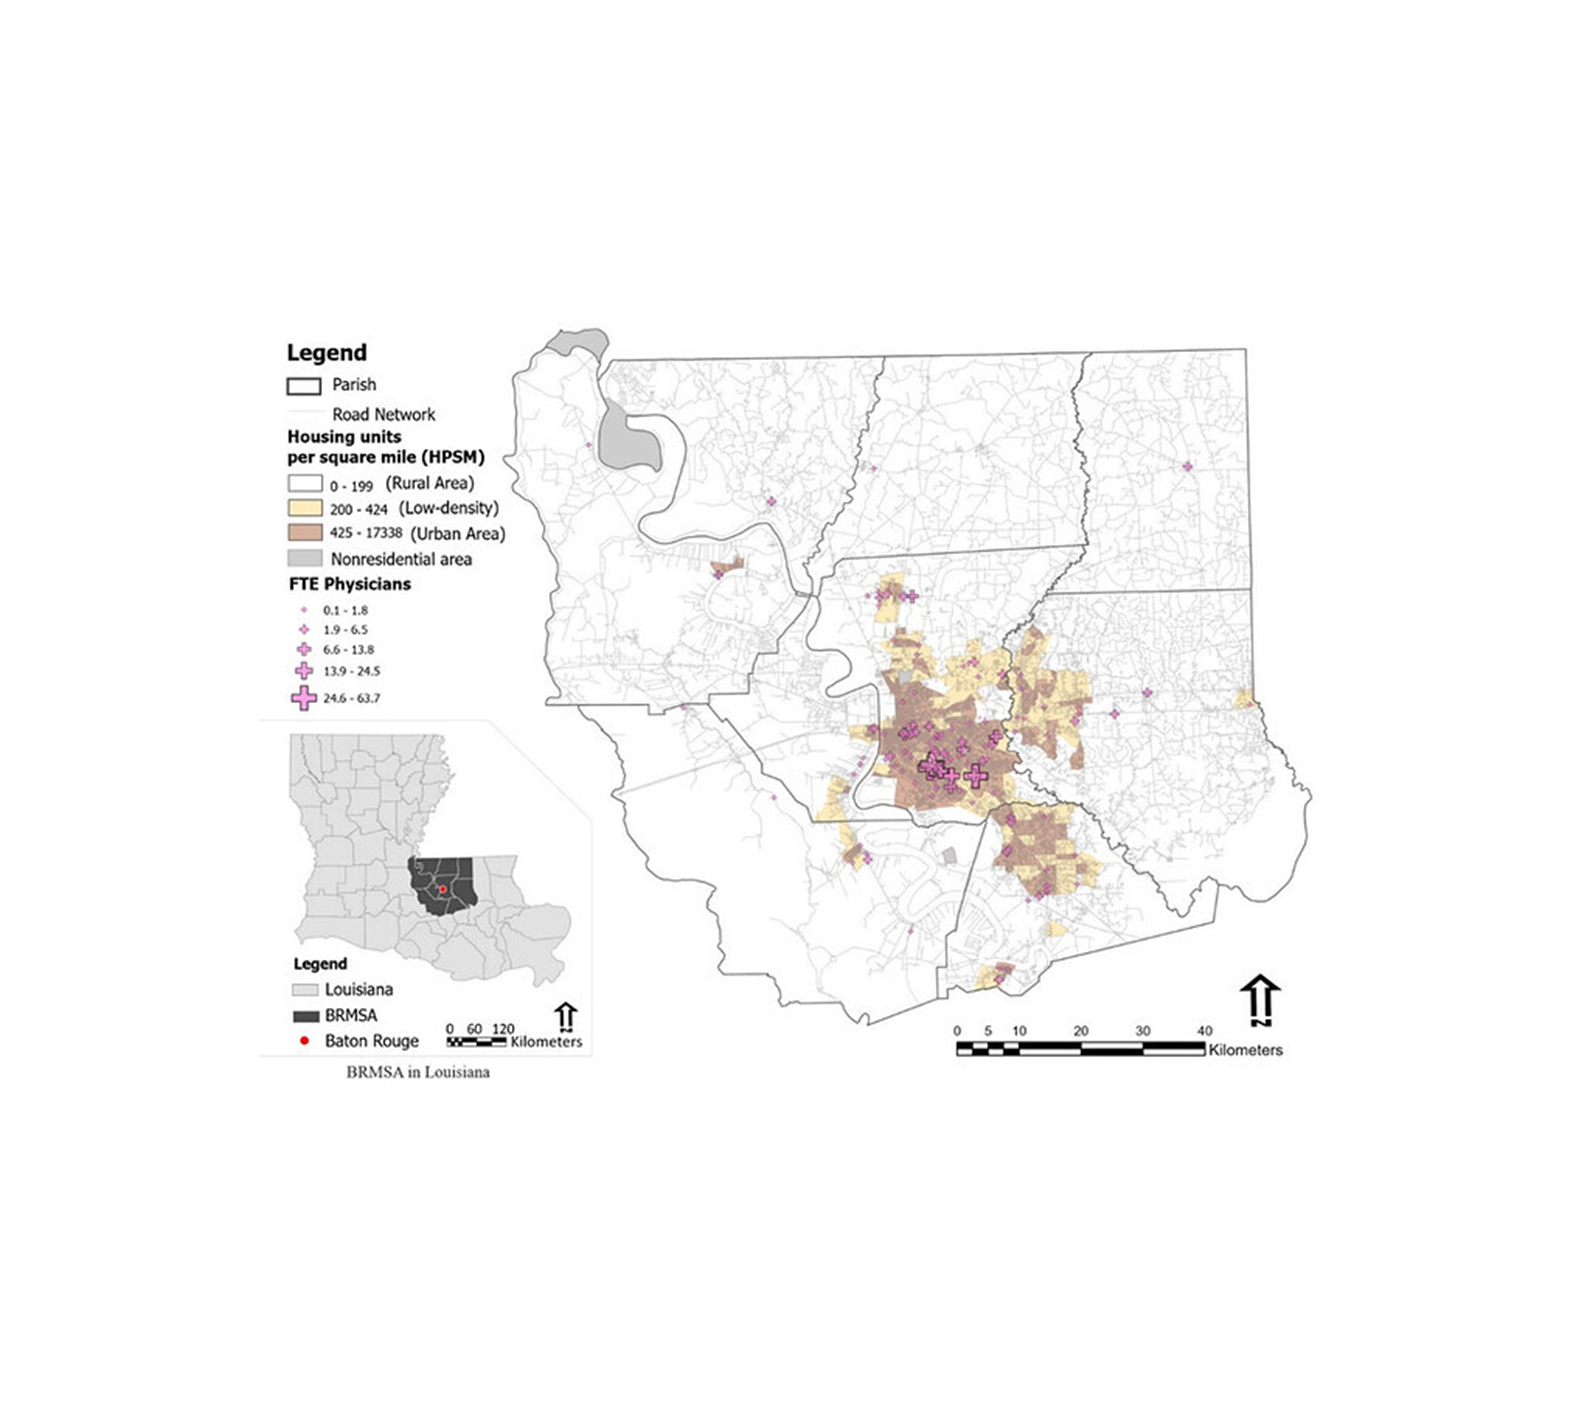
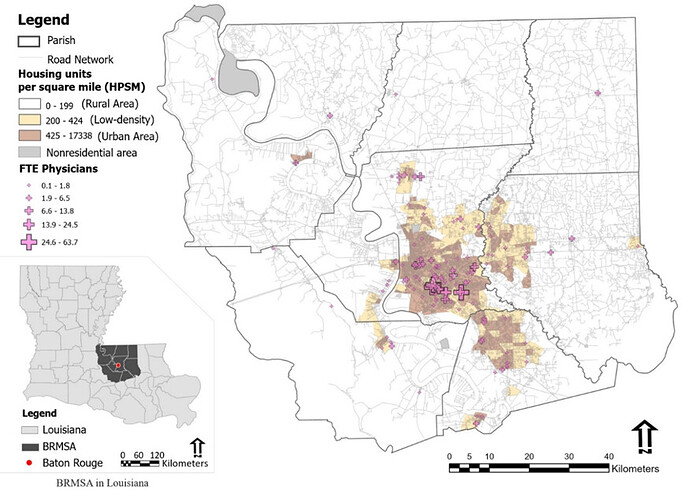
Assesses the telehealth accessibility of primary care physicians (PCPs) in the Baton Rouge Metropolitan Statistical Area (BRMSA), Louisiana (Figure 2).
Our data
We integrated all necessary information into a single file OD Cost Matrix table ODwithBroadband.csv, it contains travel time between MSAbkgPt and PCPmsa based on the Euclidean distance, with fields Origin ID and Destination ID representing population and physician location ids, respectively, and Minutes representing the drive time between them in minutes. For residential information , GEOID for unique geography identifier ID of Census block group units, POP100 for population, and MaxAdDown, MaxAdUp and bandR for mean download speed, mean upload speed, and for subscription rate of broadband of consumer service providers, respectively. For Physician information, PCP for number of FTE (full-time equivalent) primary care physicians (PCP), and MaxAdDown(right) and MaxAdUp(right) for mean fixed broadband download and upload speeds by business service providers, in 2020 census block centroids.
The population data is extracted from the 2020 census as illustrated in Case Study 1 in section 1.3 of Chapter 1. Data of physicians (including specialties and geographic locations) in Louisiana in 2022 are extracted from the Doctors and Clinicians National Downloadable File released by the Centers for Medicare and Medicaid Services (CMS). There are 594 primary care physicians (PCP) aggregated to 172 locations. The internet infrastructure data is based on the Fixed Broadband Deployment Block Data (dated December 31, 2020) via the FCC website (Fixed Broadband Deployment Data from FCC Form 477 | Federal Communications Commission. The FCC broadband data contains maximum upload and download speed records by different service providers (consumer vs. business).
How we used the 2-step virtual catchment area method
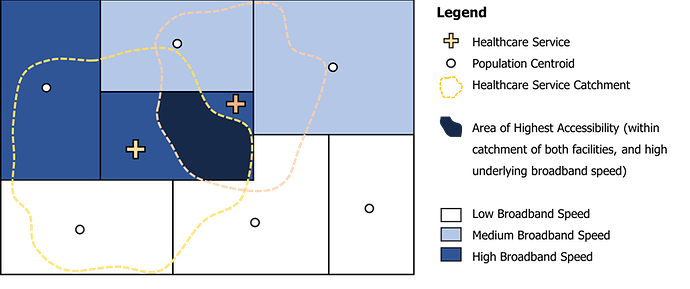
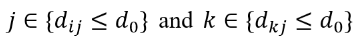
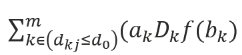
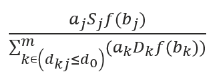
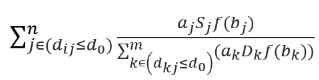
For each demand location i, search all supply locations (j) that are within the threshold distance (d0) from location i (i.e., catchment area i), and sum up the supply to demand ratios Rj at those locations to obtain the virtual accessibility VAi at demand location I based on 2SVCA :

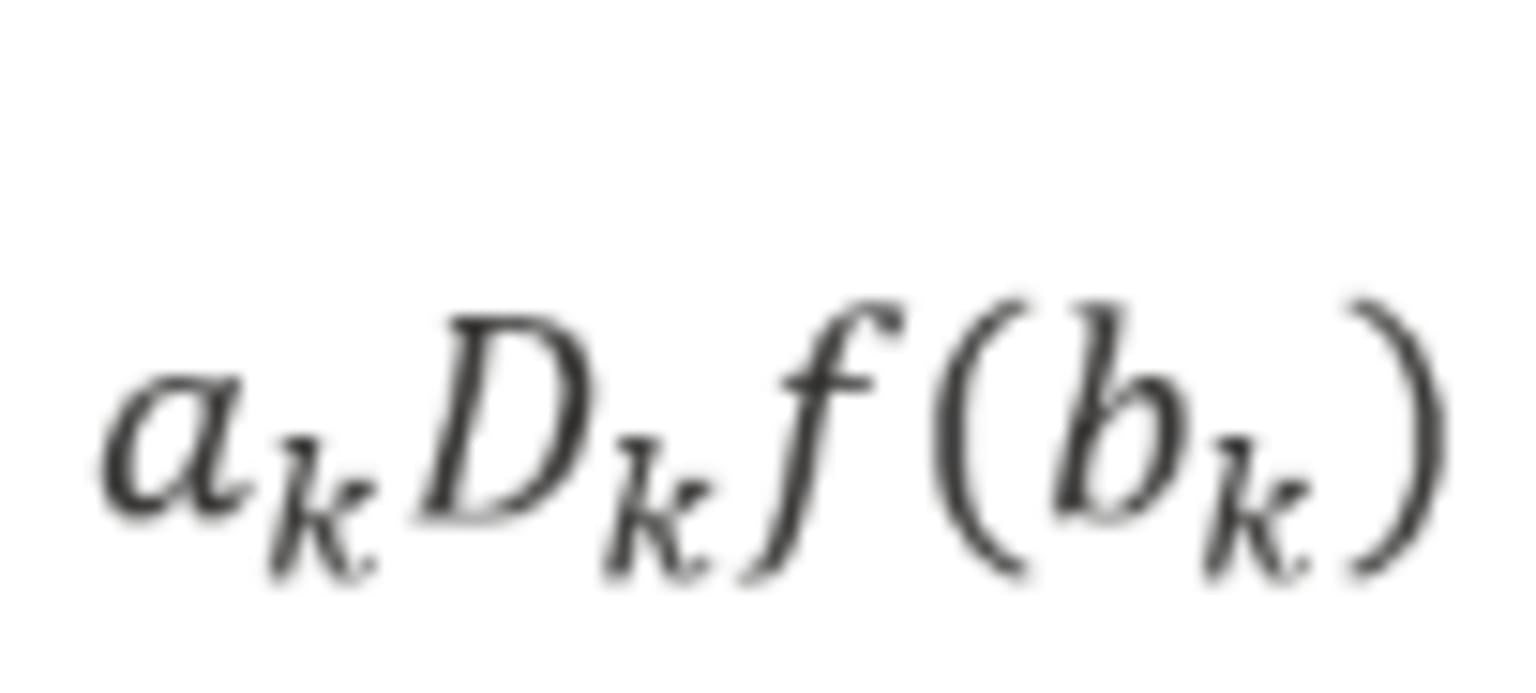
where the degrees of a facility Sj and a demand location Dk participating in telehealth services between them is a function of their broadband strengths f(bj) and f(bk). There are three additional parameters associated with broadband subscription rates: (1) aj is applied on facility Sj so that only a portion of the facility with commercial broadband subscription provides telehealth service, (2) ak is applied on demand Dk to capture that only those residents with consumer broadband subscription would contribute to telehealth services offered by Sj, and (3) ai is applied to discount the initial virtual accessibility score assigned to demand location i because only this portion of residents have the consumer broadband subscription. Our case study assumes that broadband is affordable for any PCP facilities and thus a uniform aj = 1. The conceptual model of 2SVCA is illustrated in Figure 3.
Step-by-step instruction in KNIME
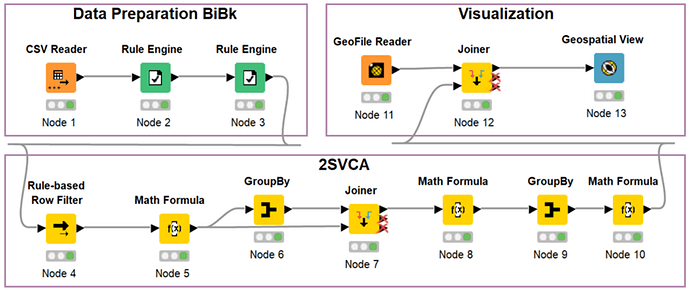
1. Defining broadband availability for population and physician locations
Create a new workflow Case5B, and add a CSV Reader node (Node 1) in the Editor. In the dialog of CSV Reader (Node 1), input the file path for ODwithBroadband.csv exported in the last step of Part 1. Click OK to confirm the settings and execute the node to read the data. The resulting data include the columns: GEOID, MaxAdDown, MaxAdUp, POP100, bandR, Origin ID, Destination ID, Distance, PCP, MaxAdDown (right), MaxAdUp (right).
Next, we will use the broadband speed requirements to define broadband availability.
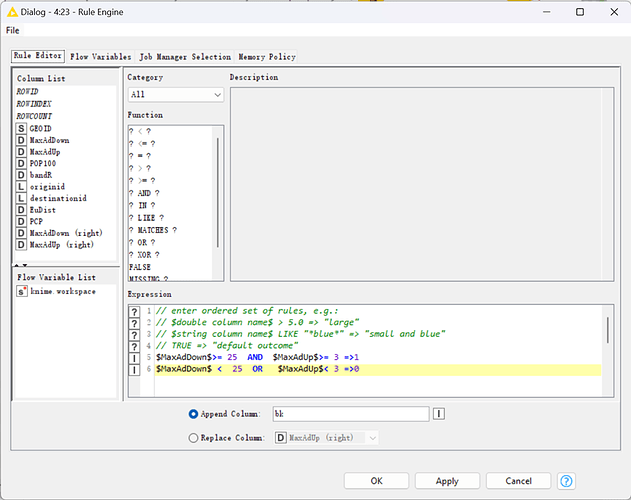
Add a Rule Engine node (Node 2) to the Editor and link CSV Reader (Node 1) to it. In the dialog of Rule Engine (Node 2) shown in Figure 5, input two lines in the Expression by double-clicking the column names MaxAdDown and MaxAdUp in Column List and the appropriate operation symbols in Function:
$MaxAdDown$>= 25 AND $MaxAdUp$>= 3 =>1
$MaxAdDown$ 0
Check Append Column and input bk as the column name. Click OK and execute it. This node assigns the value 1 or 0 to the column bk according to the value MaxAdDown and MaxAdUp of population locations.
Add another Rule Engine node (Node 3) and link Rule Engine (Node 2) to it. Append a new column bi with the following expression:
$MaxAdDown (right)$>= 25 AND $MaxAdUp (right)$>= 3 =>1
$MaxAdDown (right)$ 0
This node assigns the value 1 or 0 to the column bi according to the value MaxAdDown(right) and MaxAdUp(right) of physician locations.
2. Attaching broadband availability data to the OD matrix
Add a Rule-based Row Filter node (Node 4) and link Rule Engine (Node 3) to it. In the dialog of Rule-based Row Filter (Node 4, revise the expression to $Distance$ TRUE and check Include TRUE matches. Click OK and execute the node. The distance table includes only those distance pairs within 20 miles and thus implements the selection conditions in Equation 1.
3. Summing up population with broadband subscription in areas with available broadband services around each physician location
Similar to step 9, add a Math Formula node (Node 5) and link Rule-based Row Filter (Node 4) to it. Configure it to append a new column wpop with the expression $bandR$$POP100$$bk$, which is the value in Equation 1.
Only locations with broadband services are eligible for participating in telehealth, and the population there is further discounted by (limited to) those with broadband subscriptions.
Add a GroupBy node (Node 6) and link Math Formula (Node 5) to it. In the dialog of GroupBy (Node 6), (1) under the Groups tab, choose Destination ID for Group column(s) and Aggregation method (column name) for Column naming, (2) under Manual Aggregation tab, choose wpop for Column and Sum for Aggregation. Click OK and execute it. The field Sum_wpop is the total population having adequate broadband access within the threshold distance from each in Equation 1.
4. Computing initial physician-to-population ratio at each physician location.
Add a Joiner node (Node 7) and link GroupBy (Node 6) and Math Formula (Node 5) to it. In the dialog of Joiner (Node 7), (1) under Joiner settings tab, choose Destination ID for both Top Input (‘left’ table) and Bottom Input (‘right’ table), (2) under Column Selection, choose wpop in the Include box of Top Input (left table) and all columns in the Include box of Bottom Input (right table), and (3) keep other default settings. Execute it.
Add Math Formula (Node 8) and link Joiner (Node 7) to it. Configure it to append a new column docpopR with the expression 1000*$PCP$*$bi$/$Sum(wpop)$. This assigns an initial physician-to-population ratio to each physician location, where only physicians in locations with broadband services and subscribed to broadband contribute to telehealth access. This step computes the term in Equation 1.
Again, the ratio is inflated 1,000 times to indicate the physician availability per 1,000 residents.
5. Summing up physician-to-population ratios by population locations
Add a GroupBy node (Node 9) and link Math Formula (Node 8) to it. In the dialog of GroupBy (Node 9), (1) under the Groups tab, choose Origin ID for Group column(s) and Keep original name(s) for Column naming, (2) under Manual Aggregation tab, choose docpopR, bandR, and GEOID for Column, and Sum, First, and First for Aggregation, respectively. Click OK and execute it.
The column docpopR in the output port represents the virtual accessibility for physicians from each residential location. It includes five locations with zero values due to inadequate access to the internet. This computes the term in Equation 1, which is a preliminary virtual accessibility value that is limited to those with broadband subscriptions there.
Add a Math Formula node (Node 10) and link GroupBy (Node 9) to it. Configure the node to replace the value of column docpopR with the expression $docpopR$*$bandR$ and checking Replace Column. Click OK and execute it.
By multiplying the broadband subscription rates, the Math Formula node returns the overall virtual accessibility score VAi associated with residential area in Equation 1.
6. Mapping accessibility
Add three nodes, GeoFile Reader (Node 11), Joiner (Node 12) and Geospatial View (Node 13). Link Math Formula (Node 10) to the bottom input port of Joiner (Node 12) and re-execute the workflow. Right-click Geospatial View (Node 13) and choose Interactive View: Geospatial View to see the visualization of virtual accessibility.
Resources
-
Lingbo Liu, Fahui Wang, Disparities in Telehealth Accessibility to Primary Care Physicians in Baton Rouge, Louisiana, PaCSS,2022, IQSS, Cambridge, MA.
-
Alford-Teaster J, Wang F, Tosteson ANA, Onega T. Incorporating broadband durability in measuring geographic access to health care in the era of telehealth: A case example of the 2-step virtual catchment area (2SVCA) Method. J Am Med Inform Assoc 2021;28(11):2526-30.
-
The project was showcased at PaCSS 2022 and its corresponding paper was published in the journal Cities. Additionally, selected portions of this material are included in the recently published book, “Computational Methods and GIS Applications in Social Sciences,” along with its accompanying KNIME Lab Manual. This publication serves as the third edition of “Quantitative Methods and Socio-Economic Applications in GIS.”
-
Explore more workflows in the spaces of Center for Geographic Analysis at Harvard University on KNIME Community Hub.
-
Find the data and workflow download link on Github