Filtering data in Excel is a routine task — whether it’s narrowing down sales by region, excluding canceled orders, or removing duplicates before analysis. But the process isn’t always smooth. While Excel offers built-in tools for filtering data, it can also be complex to manage. They often break when data changes, require careful manual updates and become difficult to debug. As datasets grow, these methods can become complex and time-consuming.
In this guide, we’ll explore Excel’s filtering options, highlight some common challenges, and introduce a visual, drag-and-drop alternative with KNIME Analytics Platform. This alternative allows you to maintain a repeatable process while keeping your source data intact and focusing on the information that truly matters.
There are two ways to filter data: by row or by column.
- Filtering by row allows you to:
- Keep only the rows you need based on specific values or conditions.
- Use rule-based filters to exclude or include data dynamically.
- Remove duplicates to ensure clean, accurate analysis.
- Filtering by column allows you to:
- Select which columns to keep or remove using simple Add/Remove buttons.
- Use wildcards or regular expressions to filter columns based on their names.
- Automatically keep only specific types of data, such as all numeric values or all text fields.
Let’s dive in!
A visual workflow can be a practical addition to your skill set.
Filtering in Excel often means modifying your source data, which can break formulas and require constant updates. KNIME Analytics Platform offers a visual, repeatable alternative — no need to memorize complex formulas. Instead of coding filters manually, you build them step by step in an intuitive configuration dialog.
With KNIME, you can filter, clean, and transform data while keeping your original dataset intact. Plus, a community-driven hub provides pre-built workflows you can drag and drop to get started faster.
For instance, download the workflow below from KNIME Community Hub. Just drag it onto your canvas and customize it to fit your specific project.
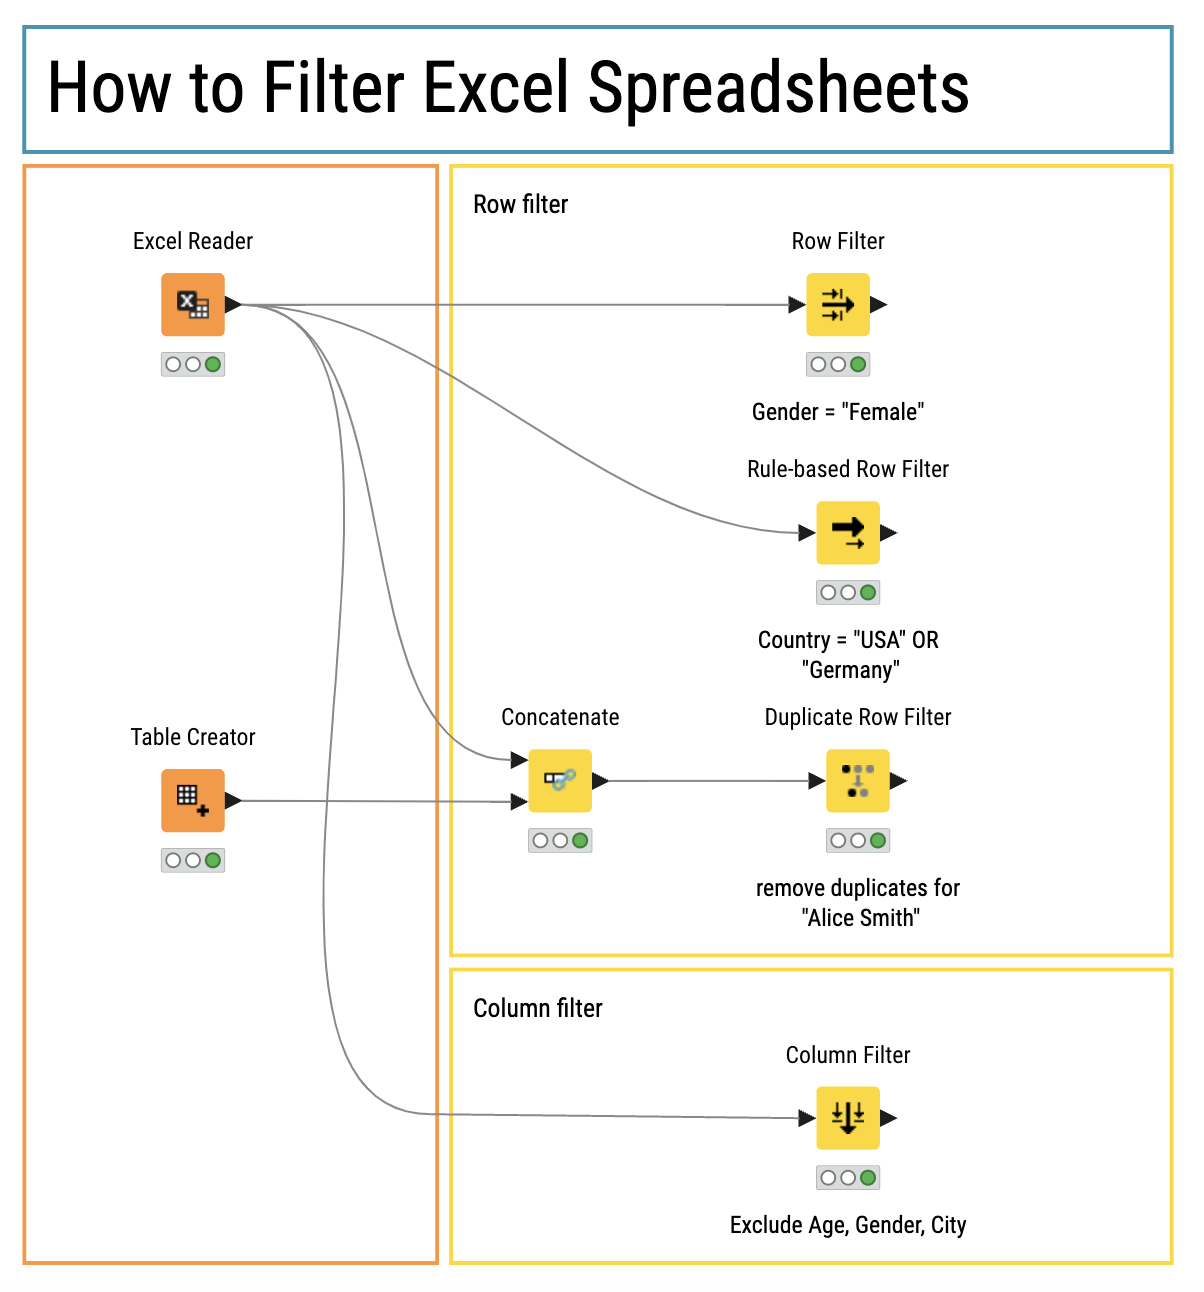
How to filter rows
You can filter rows based on specific values or conditions. This is useful when you want to keep only the relevant rows for analysis (e.g., filtering by gender, category, or another attribute).
Task: You want to extract only the rows where the Gender is "Female."
Solution in Excel
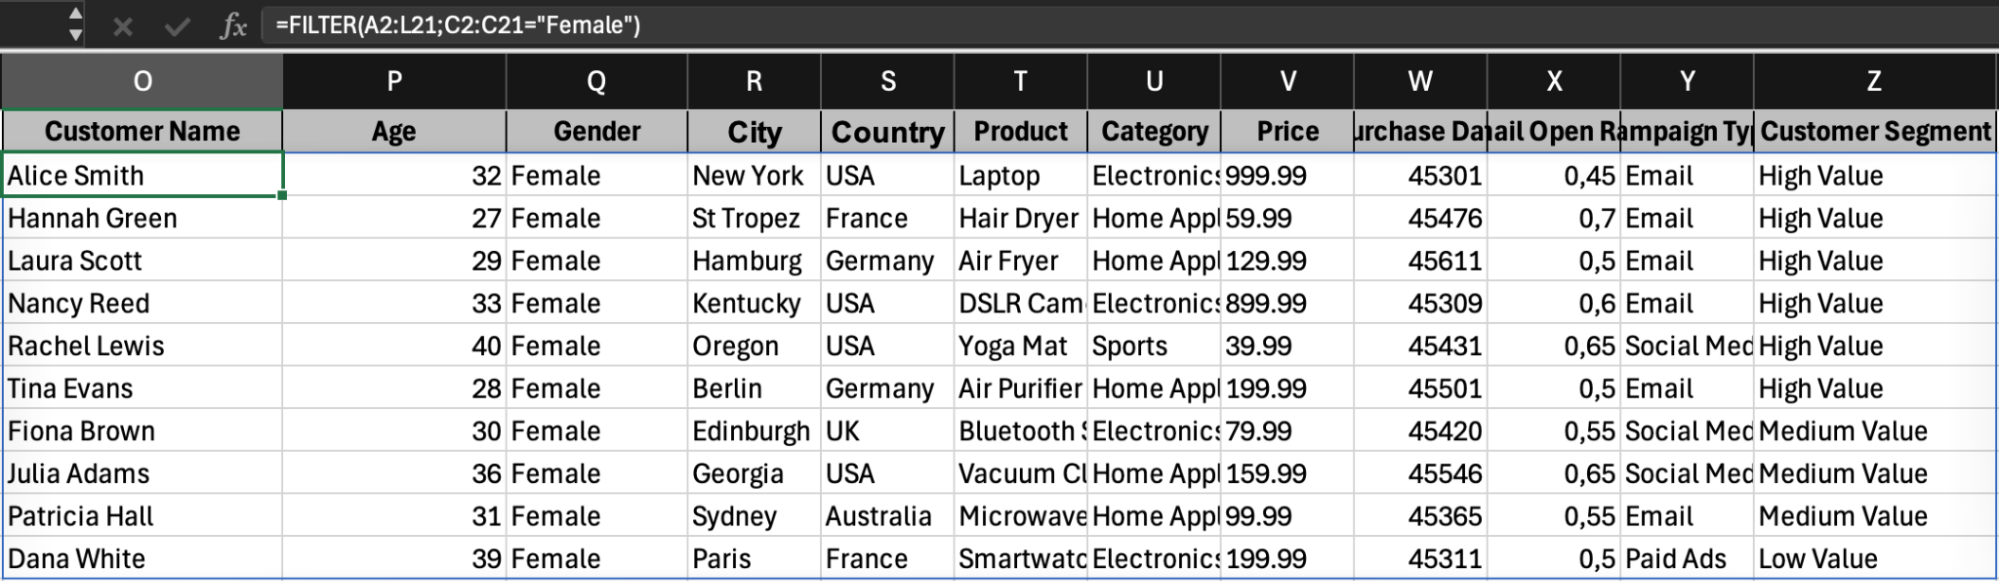
If your dataset is in the range A2:L21, you can use the following formula to filter for rows where the Gender (column C) is "Female":
Use this formula:
=FILTER(A2:L21; C2:C21 = "Female")
This formula checks each row in the range A2:L21 and returns only those rows where the value in column C equals "Female." If no rows match, it returns an empty cell.
However, if the original data is changed (for example, if rows or columns are added or removed), the formula may break because the cell references become invalid. Additionally, note that the filtered results are often output to the same sheet — in a specific area like column O. This can clutter your spreadsheet if you already have data in that area or if the extra output makes the layout confusing.
Solution in KNIME
In KNIME, you're going to set up an automatic filter. The advantage is that you don’t need to memorize and type in formulas. Plus, if you need to adjust or extend the filter, you can do so easily without manually redoing the steps. Here’s how:
- Double-click the Row Filter node to open its configuration dialog.
- Set up the filter by selecting the Gender column, choosing equals, and entering "Female."
- Run the workflow, and KNIME will filter the dataset automatically.
With this approach, your filter is saved in the workflow, making it easy to modify and reuse whenever your data updates.
In the GIF below, you can see the configuration dialog for the Row Filter node. Here, you can define one or more filtering criteria for your dataset. You can easily choose the filter column, the operation (such as equal or less than and so on), and the value you want to filter by.
How to filter rows using rules
You can use more advanced conditions to filter data. This is ideal for complex filtering scenarios where you might need to exclude or include rows based on multiple criteria (e.g., excluding rows where sales are below a certain amount).
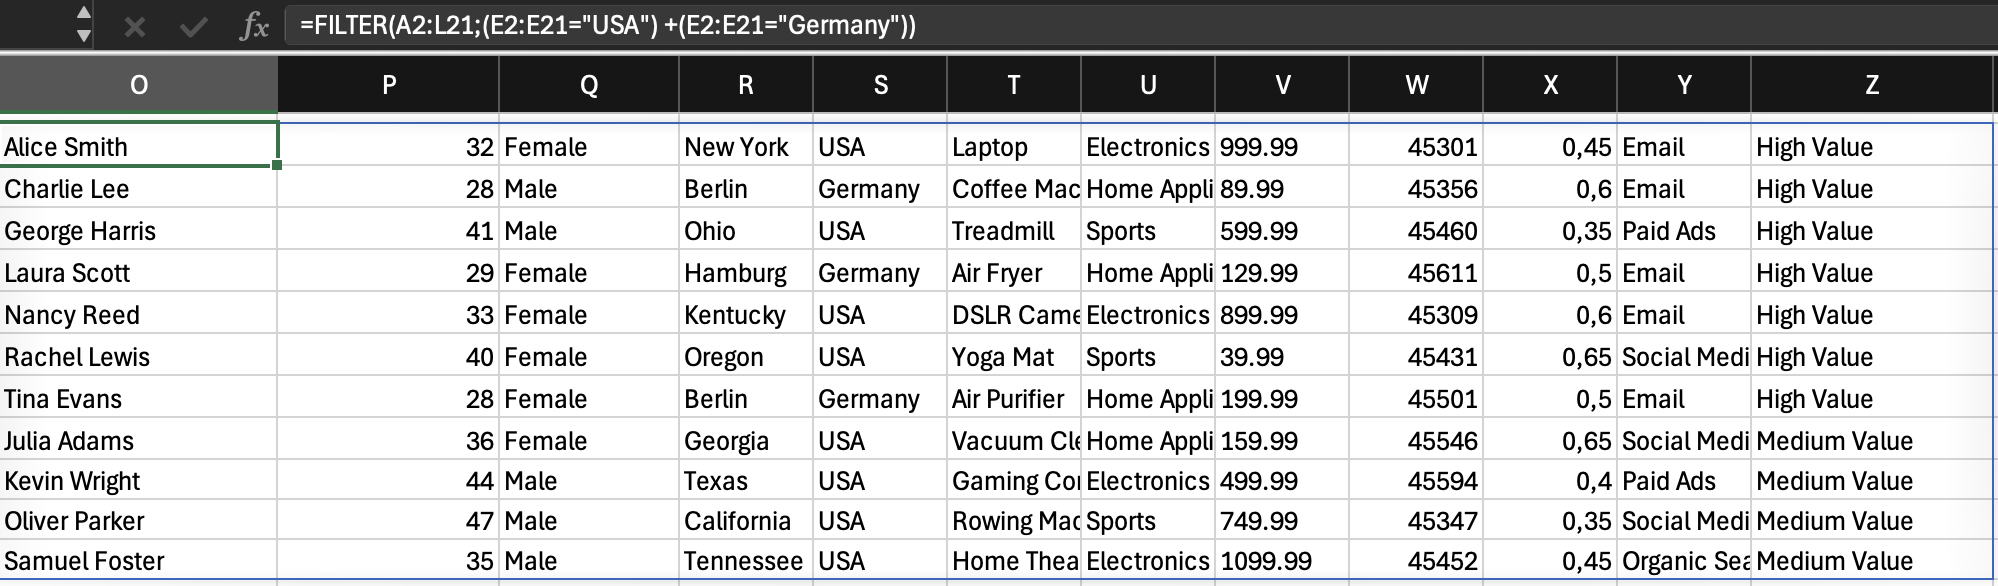
Task: You want to extract only the rows where the Country is "USA" OR “Germany.”
Solution in Excel
If you want to include or exclude rows with two different values — for example, filter for rows where the country is "USA" or "Germany" — you need to write a formula like this:
=FILTER(A2:L21;(E2:E21="USA")+(E2:E21="Germany"))
Here, the data range from A2 to L21, and we check column E from rows 2 to 21 to see if they have USA or Germany. And output only the rows that contain these two countries.
This formula is not only tedious to set up but also fragile. Here are some reasons why:
- Complex Formulas: Combining several conditions can make the formula very complex and hard to understand.
- Manual Updates: The formula uses fixed cell references, so if your data range changes, you have to update it by hand.
- Easy to Break: A small mistake in the formula can cause errors or unexpected results.
- Limited Flexibility: Adapting these formulas for new datasets or different filtering needs is often difficult.
- Hard to Debug: Without a visual guide, it's challenging to see how the filtering rules are applied and to fix any issues.
Solution in KNIME
Rather than writing formulas manually, KNIME provides a configuration dialog where you build filtering rules step by step — no need to remember the syntax.
The Rule-based Row Filter node lets you filter rows based on a set of rules without altering your original dataset. Unlike using complex formulas that force you to use specific cell references like A2, E2, A21, or X35, the input in the Rule-based Row Filter node lets you work directly with column names and is exactly what the problem sounds like — for example:
$Country$ = "USA" OR $Country$ = "Germany" => TRUE
In the GIF below, you can see the Rule-based Row Filter configuration dialog. This node offers a range of advanced filtering functions, making it easy to set up even complex conditions.
Key benefits include:
- Straightforward Input: References columns by name.
- Auto-Adapting: Automatically updates with new rows.
- Custom Control: Choose to include or exclude matching rows.
- Visual Workflow: Node-based view simplifies troubleshooting and refinement
How to remove duplicate rows
Removing duplicate entries ensures that your analysis has only unique data.
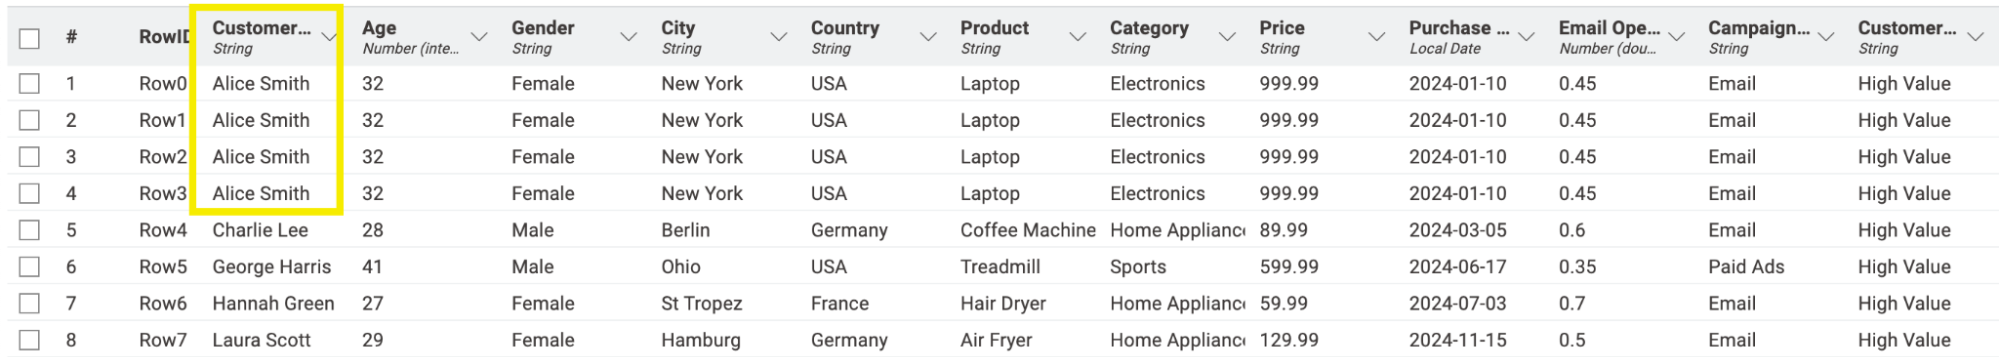
Task: Remove rows that are repeated. Customer name: Alice Smith
Solution in Excel
In Excel, you have two main ways to handle duplicate rows:
- Filtering for Unique Values:
Go to Data > Sort & Filter > Advanced to filter your data and display unique rows. This method does not alter your original dataset. You can adjust how duplicates are treated — for instance, you can choose to keep duplicate rows and add a column indicating which rows are unique, chosen, or duplicates.

- Removing Duplicates:
Select Data > Data Tools > Remove Duplicates > Click OK.
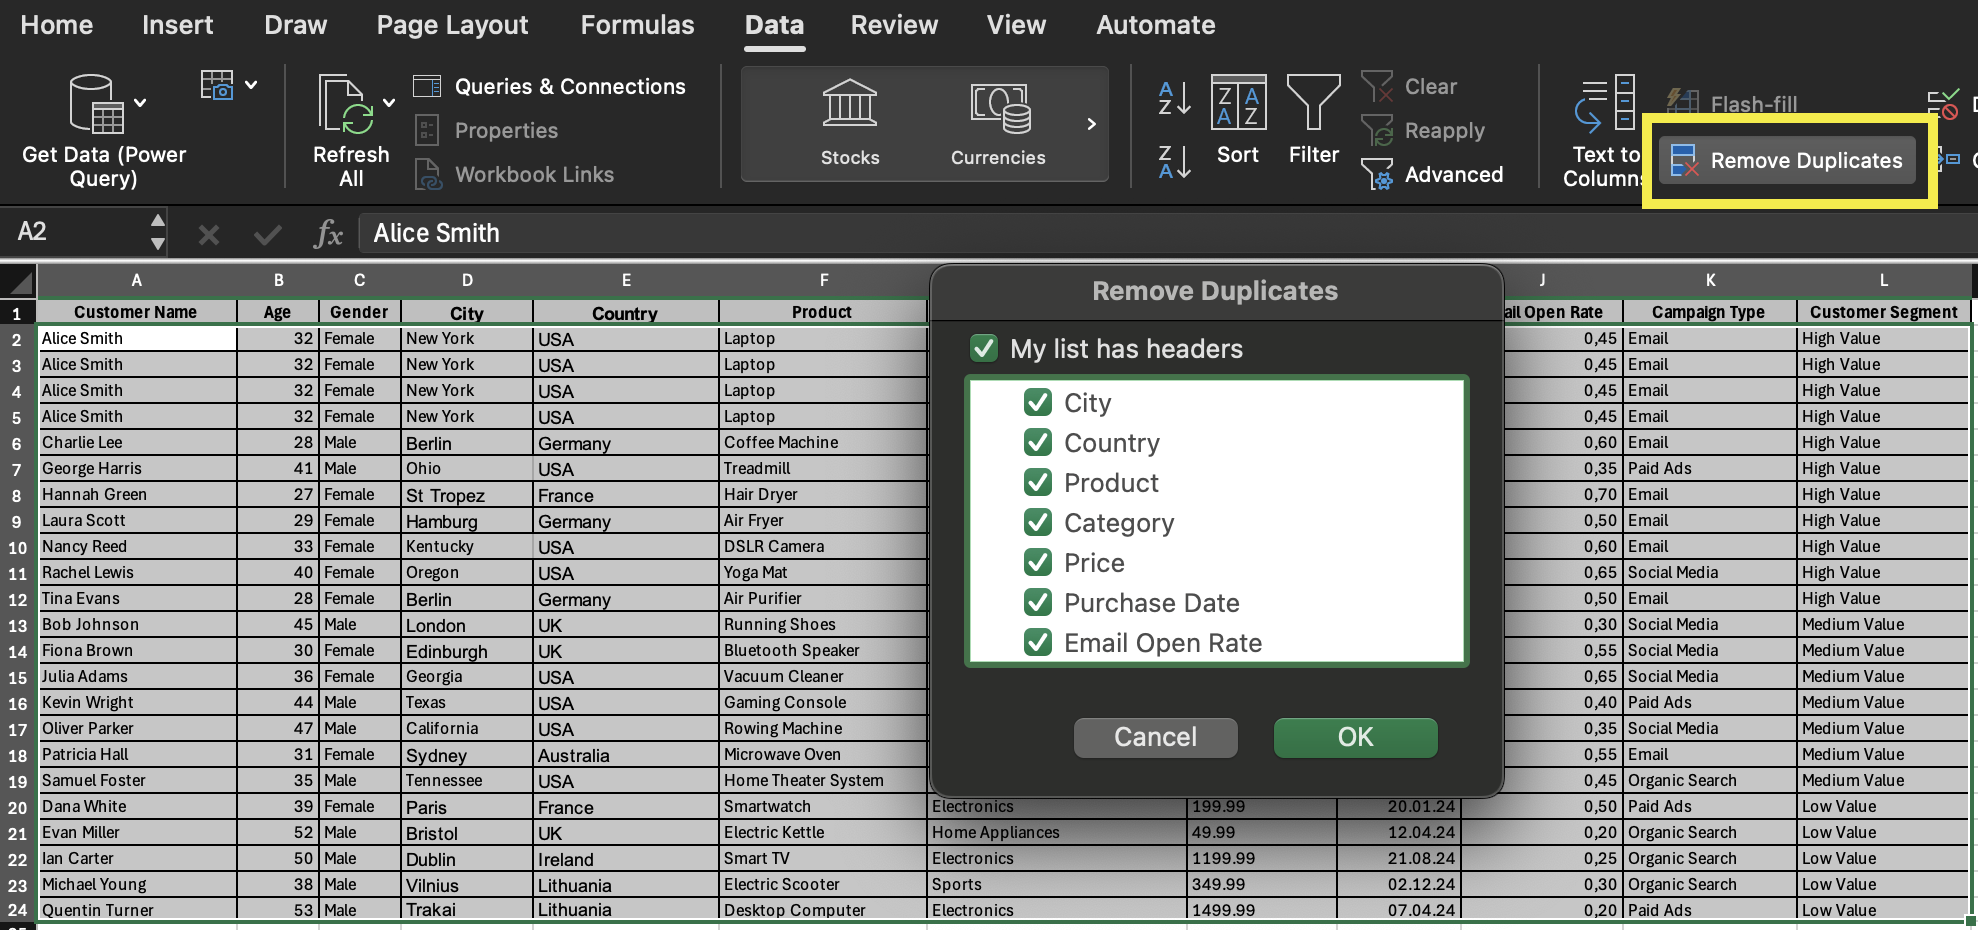
This method permanently deletes data, which can be risky if you need to recover any information later. This also means that when new rows are added or the data changes, you'll have to manually repeat the process. Since you change the source data, it makes it harder to trace and debug the steps in your duplicate removal process.
Solution in KNIME
In KNIME you just need the Duplicate Row Filter node. This node allows you to identify and remove duplicate rows while preserving the original data at the previous step, ensuring a clean and repeatable workflow.
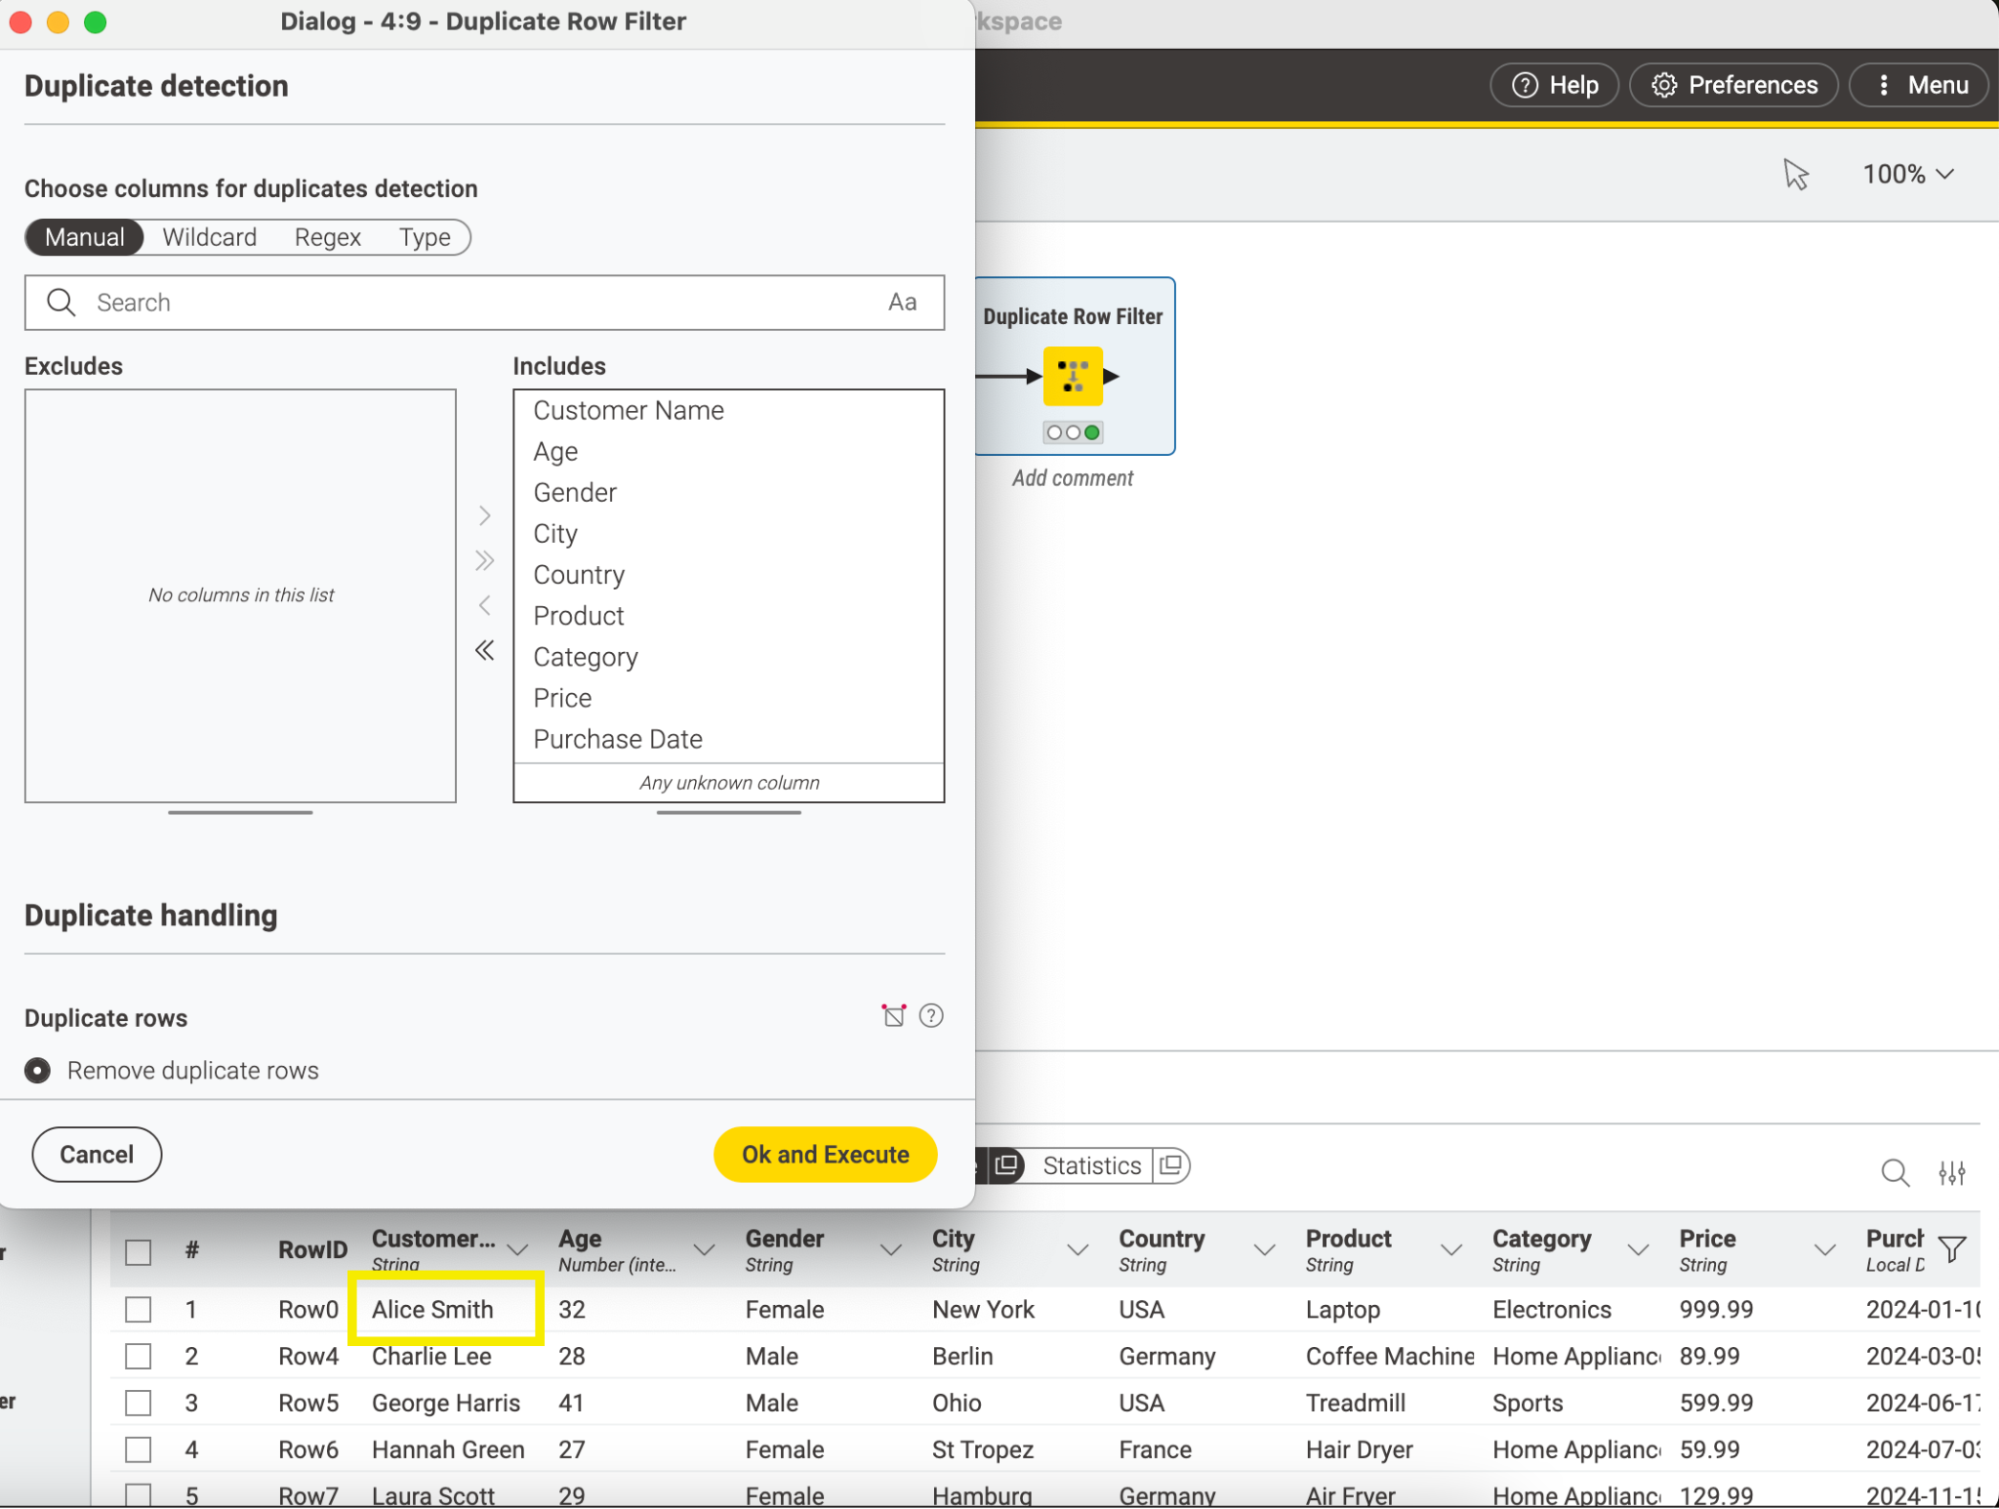
Duplicate handling in this node lets you decide how to treat rows with duplicate values. You can:
- First: Choose the first row.
- Last: Choose the last row.
- Minimum: The first row with the minimum value in the selected column is chosen. (alphabetically for text; missing values come last).
- Maximum: The first row with the minimum value in the selected column is chosen. (alphabetically for text; missing values come first).
How to filter columns
Remove unwanted columns, keeping only the ones you need for analysis. This can be done manually or by defining patterns, making it ideal for data that include irrelevant or redundant columns.
Task: Remove the columns Age, Gender, and City from the data
Solution in Excel
To remove unwanted columns you select the columns — such as Age, Gender, and City, and delete them manually.
Alternatively, you could copy only the necessary columns into a new worksheet.
However, these methods come with several serious pain points:
- Permanent Data Loss: When you delete columns manually, they are removed permanently, making recovery difficult if you later realize you need the data.
- Time-Consuming and Error-Prone: The manual process of deleting or copying columns is not only tedious but also prone to mistakes, which can lead to inconsistent datasets.
- Dependent Formulas Can Break: If there are formulas that depend on the data structure, manually deleting columns can cause these formulas to break, leading to further errors and extra maintenance work.
Solution in KNIME
In KNIME, you can use the Column Filter node to efficiently remove unwanted columns. This node lets you choose which columns to keep or exclude — by selecting them manually or defining patterns. For example, if you have several columns starting with "temp_" that you want to exclude, you can define a pattern to remove them all at once, rather than deleting each manually, making it ideal for handling irrelevant or redundant data.
For example, you can configure the node to remove the columns Age, Gender, and City from your dataset.
Here, the original dataset remains intact, and only the output from the Column Filter node is modified. The process is fully integrated into a visual, repeatable workflow that automatically adapts to updates in your data. You can easily adjust the filtering criteria if your dataset changes, ensuring that your analysis always includes only the relevant information.
A Smarter Way to Filter Data
While Excel is a familiar tool for data processing, its manual methods can lead to permanent data loss, broken formulas, and extra work when your data changes. These limitations can slow you down and increase the risk of errors, especially when dealing with large datasets and frequent manual updates.
KNIME Analytics Platform offers a simpler, visual workflow that keeps your original data safe and adapts automatically to updates. This means you spend less time fixing errors and more time on meaningful analysis.
Start automating your data work today. Download it now and use it for free forever.