
A valuable customer experience (CX) seems to be at the heart of all the businesses I happen to visit. After using a website, booking system, restaurant, or hotel, I am often (always?) asked to rate the experience. I often do, and I also often wonder what, if anything, the business is going to do with my rating. The rating embeds an overall summary, but stars alone cannot say much about an (un)pleasant experience, or what needs to improve in the customer journey.
Extracting Useful Insight from Stars and Reviews to improve CX
To better understand which parts of my customer journey succeeded or failed, a business would need to match my stars with my text review, if I left any. Then, from the review, they can start learning about my or any other customer journey. The review can contain relevant information about the contexts (e.g. weather conditions), touchpoints (e.g. the reception desk), and attributes (e.g. friendliness) of my experience. For more information about the touchpoints, qualities, and context framework (TCQ), please refer to this academic article.
Note. The Machine Learning and Marketing space on the KNIME Hub contains example workflows of common data science problems in Marketing Analytics. The original task was explained in: F. Villarroel Ordenes & R. Silipo, “Machine learning for marketing on the KNIME Hub: The development of a live repository for marketing applications”, Journal of Business Research 137(1):393-410, DOI: 10.1016/j.jbusres.2021.08.036. Please cite this article, if you use any of the workflows in the repository.
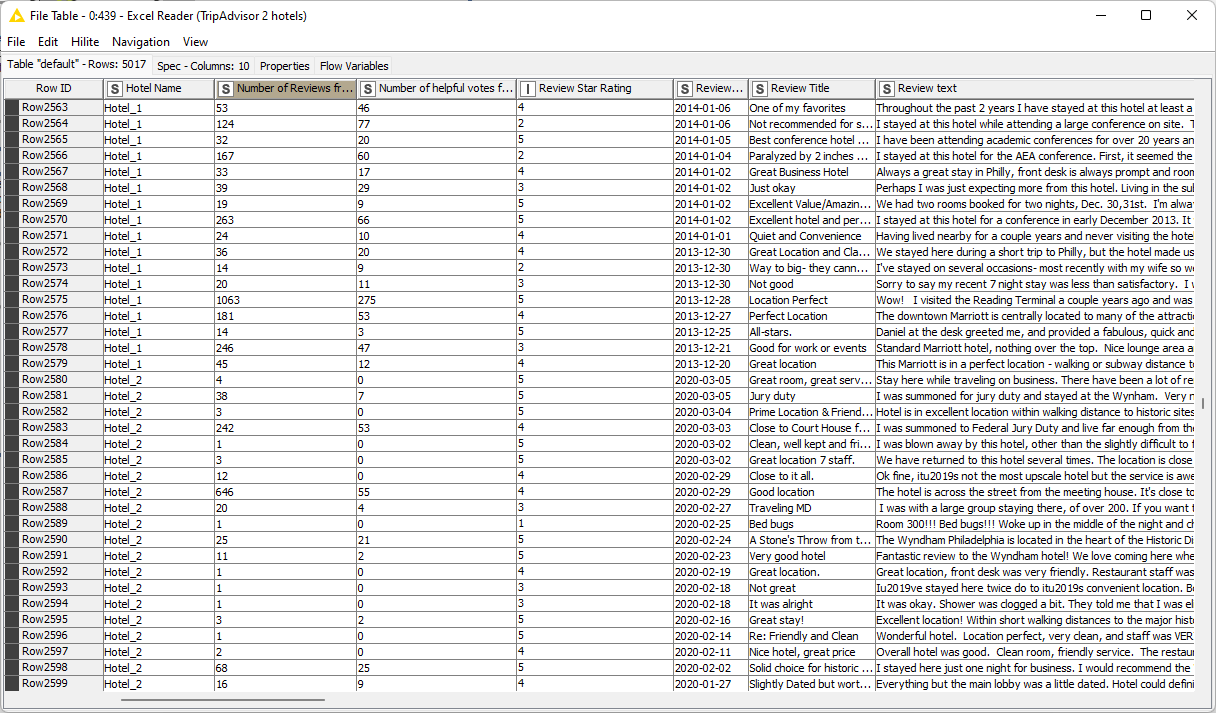
In practice, using customer reviews to learn about the customer journey requires using star ratings together with the text data and text mining methods. First a business should match the star ratings with the corresponding reviews. So far, so good; this is not hard to do. If they do not already come together in the dataset, a join operation on the customer ID and visit ID should be enough. See, for example, the TripAdvisor dataset containing star rankings and reviews related to a specific hotel stay (Fig. 1).
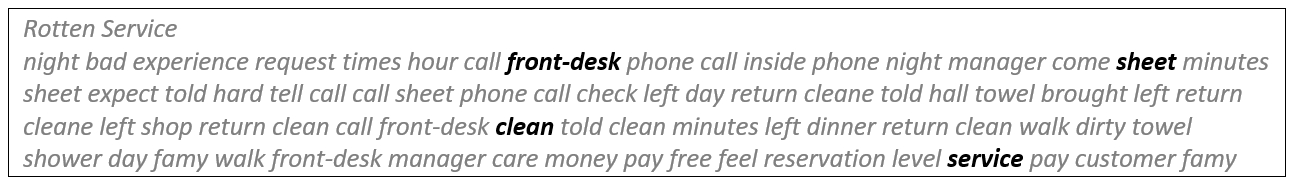
This is not enough, though. We need to identify which touchpoints, context, and qualities might have been critical in the customer experience. For example, this customer gave only 2 stars for their visit to “Hotel_1,” with this explanation:
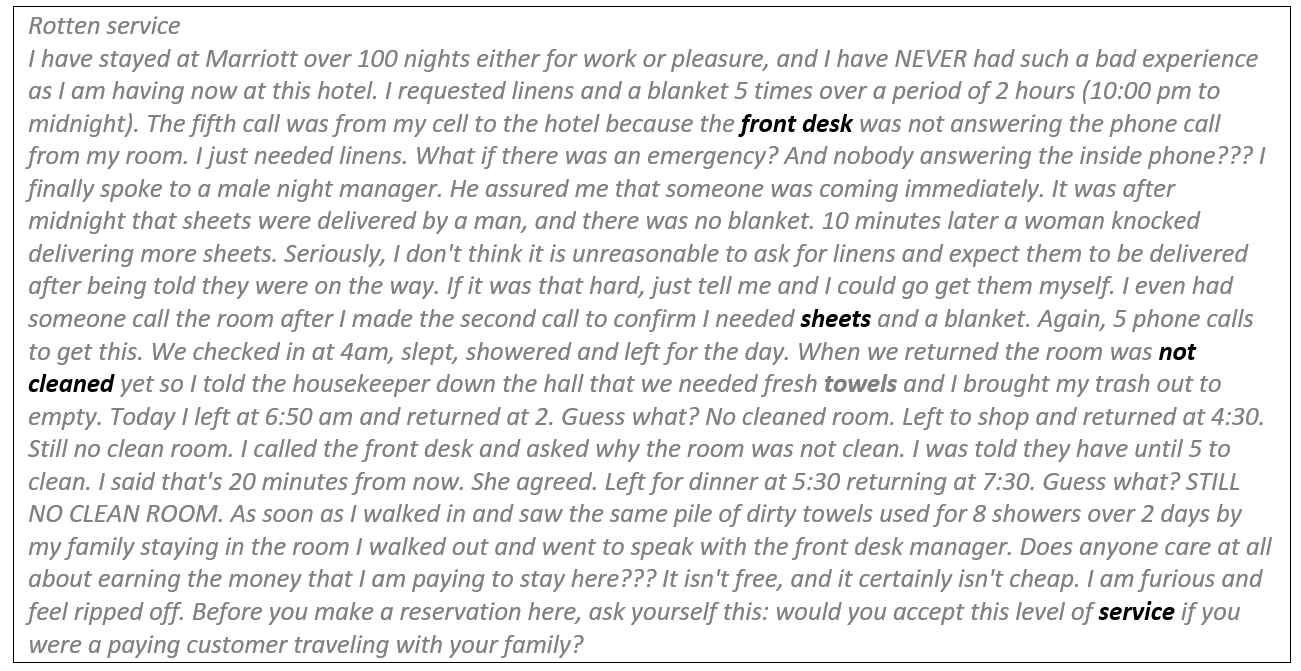
Lots of text, huh? The review points out a crucial element of this experience: This is a frequent customer, with 100+ visits, and it seems that the key reasons for the complaint relate to the front desk being non responsive and room service failing with the daily cleaning. In this case, the low star rating seems to truly reflect a negative experience that relates a frequent customer with several failures of two touchpoints (reception and room service). Firms and researchers can perform this type of analysis at an aggregated level using all reviews posted by customers.
In this article, we are going to show how to extract useful information from the pairs “(review text, star ranking)” that customers leave when describing their experience at a hotel. (But the same could be applied to any kind of business with the appropriate categories.) We are going to do this considering reviews for two hotels from the TripAdvisor dataset to show customer journey differences.
The TripAdvisor dataset contains customer experience evaluations for 2,580 visits to Hotel_1 and 2,437 visits to Hotel_2. Each evaluation contains the hotel name (Hotel_1 vs Hotel_2), the number of reviews provided in total by an author, the number of “helpful” votes the author got, the number of “helpful” votes each specific review got, the date each review was left, and the associated number of stars.
Let’s start our analysis.
Analysis of Customer Experience Feedback
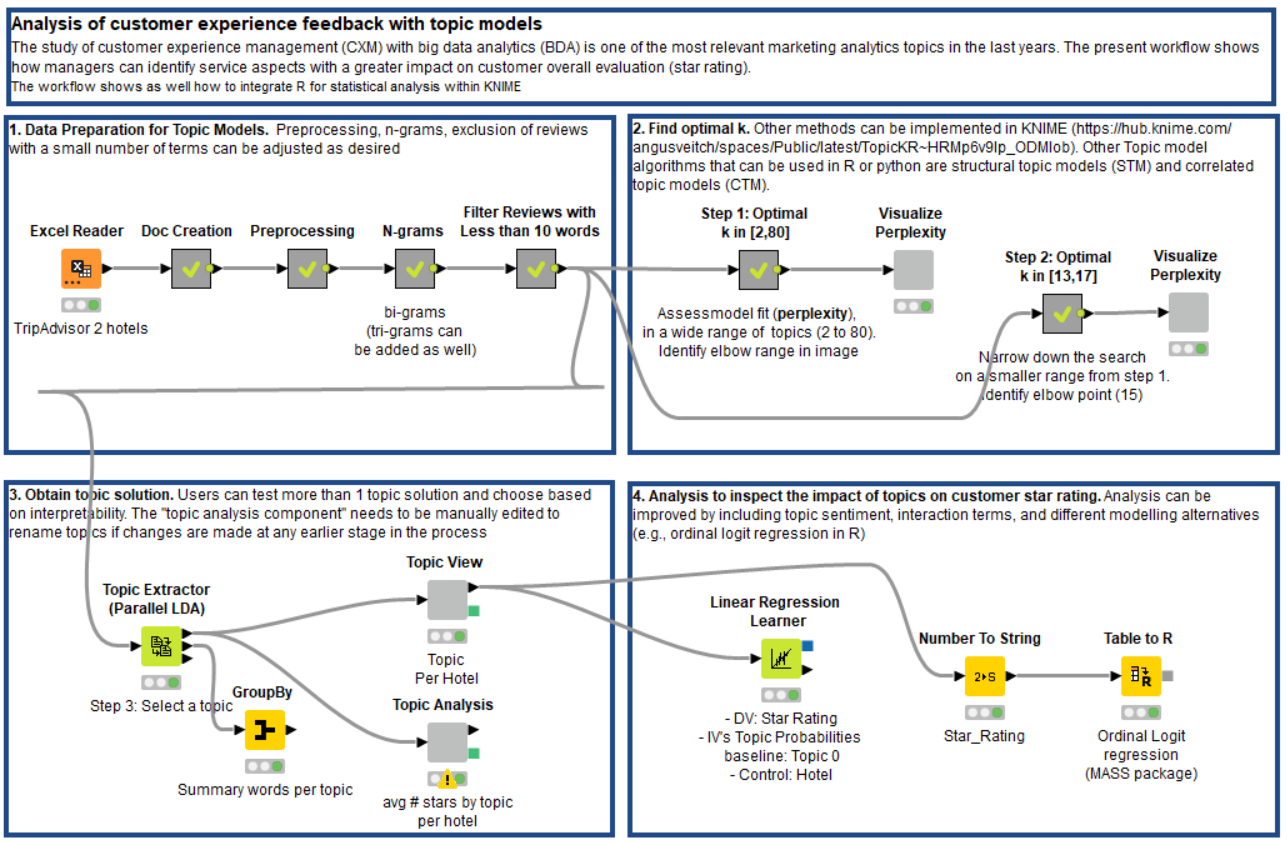
Our analysis consists of four steps (Fig. 3):
-
Prepare the data for a topic modeling algorithm.
-
Optimize the number of topics for the topic modeling algorithm.
-
Visually investigate the relations between a low number of stars and a journey’s steps.
-
Numerically investigate such relations again via the coefficients of a linear regression model.
Prepare the Data for a Topic Modeling Algorithm
Starting from the top left square in the solution workflow, the first steps implement the text preprocessing operations for the reviews.
The first steps are the classic ones in text preprocessing: Transform the review texts into Document objects, clean out the punctuation, standard stop words, prepositions as short words, and numbers from the text, reduce all words to lowercase and their stem, and remove infrequent words.
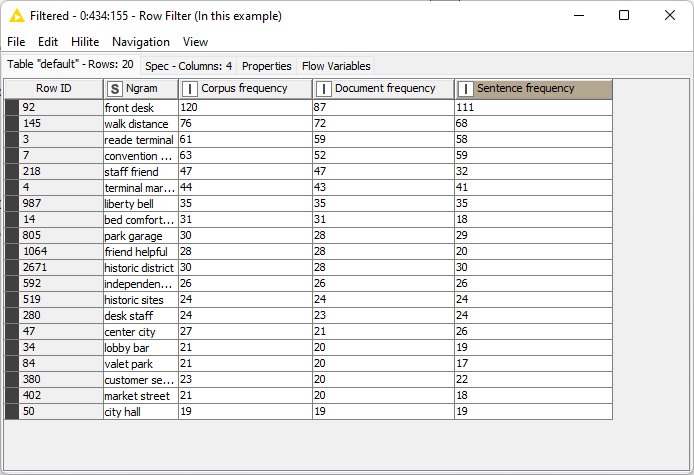
Then, instead of using single words, we focus on bigrams. In the English language, bigrams and trigrams store more information than single words. In the metanode “N-grams,” we collect all bigrams in the review dataset, and we keep only the 20 most frequent ones (Fig. 4). “Front desk” is the most frequent bigram found in the reviews, which already makes us suspect that the “front desk” is present in many reviews, for good or bad. Finally, all bigrams are identified and tagged as such in the review Document objects via a recursive loop.
Note that this listing of the 20 most frequent bigrams is arbitrary. It could have been larger, it could have been smaller. We chose 20 as a compromise between the light weight of the application and a sufficient number of bigrams for the next data analysis.
The last step is implemented in the metanode “Filter Reviews with less than 10 words” and this is what it does: It counts the words in each review so as to remove the shorter reviews, those with under 10 words.
We are now left with 432 reviews (246 for Hotel_1, 186 for Hotel_2) and each review has been reduced to its minimal terms. Remember the review with the ID 201855460? This is what remains after all preprocessing steps:
The processed review documents are now ready for the topic extraction algorithm.
Optimize the Number of Topics for the Topic Modeling Algorithm
Topic models are consistently applied in research to learn about customer experiences. Their popularity has prompted continuous developments of algorithms such as Latent Dirichlet Allocation (LDA), Correlated Topic Models (CTM), and Structural Topic Models (STM). The KNIME TextProcessing extension offers an implementation of the LDA algorithm. The other algorithms, though non-natively available, can be also introduced into a workflow via the KNIME R Integration.
Latent Dirichlet Allocation (LDA) is a generative statistical, whereby each text Document of a collection is modeled as a finite mixture over an underlying set of topics, and each topic can be described by its most frequent words. In that context, LDA is often used for topic modeling.
The KNIME node that implements LDA is the Topic Extractor (Parallel LDA). The node takes a number of Documents at its input port and produces the same Document table with topic probabilities and the assigned topic at its top output port, the words related to each topic with the corresponding weight at the middle output port, and the iteration statistics at the lowest port. The configuration window allows you to set a number of parameters, of which the most important related just to the algorithm are the number of topics, the number of keywords to describe for each topic, and parameters alpha and beta. Parameter alpha sets the prior weight of each topic in a document. Parameter beta sets the prior weight of each keyword in a topic. A small alpha (e.g. 0.1) produces a sparse topic distribution — that is, the less prominent topics for each document. A small beta (e.g. 0.001) produces a sparse keyword distribution, — the less prominent keywords to describe each topic.
As in every machine learning algorithm, there is no a priori recipe to select the best hyperparameters. Of course, the number of topics k has to be manageable if we want to represent them in a bar chart. It must be lower than 100, but between 1 and 100, there are still a lot of options. Alpha can be taken empirically as 50/k, where k is the number of topics.
The number of keywords and the value of parameter beta are less critical, since we will not use that information in the final visualization. So we went for 10 keywords per topic and beta = 0.01, as we found this to work in previous experiments.
The other configuration settings define the length and speed of the algorithm execution. We set 1,000 iterations on 16 parallel threads.
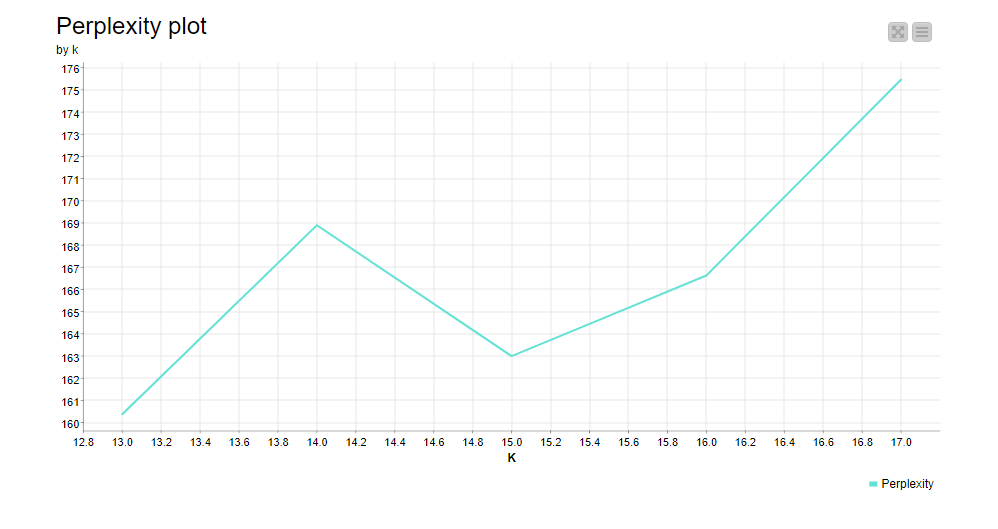
We are left with the choice of the best k. We decided to run the LDA algorithm on a number of different k to calculate the perplexity as 2^(-Log likelihood) for each k from the last iteration of the LDA algorithm, and to visualize the perplexity values against the number of topic k with a line plot. First we run this loop for k = 2, 4, 6, 8, 10, 15, 20, 25, 30, 40, 50, 60, 80. The perplexity plot showed that the only useful range for k is up to 20. Thus we focused on that range, and we ran the loop again for k = 13, 14, 15, 16, 17. The perplexity plot in Fig. 6 shows a minimum at k=15, and this is the value we used for the number of topics.
Relation Between Stars and Customer Journey: Visual Investigation
Let’s move now to square #3 in the workflow, the one in the lower left corner. Here we extract 15 topics from the reviews in the dataset using the Topic Extractor (Parallel LDA) node. After concatenating the keywords for each topic via a GroupBy node, we get the topic descriptions in table 1, to which we attach our own interpretation/identification of the touchpoint, context, or quality of the customer journey.
Table 1. Topics discovered by LDA algorithm in review dataset
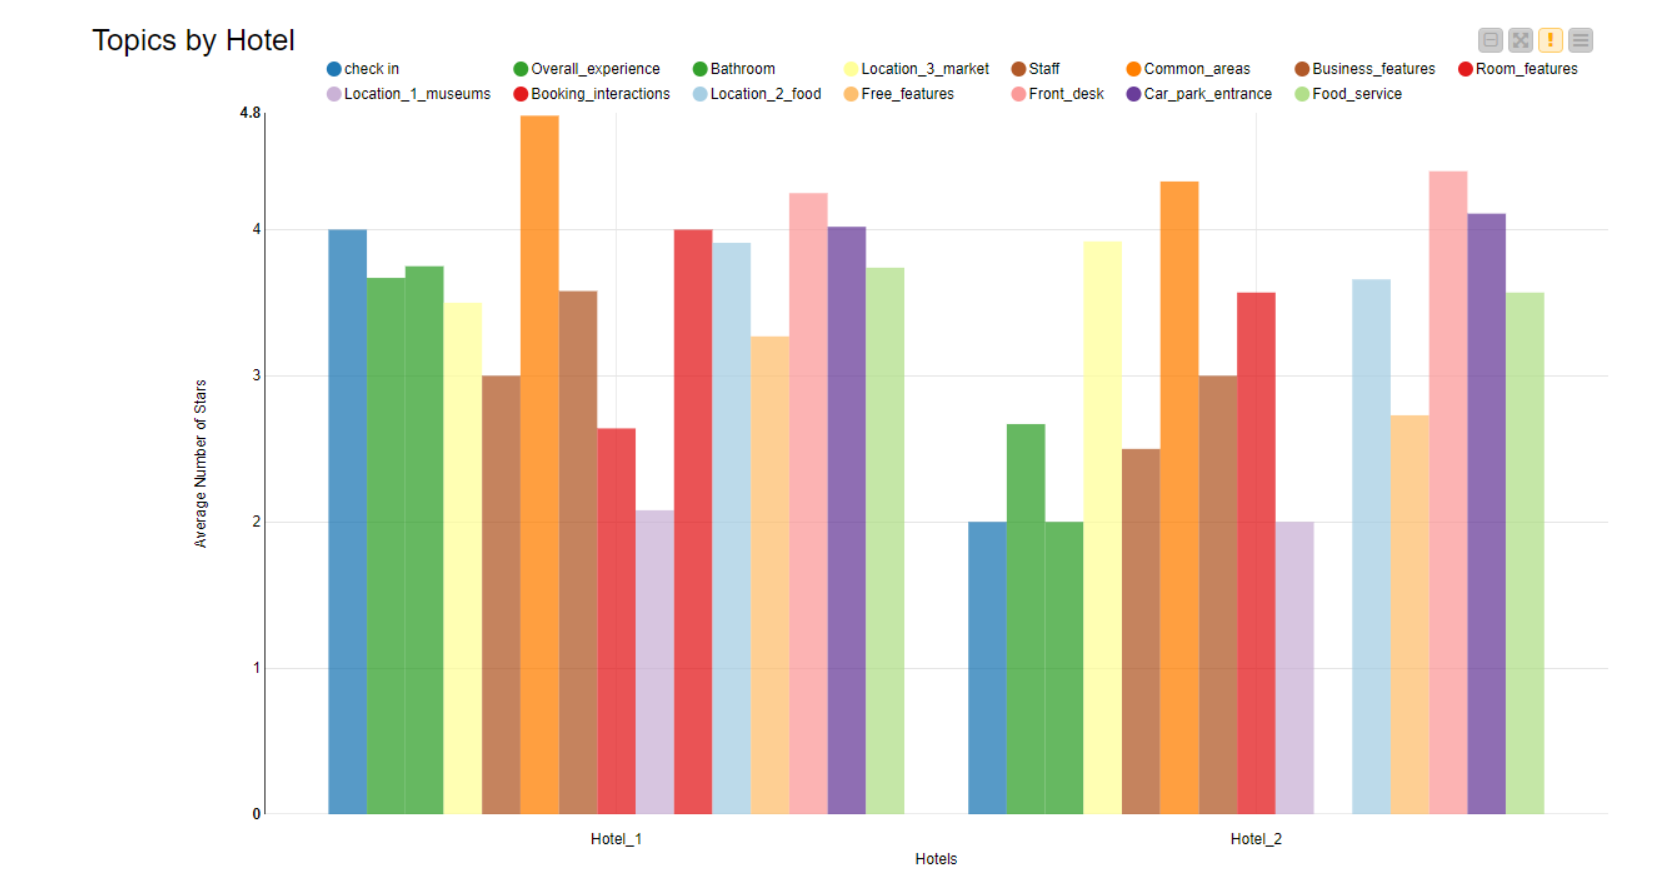
Finally, the component “Topic Analysis” displays the average number of stars calculated on all reviews assigned to the same topic for Hotel_1 on the left and Hotel_2 on the right. Just a few comments:
-
The overall experience at Hotel_2 is generally rated lower than the overall experience at Hotel_1. This can also be seen by comparing the other single bars in the chart.
-
For example, the check-in experience at Hotel_1 (4 stars on average) is definitely superior to the check-in experience at Hotel_2 (only 2 stars on average).
-
Hotel_2 should definitely work to improve its bathrooms.
-
Reviews about booking interactions are not available for Hotel_2.
And so on. Just by pairing the average star number and the review topic, this bar chart can visually indicate to us where the failures might be found in the customer journeys for both hotels.
The other component, named “Topic View,” also shows a bar chart, displaying the average score for the assigned topics for each hotel.
Relation Between Stars and Journey Steps: Linear Regression Coefficients
In this final part of the workflow, we will identify which customer experience topics are predictors of the star ratings (both good and bad). We’ll train a linear regression model to predict the star rating based on each topic score for that review and the hotel name. To do so, we select a “baseline” topic that is not included as a predictor in the regression, because otherwise we would be violating one of the regression properties related to multicollinearity. Then we will interpret the coefficients of the topics (predictors) in comparison with the baseline (topic 0=Check In).
Based on the coefficient values, we first notice that the variable Hotel_2 is non-significant (p>0.1), which indicates that the hotels do not differ significantly in their star rating evaluations. The journey touchpoints called “common areas” (Coeff=4.04, p<.05 and="" park="" entrance="" p="" are="" the="" ones="" with="" a="" more="" positive="" association="" star="" rating.="" on="" other="" hand="" topics="" around="" museums="" features="" associated="" negative="" ratings.="">
Conclusions on Stars and Reviews
We have finished this article, and we hope we have shown you how to understand the customer experience and journey by pairing review topics and star-based evaluations. In order to reach this conclusion, we had to:
- import the reviews,
- preprocess the texts,
- extract the best number of topics for the dataset,
- pair a review topic with a customer journey step,
- and visually and numerically inspect the customer journey topics with the star rating.
To show the power of this approach, we used a comparison between customer experience evaluations for two hotels.