
Understanding how specific marketing channels impact customer behavior can be challenging, especially when running randomized field experiments is not practical. For example, how do you measure the effectiveness of email subscriptions in driving purchases when customers who subscribe often differ significantly from those who don’t?
In this blog, we will explore Propensity Score Matching (PSM), a statistical technique that helps estimate the causal impact of a treatment—like receiving a marketing email—by mimicking randomization. Using KNIME Analytics Platform and its R integration, we’ll create a low-code, visual workflow that provides relevant insights for marketers.
What Is Propensity Score Matching?
Propensity Score Matching (PSM) is a method used to evaluate the effects of a treatment or intervention by creating comparable groups. In our example, the treatment is receiving or subscribing to marketing emails. PSM helps address selection bias, which arises when individuals in the treatment group (subscribers) differ significantly from those in the control group (non-subscribers).
PSM uses statistical models to calculate a propensity score—the likelihood of an individual receiving the treatment based on their characteristics. By matching individuals with similar propensity scores, PSM ensures the treatment and control groups are comparable, mimicking the results of a randomized experiment.
Why Use Propensity Score Matching?
PSM is particularly useful when:
- Randomized experiments aren’t feasible: Ethical, financial, or logistical constraints may prevent field experiments
- Reducing bias: PSM helps ensure that differences in outcomes are due to the treatment, not any pre-existing characteristics
- Transparency: PSM’s step-by-step process is easy to interpret and validate against expectations
A Workflow for Propensity Score Matching in KNIME
Our workflow is built using KNIME Analytics Platform. KNIME is a free open-source software that enables you to visually build workflows for data processing, machine learning, and AI. Its intuitive interface makes advanced analytics accessible to both beginners and experts.
The KNIME workflow adapts a use case from the book Attribution Modeling by Hans de Haan. The input dataset contains 50,000 simulated customer journeys with eight touchpoints, such as email clicks, website visits, and banner impressions. About 25% of these journeys result in purchases.
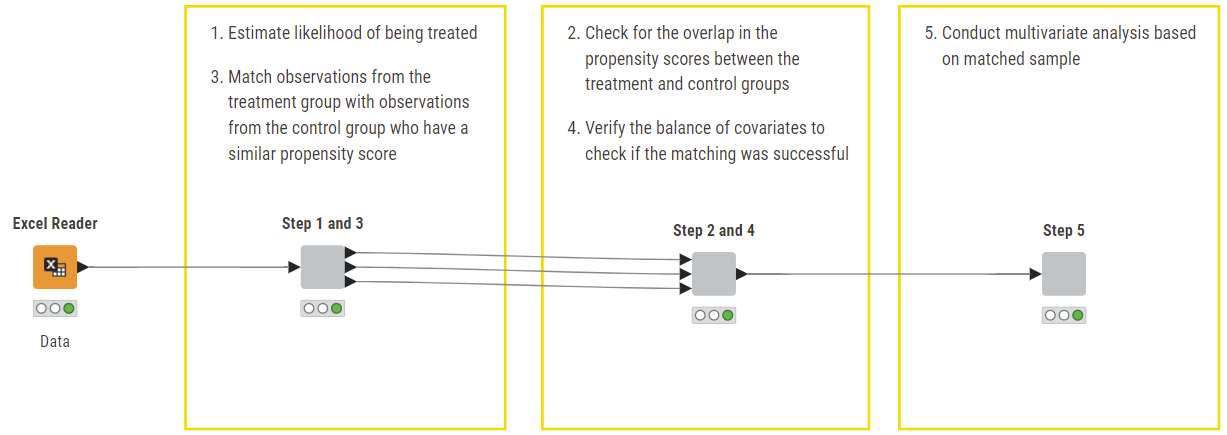
With regards to how the steps are grouped in the workflow above, Steps 1 and 3 are combined because they both involve calculating propensity score and matching, which are related processes in PSM. Similarly, for Steps 2 and 4, they look at overall assessment and verification of comparability between groups. The goal is to apply PSM to evaluate the purchase likelihood between customers who have subscribed to the company’s email and those who have not.
Note: The workflow used in this article is available publicly and free to download on the KNIME Community Hub. You can find the workflow on KNIME Hub at Attribution Modeling - Propensity Score Matching.
Step 1: Estimate the likelihood of an individual being treated
To measure the impact of email subscriptions, we first estimate the propensity of a customer subscribing using predictors unaffected by the treatment. We use exogenous, meaning their values are unaffected by the treatment, because they are measured before the introduction of the email service. For our case we use the following two features below that fit this requirement:
- Relationship length
- Log-transformed Customer Lifetime Value (CLV)
Using logistic regression via the R Snippet node, we calculate propensity scores—the probability of a customer subscribing based on these predictors. These scores later help match similar customers, ensuring a balanced comparison.
Step 2: Check Overlap in Propensity Scores Between Treated and Untreated/Control
For valid matching, treated (subscribed) and untreated (not subscribed) customers must have overlapping propensity scores. This ensures each treated customer has a comparable untreated counterpart. Using a Scatter Plot node shown below, we visualize the score distribution.
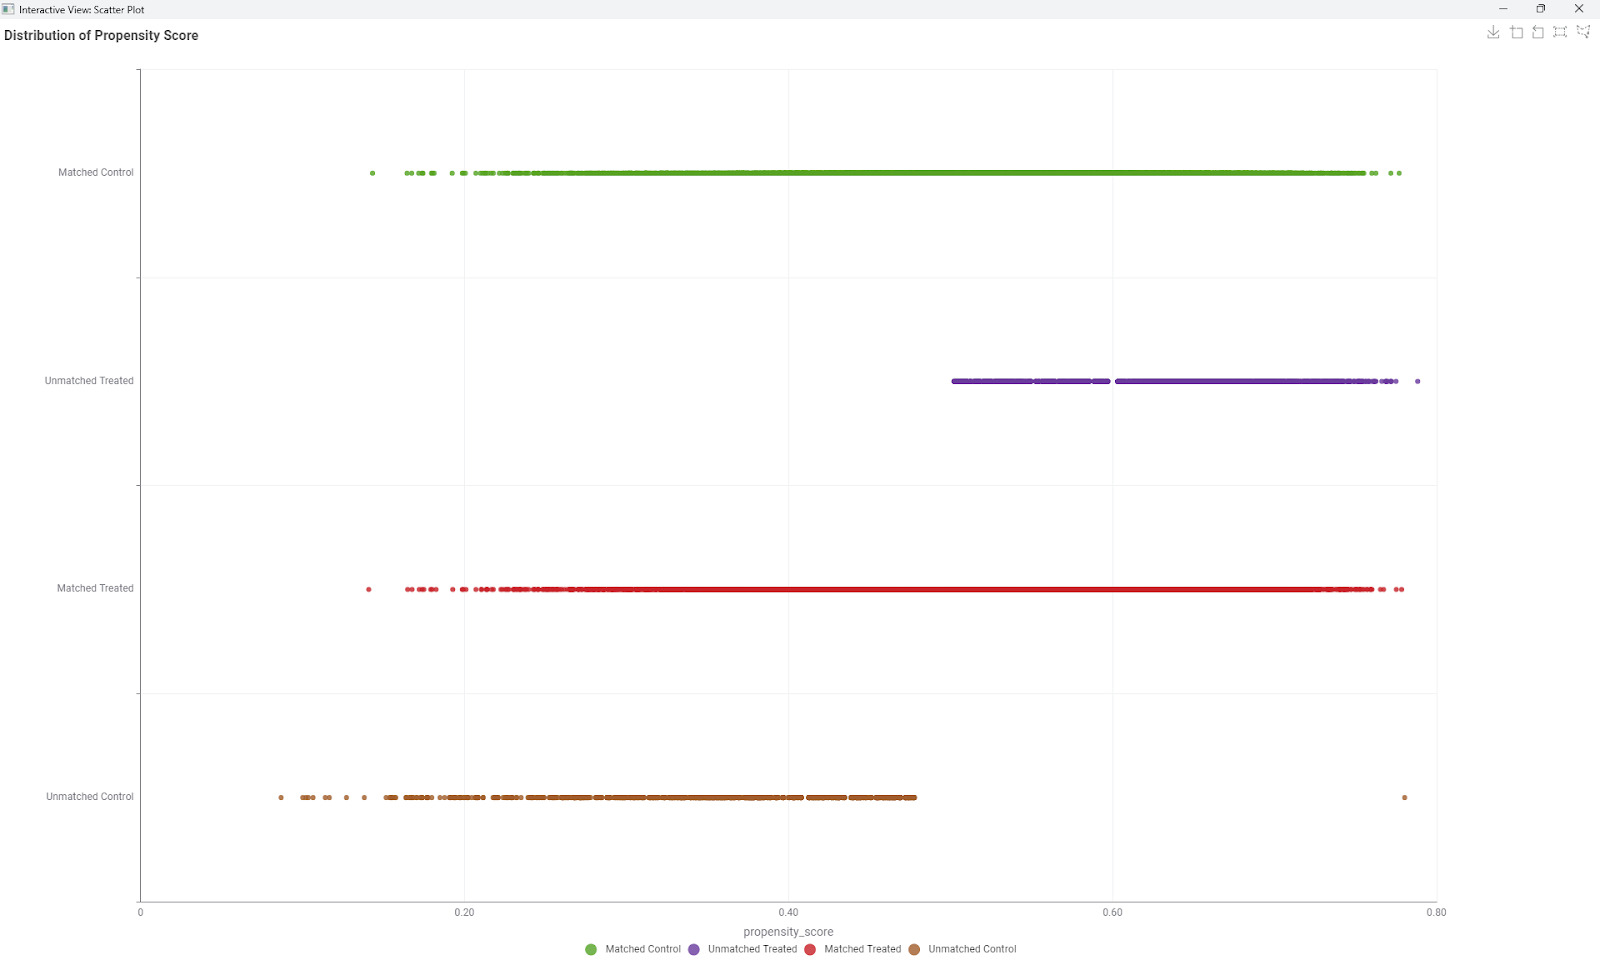
Before matching, overlap is limited shown by the brown and purple plots representing the data points before matching; after matching, the treated and control groups align much better as shown by the green and red plots.
Step 3: Match Treated and Untreated Groups
In this step, we match treated customers (those subscribed to emails) with untreated customers (those who did not subscribe) based on their propensity scores. This helps to ensure both groups are comparable. By doing so, we can more accurately measure the impact of email subscription on outcomes like purchase likelihood.
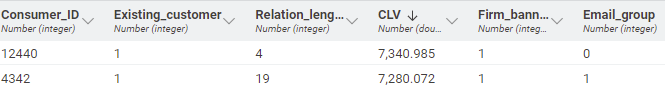
Using the R package MatchIt with the R Snippet Node in KNIME, we match customers based on their propensity scores with a caliper value of 0.05 standard deviations. A smaller caliper results in more precise matches but reduces sample size, while a larger caliper increases sample size but may lower match quality. In the figure below, we show an example matching resulting from this.
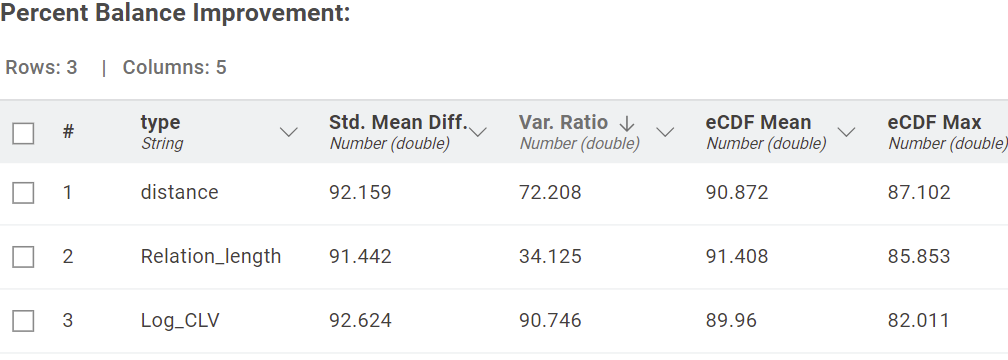
In the visualization below, you can see the final percent balance improvement results in a table that shows the improvement from due to matching.
Step 4: Verify Balance
Next, we verify whether matching successfully balances key covariates between groups using Standardized Mean Difference (SMD). For example, SMD improvements for predictors like relationship length and log-transformed CLV confirm that the treated and control groups are now comparable.
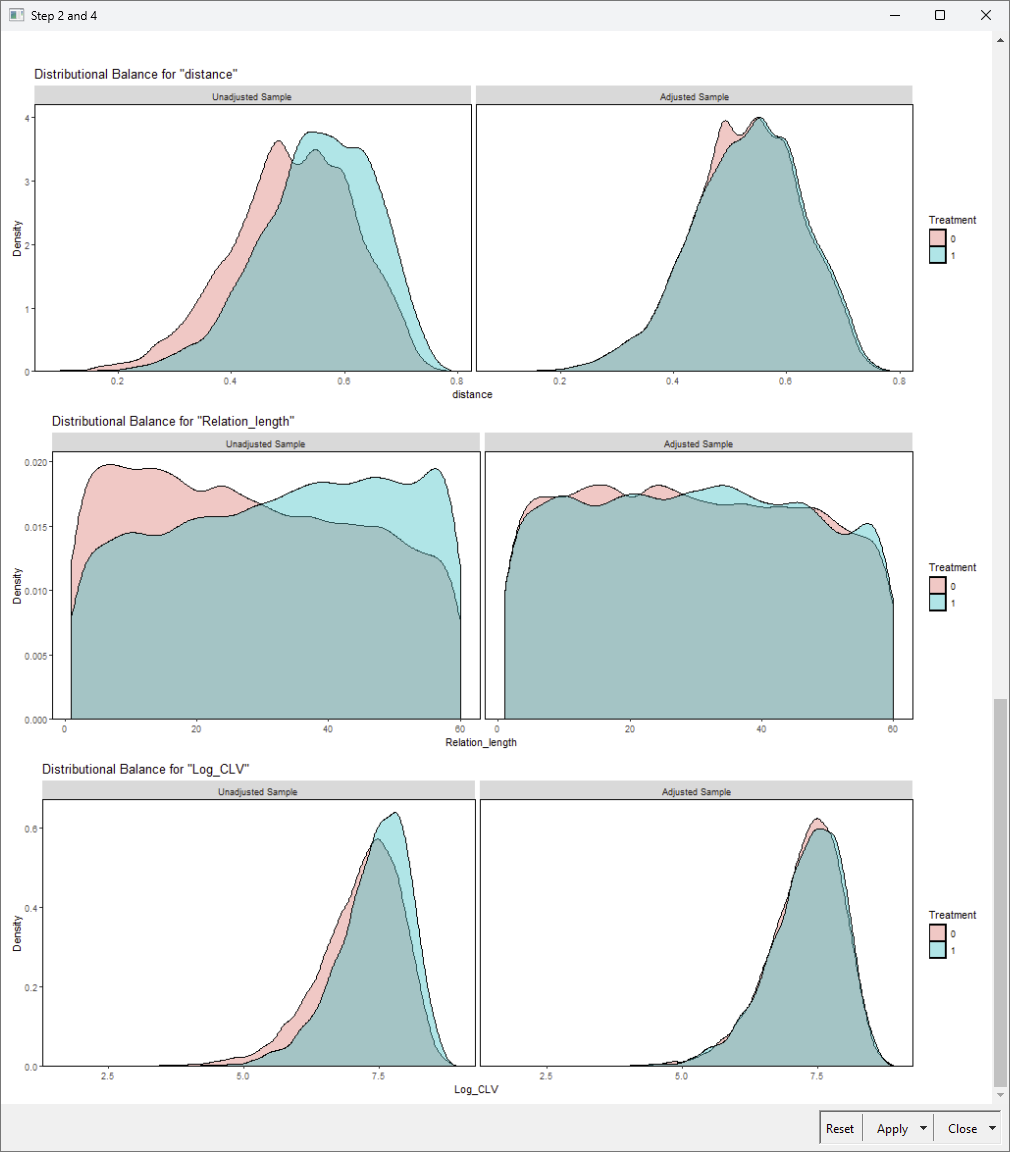
Going from the left half (unmatched) to the right half (matched), we can see improved overlap between the graphs after the matching is applied to the samples.
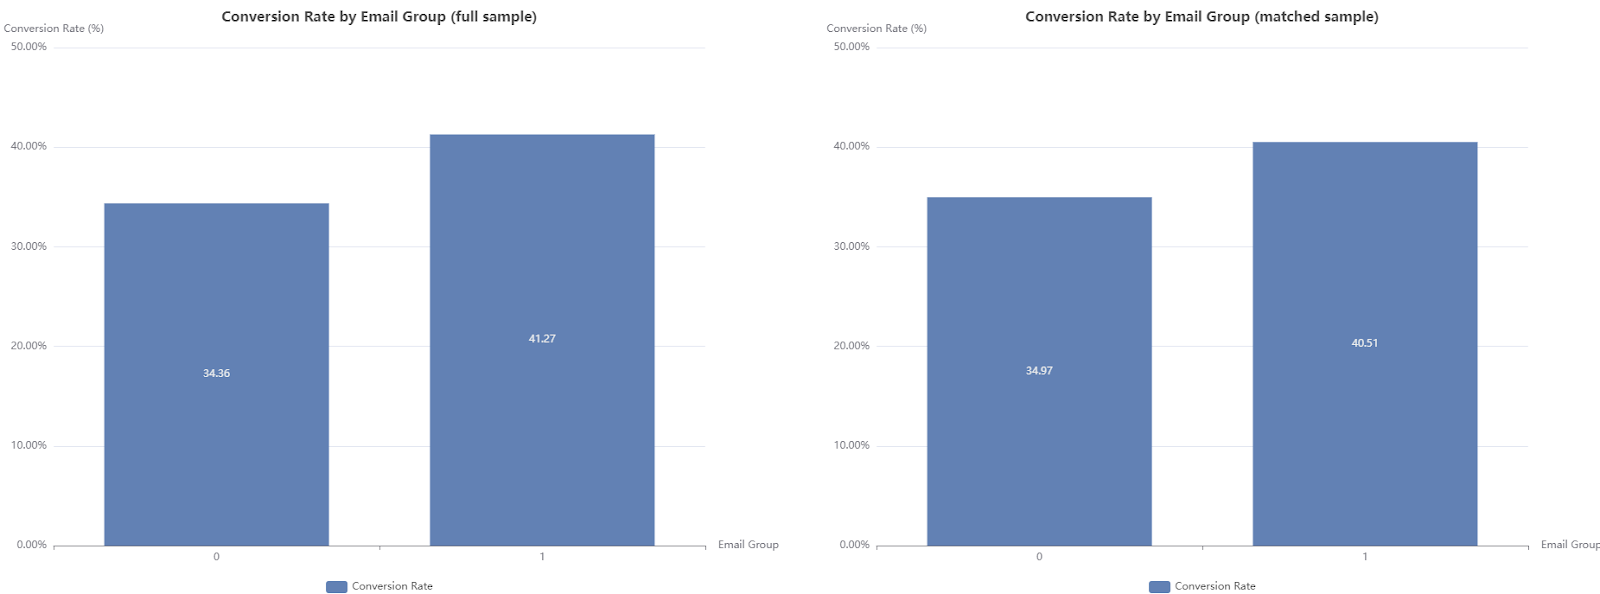
Step 5: Conduct Multivariate Analysis
Finally, we estimate the causal impact of email subscriptions on purchase likelihood. In the matched sample, email subscribers show a 27.1% higher likelihood of making a purchase compared to non-subscribers.
Get started with Propensity Score Matching in KNIME
Propensity Score Matching is a powerful method for evaluating the impact of marketing channels when experiments aren’t an option. By reducing selection bias and ensuring valid comparisons, PSM provides marketers with actionable insights they can trust.
Using KNIME Analytics Platform, we created a workflow for marketers to apply Propensity Score Matching with minimal coding. Visual workflows make advanced analytics accessible to both technical and non-technical users.To try it yourself, explore the workflow on the KNIME Community Hub and start applying PSM to your own marketing challenges!